Cities with the Highest Percentage of Population Employed in Installation, Maintenance & Repair in California
RELATED REPORTS & OPTIONS
Installation, Maintenance & Repair
California
Compare Cities
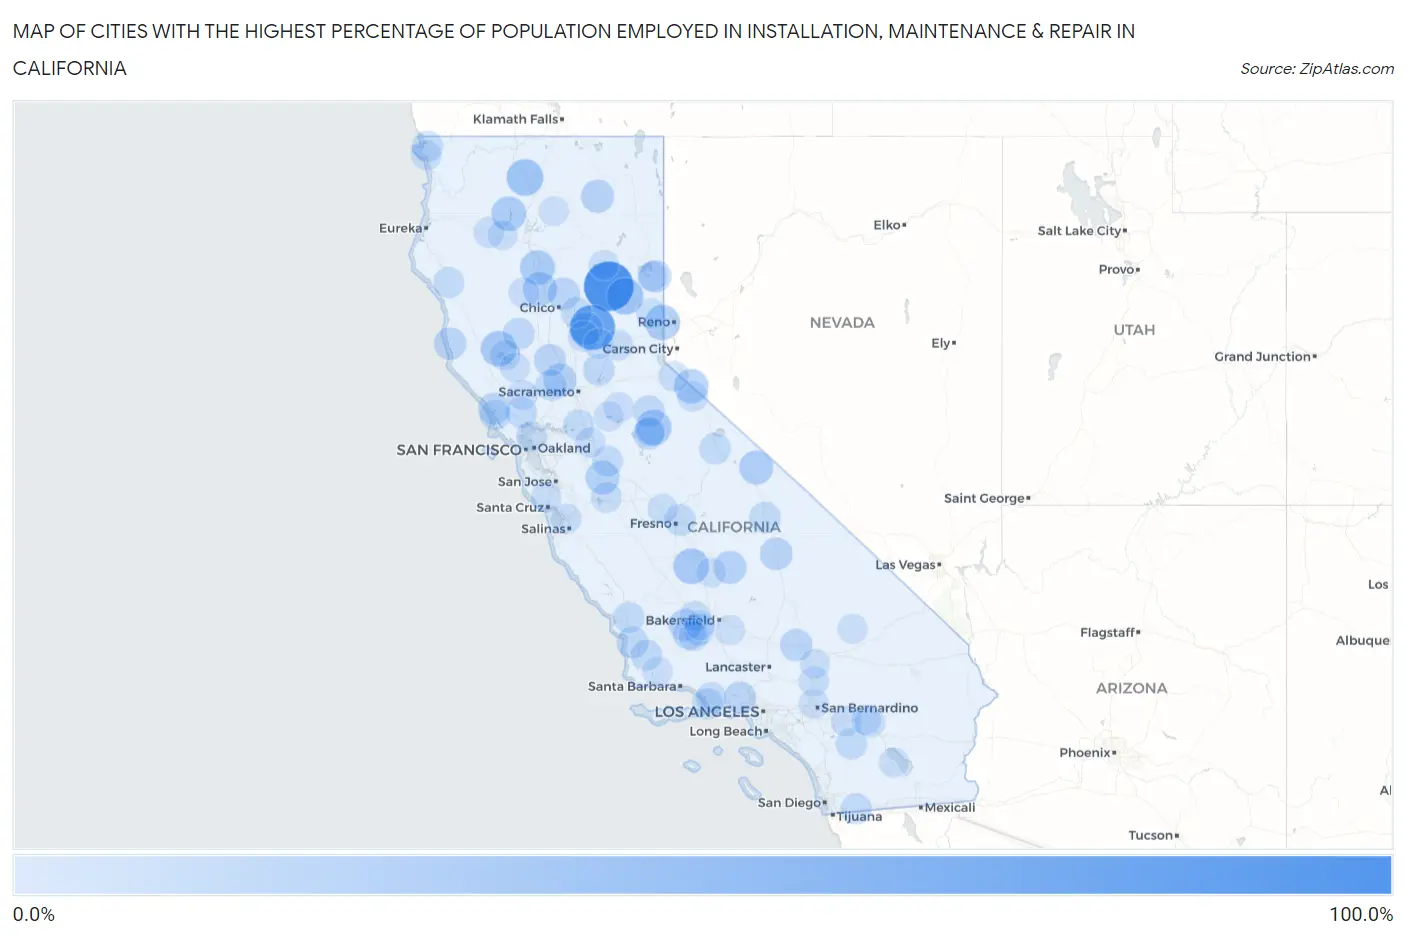
Map of Cities with the Highest Percentage of Population Employed in Installation, Maintenance & Repair in California
0.0%
100.0%
Cities with the Highest Percentage of Population Employed in Installation, Maintenance & Repair in California
| City | % Employed | vs State | vs National | |
| 1. | Keddie | 100.0% | 2.6%(+97.4)#1 | 3.1%(+96.9)#8 |
| 2. | Challenge Brownsville | 78.5% | 2.6%(+76.0)#2 | 3.1%(+75.5)#23 |
| 3. | Cromberg | 39.3% | 2.6%(+36.7)#3 | 3.1%(+36.2)#151 |
| 4. | Edgewood | 38.9% | 2.6%(+36.3)#4 | 3.1%(+35.8)#155 |
| 5. | Old River | 38.2% | 2.6%(+35.7)#5 | 3.1%(+35.2)#164 |
| 6. | Waukena | 33.3% | 2.6%(+30.8)#6 | 3.1%(+30.3)#224 |
| 7. | Upper Lake | 33.3% | 2.6%(+30.7)#7 | 3.1%(+30.2)#234 |
| 8. | Sierra Village | 32.7% | 2.6%(+30.1)#8 | 3.1%(+29.6)#241 |
| 9. | Verdi | 31.5% | 2.6%(+28.9)#9 | 3.1%(+28.4)#258 |
| 10. | La Grange | 30.4% | 2.6%(+27.9)#10 | 3.1%(+27.4)#278 |
| 11. | Bend | 29.7% | 2.6%(+27.1)#11 | 3.1%(+26.6)#289 |
| 12. | Trinity Center | 29.3% | 2.6%(+26.7)#12 | 3.1%(+26.2)#297 |
| 13. | Topaz | 28.6% | 2.6%(+26.0)#13 | 3.1%(+25.5)#317 |
| 14. | Richfield | 26.9% | 2.6%(+24.4)#14 | 3.1%(+23.9)#356 |
| 15. | Chalfant | 26.2% | 2.6%(+23.6)#15 | 3.1%(+23.1)#379 |
| 16. | Crows Landing | 25.3% | 2.6%(+22.7)#16 | 3.1%(+22.2)#405 |
| 17. | Rackerby | 24.1% | 2.6%(+21.6)#17 | 3.1%(+21.1)#451 |
| 18. | Yolo | 23.2% | 2.6%(+20.7)#18 | 3.1%(+20.2)#487 |
| 19. | Lookout | 22.2% | 2.6%(+19.7)#19 | 3.1%(+19.2)#532 |
| 20. | Springville | 22.1% | 2.6%(+19.6)#20 | 3.1%(+19.1)#537 |
| 21. | Mountain Meadows | 20.8% | 2.6%(+18.2)#21 | 3.1%(+17.7)#619 |
| 22. | Herlong | 20.4% | 2.6%(+17.8)#22 | 3.1%(+17.3)#644 |
| 23. | Mckittrick | 20.0% | 2.6%(+17.4)#23 | 3.1%(+16.9)#677 |
| 24. | Cartago | 20.0% | 2.6%(+17.4)#24 | 3.1%(+16.9)#680 |
| 25. | Bear Valley Cdp Alpine County | 19.6% | 2.6%(+17.0)#25 | 3.1%(+16.5)#699 |
| 26. | Cohasset | 19.4% | 2.6%(+16.8)#26 | 3.1%(+16.3)#710 |
| 27. | Albion | 18.8% | 2.6%(+16.2)#27 | 3.1%(+15.7)#746 |
| 28. | Boron | 18.6% | 2.6%(+16.0)#28 | 3.1%(+15.5)#764 |
| 29. | College City | 18.3% | 2.6%(+15.7)#29 | 3.1%(+15.2)#788 |
| 30. | Santa Susana | 17.3% | 2.6%(+14.8)#30 | 3.1%(+14.3)#871 |
| 31. | Bodega | 17.1% | 2.6%(+14.5)#31 | 3.1%(+14.0)#896 |
| 32. | Stonyford | 16.7% | 2.6%(+14.1)#32 | 3.1%(+13.6)#946 |
| 33. | Dorrington | 16.6% | 2.6%(+14.0)#33 | 3.1%(+13.5)#963 |
| 34. | Soulsbyville | 16.4% | 2.6%(+13.8)#34 | 3.1%(+13.3)#979 |
| 35. | Fellows | 16.0% | 2.6%(+13.4)#35 | 3.1%(+12.9)#1,024 |
| 36. | Blacklake | 16.0% | 2.6%(+13.4)#36 | 3.1%(+12.9)#1,028 |
| 37. | Newcastle | 15.4% | 2.6%(+12.8)#37 | 3.1%(+12.3)#1,094 |
| 38. | Anza | 15.1% | 2.6%(+12.6)#38 | 3.1%(+12.0)#1,136 |
| 39. | Independence | 15.1% | 2.6%(+12.5)#39 | 3.1%(+12.0)#1,143 |
| 40. | June Lake | 15.1% | 2.6%(+12.5)#40 | 3.1%(+12.0)#1,145 |
| 41. | Channel Islands Beach | 14.6% | 2.6%(+12.0)#41 | 3.1%(+11.5)#1,224 |
| 42. | Sisquoc | 14.5% | 2.6%(+12.0)#42 | 3.1%(+11.5)#1,228 |
| 43. | Garden Farms | 14.4% | 2.6%(+11.8)#43 | 3.1%(+11.3)#1,248 |
| 44. | Tarpey Village | 14.2% | 2.6%(+11.7)#44 | 3.1%(+11.2)#1,290 |
| 45. | El Verano | 14.0% | 2.6%(+11.4)#45 | 3.1%(+10.9)#1,342 |
| 46. | Madison | 13.9% | 2.6%(+11.4)#46 | 3.1%(+10.9)#1,345 |
| 47. | Fort Dick | 13.8% | 2.6%(+11.2)#47 | 3.1%(+10.7)#1,386 |
| 48. | Terminous | 13.6% | 2.6%(+11.1)#48 | 3.1%(+10.5)#1,414 |
| 49. | Cherokee | 13.6% | 2.6%(+11.0)#49 | 3.1%(+10.5)#1,426 |
| 50. | Dustin Acres | 13.4% | 2.6%(+10.9)#50 | 3.1%(+10.4)#1,453 |
| 51. | Benbow | 13.4% | 2.6%(+10.9)#51 | 3.1%(+10.4)#1,458 |
| 52. | Potrero | 12.9% | 2.6%(+10.3)#52 | 3.1%(+9.79)#1,609 |
| 53. | Dillon Beach | 12.6% | 2.6%(+10.1)#53 | 3.1%(+9.56)#1,658 |
| 54. | Bystrom | 12.6% | 2.6%(+10.0)#54 | 3.1%(+9.49)#1,679 |
| 55. | Loma Rica | 12.6% | 2.6%(+10.00)#55 | 3.1%(+9.48)#1,685 |
| 56. | Junction City | 12.2% | 2.6%(+9.68)#56 | 3.1%(+9.17)#1,769 |
| 57. | Lucerne | 12.1% | 2.6%(+9.57)#57 | 3.1%(+9.06)#1,791 |
| 58. | Oak Run | 12.0% | 2.6%(+9.42)#58 | 3.1%(+8.90)#1,837 |
| 59. | Walker | 12.0% | 2.6%(+9.41)#59 | 3.1%(+8.90)#1,839 |
| 60. | El Rio | 11.8% | 2.6%(+9.28)#60 | 3.1%(+8.76)#1,879 |
| 61. | Buttonwillow | 11.4% | 2.6%(+8.84)#61 | 3.1%(+8.33)#2,019 |
| 62. | Santa Nella | 11.4% | 2.6%(+8.82)#62 | 3.1%(+8.31)#2,028 |
| 63. | Cabazon | 11.2% | 2.6%(+8.60)#63 | 3.1%(+8.09)#2,088 |
| 64. | Cold Springs Cdp El Dorado County | 11.1% | 2.6%(+8.59)#64 | 3.1%(+8.07)#2,090 |
| 65. | Alpine Village | 11.1% | 2.6%(+8.55)#65 | 3.1%(+8.04)#2,107 |
| 66. | Rollingwood | 11.1% | 2.6%(+8.51)#66 | 3.1%(+8.00)#2,129 |
| 67. | Bayview Cdp Contra Costa County | 11.0% | 2.6%(+8.49)#67 | 3.1%(+7.98)#2,132 |
| 68. | Alta | 11.0% | 2.6%(+8.47)#68 | 3.1%(+7.96)#2,138 |
| 69. | Flournoy | 10.7% | 2.6%(+8.16)#69 | 3.1%(+7.65)#2,249 |
| 70. | Twain Harte | 10.7% | 2.6%(+8.11)#70 | 3.1%(+7.59)#2,264 |
| 71. | Bertsch Oceanview | 10.4% | 2.6%(+7.86)#71 | 3.1%(+7.35)#2,361 |
| 72. | French Camp | 10.4% | 2.6%(+7.85)#72 | 3.1%(+7.34)#2,364 |
| 73. | Deer Park | 10.2% | 2.6%(+7.65)#73 | 3.1%(+7.14)#2,463 |
| 74. | Casa Loma | 10.1% | 2.6%(+7.55)#74 | 3.1%(+7.04)#2,511 |
| 75. | Jackson | 10.1% | 2.6%(+7.51)#75 | 3.1%(+7.00)#2,519 |
| 76. | Lompico | 10.0% | 2.6%(+7.46)#76 | 3.1%(+6.95)#2,536 |
| 77. | Elkhorn | 10.0% | 2.6%(+7.44)#77 | 3.1%(+6.93)#2,540 |
| 78. | Sky Valley | 9.7% | 2.6%(+7.16)#78 | 3.1%(+6.65)#2,721 |
| 79. | Rough And Ready | 9.7% | 2.6%(+7.16)#79 | 3.1%(+6.65)#2,726 |
| 80. | Parksdale | 9.6% | 2.6%(+7.00)#80 | 3.1%(+6.49)#2,811 |
| 81. | Mountain View Acres | 9.5% | 2.6%(+6.97)#81 | 3.1%(+6.46)#2,817 |
| 82. | Ridgecrest Heights | 9.5% | 2.6%(+6.97)#82 | 3.1%(+6.46)#2,823 |
| 83. | Taft Heights | 9.3% | 2.6%(+6.75)#83 | 3.1%(+6.23)#2,945 |
| 84. | Sierra Brooks | 9.3% | 2.6%(+6.71)#84 | 3.1%(+6.20)#2,963 |
| 85. | Clear Creek | 9.2% | 2.6%(+6.67)#85 | 3.1%(+6.16)#2,985 |
| 86. | Johnson Park | 9.2% | 2.6%(+6.61)#86 | 3.1%(+6.10)#3,026 |
| 87. | Ballard | 9.2% | 2.6%(+6.60)#87 | 3.1%(+6.09)#3,028 |
| 88. | Edmundson Acres | 9.1% | 2.6%(+6.53)#88 | 3.1%(+6.02)#3,058 |
| 89. | Big Bend | 9.1% | 2.6%(+6.53)#89 | 3.1%(+6.02)#3,066 |
| 90. | Lower Lake | 9.0% | 2.6%(+6.48)#90 | 3.1%(+5.97)#3,101 |
| 91. | Muscoy | 9.0% | 2.6%(+6.40)#91 | 3.1%(+5.89)#3,146 |
| 92. | Tupman | 8.9% | 2.6%(+6.37)#92 | 3.1%(+5.86)#3,171 |
| 93. | Camanche North Shore | 8.9% | 2.6%(+6.37)#93 | 3.1%(+5.86)#3,175 |
| 94. | Fort Irwin | 8.8% | 2.6%(+6.24)#94 | 3.1%(+5.73)#3,254 |
| 95. | Salton City | 8.8% | 2.6%(+6.22)#95 | 3.1%(+5.71)#3,274 |
| 96. | Patton Village | 8.7% | 2.6%(+6.19)#96 | 3.1%(+5.68)#3,305 |
| 97. | Silver Lakes | 8.5% | 2.6%(+5.95)#97 | 3.1%(+5.44)#3,501 |
| 98. | Desert Edge | 8.5% | 2.6%(+5.92)#98 | 3.1%(+5.41)#3,520 |
| 99. | Poplar Cotton Center | 8.5% | 2.6%(+5.90)#99 | 3.1%(+5.39)#3,539 |
| 100. | Lewiston | 8.5% | 2.6%(+5.90)#100 | 3.1%(+5.39)#3,542 |
Common Questions
What are the Top 10 Cities with the Highest Percentage of Population Employed in Installation, Maintenance & Repair in California?
Top 10 Cities with the Highest Percentage of Population Employed in Installation, Maintenance & Repair in California are:
#1
100.0%
#2
78.5%
#3
39.3%
#4
38.9%
#5
33.3%
#6
33.3%
#7
32.7%
#8
31.5%
#9
29.7%
#10
29.3%
What city has the Highest Percentage of Population Employed in Installation, Maintenance & Repair in California?
Keddie has the Highest Percentage of Population Employed in Installation, Maintenance & Repair in California with 100.0%.
What is the Percentage of Population Employed in Installation, Maintenance & Repair in the State of California?
Percentage of Population Employed in Installation, Maintenance & Repair in California is 2.6%.
What is the Percentage of Population Employed in Installation, Maintenance & Repair in the United States?
Percentage of Population Employed in Installation, Maintenance & Repair in the United States is 3.1%.