Silver Lakes, CA Map & Demographics
Silver Lakes Map
Silver Lakes Overview
$43,661
PER CAPITA INCOME
$108,469
AVG FAMILY INCOME
$105,993
AVG HOUSEHOLD INCOME
29.1%
WAGE / INCOME GAP [ % ]
70.9¢/ $1
WAGE / INCOME GAP [ $ ]
0.38
INEQUALITY / GINI INDEX
5,532
TOTAL POPULATION
2,824
MALE POPULATION
2,708
FEMALE POPULATION
104.28
MALES / 100 FEMALES
95.89
FEMALES / 100 MALES
39.5
MEDIAN AGE
3.0
AVG FAMILY SIZE
2.6
AVG HOUSEHOLD SIZE
2,624
LABOR FORCE [ PEOPLE ]
59.4%
PERCENT IN LABOR FORCE
2.8%
UNEMPLOYMENT RATE
Income in Silver Lakes
Income Overview in Silver Lakes
Per Capita Income in Silver Lakes is $43,661, while median incomes of families and households are $108,469 and $105,993 respectively.
| Characteristic | Number | Measure |
| Per Capita Income | 5,532 | $43,661 |
| Median Family Income | 1,573 | $108,469 |
| Mean Family Income | 1,573 | $120,321 |
| Median Household Income | 2,150 | $105,993 |
| Mean Household Income | 2,150 | $111,969 |
| Income Deficit | 1,573 | $0 |
| Wage / Income Gap (%) | 5,532 | 29.10% |
| Wage / Income Gap ($) | 5,532 | 70.90¢ per $1 |
| Gini / Inequality Index | 5,532 | 0.38 |
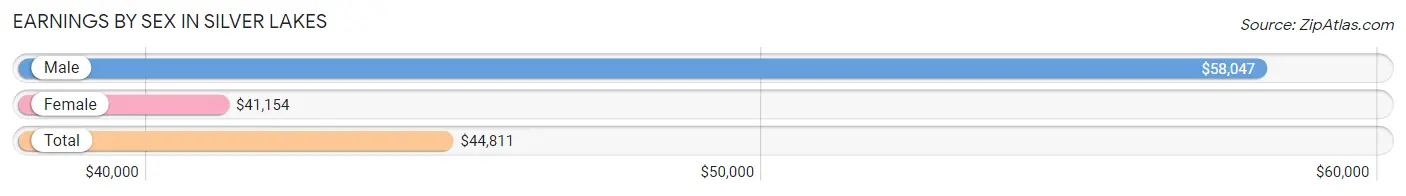
Earnings by Sex in Silver Lakes
Average Earnings in Silver Lakes are $44,811, $58,047 for men and $41,154 for women, a difference of 29.1%.
| Sex | Number | Average Earnings |
| Male | 1,558 (58.0%) | $58,047 |
| Female | 1,128 (42.0%) | $41,154 |
| Total | 2,686 (100.0%) | $44,811 |
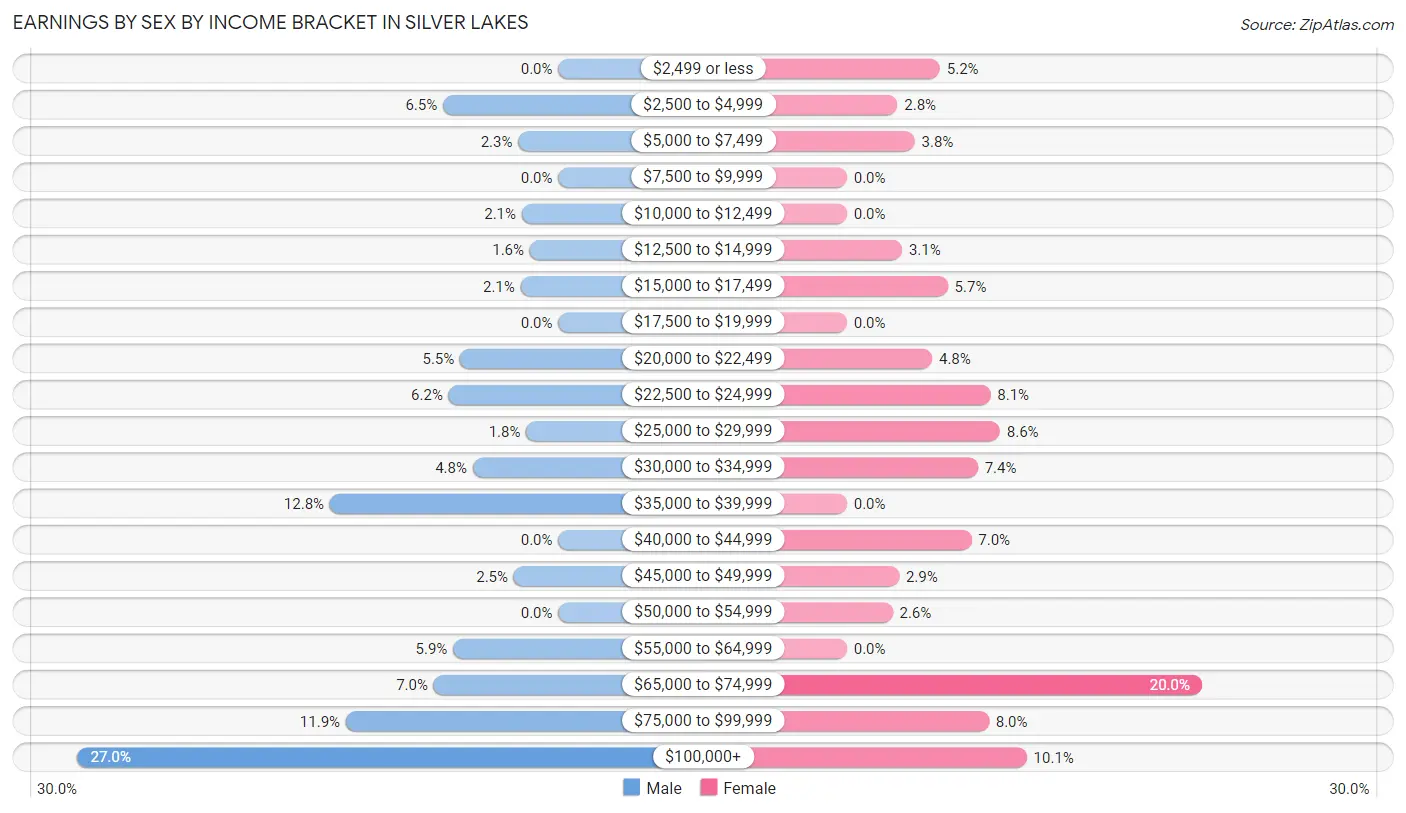
Earnings by Sex by Income Bracket in Silver Lakes
The most common earnings brackets in Silver Lakes are $100,000+ for men (421 | 27.0%) and $65,000 to $74,999 for women (225 | 20.0%).
| Income | Male | Female |
| $2,499 or less | 0 (0.0%) | 59 (5.2%) |
| $2,500 to $4,999 | 101 (6.5%) | 32 (2.8%) |
| $5,000 to $7,499 | 35 (2.2%) | 43 (3.8%) |
| $7,500 to $9,999 | 0 (0.0%) | 0 (0.0%) |
| $10,000 to $12,499 | 32 (2.1%) | 0 (0.0%) |
| $12,500 to $14,999 | 25 (1.6%) | 35 (3.1%) |
| $15,000 to $17,499 | 33 (2.1%) | 64 (5.7%) |
| $17,500 to $19,999 | 0 (0.0%) | 0 (0.0%) |
| $20,000 to $22,499 | 86 (5.5%) | 54 (4.8%) |
| $22,500 to $24,999 | 96 (6.2%) | 91 (8.1%) |
| $25,000 to $29,999 | 28 (1.8%) | 97 (8.6%) |
| $30,000 to $34,999 | 75 (4.8%) | 83 (7.4%) |
| $35,000 to $39,999 | 200 (12.8%) | 0 (0.0%) |
| $40,000 to $44,999 | 0 (0.0%) | 79 (7.0%) |
| $45,000 to $49,999 | 39 (2.5%) | 33 (2.9%) |
| $50,000 to $54,999 | 0 (0.0%) | 29 (2.6%) |
| $55,000 to $64,999 | 92 (5.9%) | 0 (0.0%) |
| $65,000 to $74,999 | 109 (7.0%) | 225 (20.0%) |
| $75,000 to $99,999 | 186 (11.9%) | 90 (8.0%) |
| $100,000+ | 421 (27.0%) | 114 (10.1%) |
| Total | 1,558 (100.0%) | 1,128 (100.0%) |
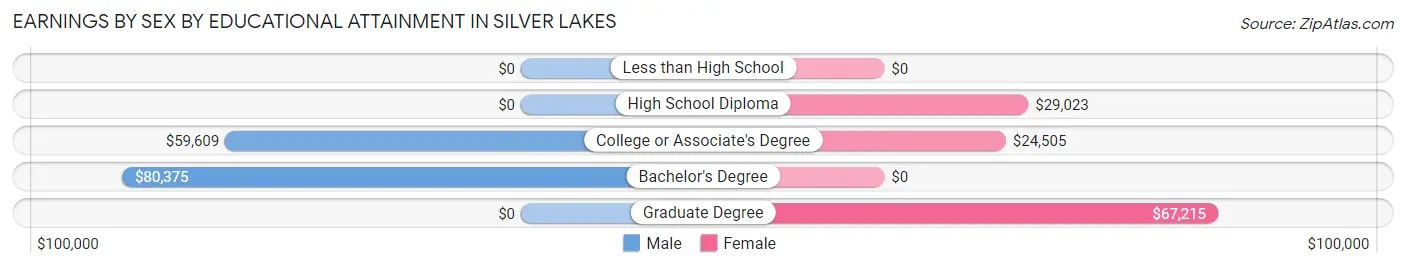
Earnings by Sex by Educational Attainment in Silver Lakes
Average earnings in Silver Lakes are $69,429 for men and $42,898 for women, a difference of 38.2%. Men with an educational attainment of bachelor's degree enjoy the highest average annual earnings of $80,375, while those with college or associate's degree education earn the least with $59,609. Women with an educational attainment of graduate degree earn the most with the average annual earnings of $67,215, while those with college or associate's degree education have the smallest earnings of $24,505.
| Educational Attainment | Male Income | Female Income |
| Less than High School | - | - |
| High School Diploma | - | - |
| College or Associate's Degree | $59,609 | $24,505 |
| Bachelor's Degree | $80,375 | $0 |
| Graduate Degree | - | - |
| Total | $69,429 | $42,898 |
Family Income in Silver Lakes
Family Income Brackets in Silver Lakes
According to the Silver Lakes family income data, there are 484 families falling into the $100,000 to $149,999 income range, which is the most common income bracket and makes up 30.8% of all families.
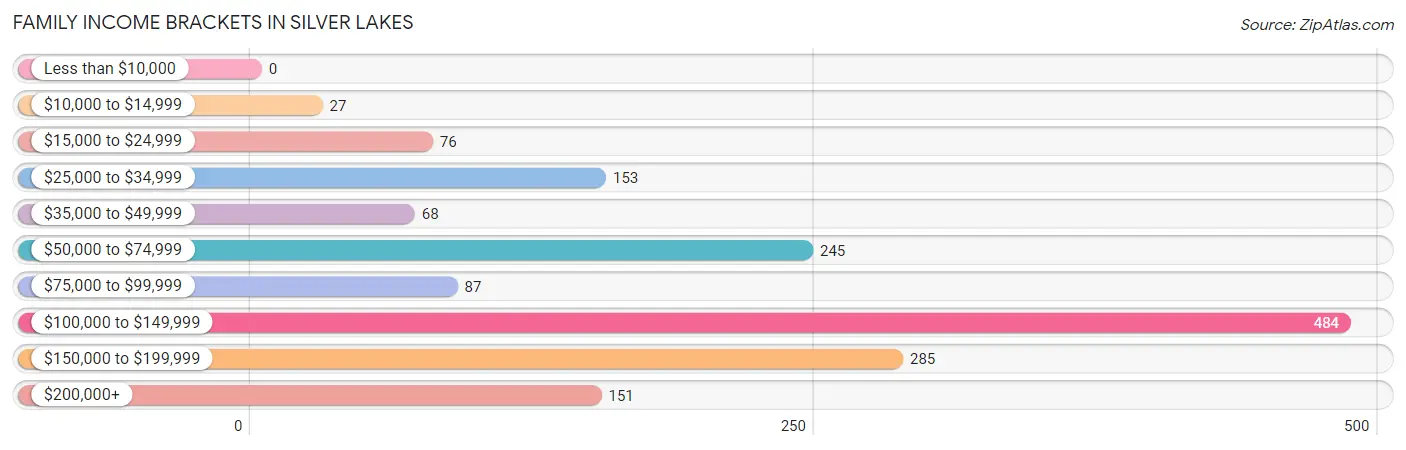
| Income Bracket | # Families | % Families |
| Less than $10,000 | 0 | 0.0% |
| $10,000 to $14,999 | 27 | 1.7% |
| $15,000 to $24,999 | 76 | 4.8% |
| $25,000 to $34,999 | 153 | 9.7% |
| $35,000 to $49,999 | 68 | 4.3% |
| $50,000 to $74,999 | 245 | 15.6% |
| $75,000 to $99,999 | 87 | 5.5% |
| $100,000 to $149,999 | 484 | 30.8% |
| $150,000 to $199,999 | 285 | 18.1% |
| $200,000+ | 151 | 9.6% |
Family Income by Famaliy Size in Silver Lakes
4-person families (251 | 16.0%) account for the highest median family income in Silver Lakes with $117,371 per family, while 2-person families (879 | 55.9%) have the highest median income of $37,458 per family member.
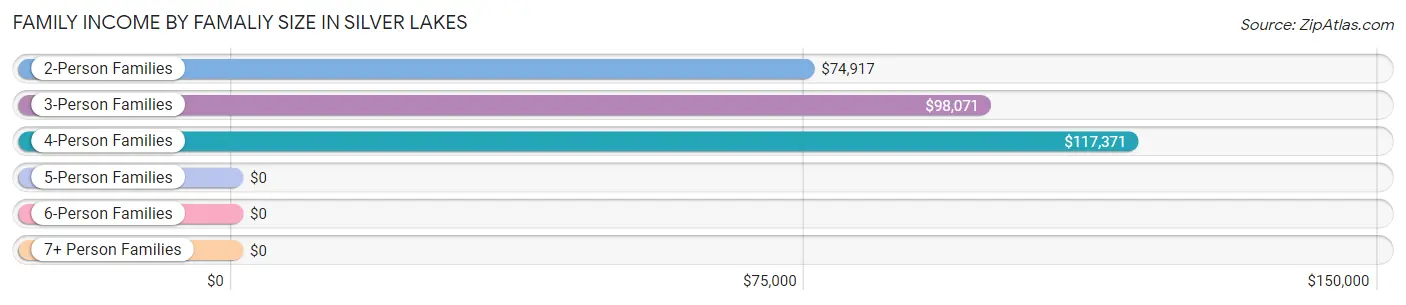
| Income Bracket | # Families | Median Income |
| 2-Person Families | 879 (55.9%) | $74,917 |
| 3-Person Families | 290 (18.4%) | $98,071 |
| 4-Person Families | 251 (16.0%) | $117,371 |
| 5-Person Families | 36 (2.3%) | $0 |
| 6-Person Families | 72 (4.6%) | $0 |
| 7+ Person Families | 45 (2.9%) | $0 |
| Total | 1,573 (100.0%) | $108,469 |
Family Income by Number of Earners in Silver Lakes
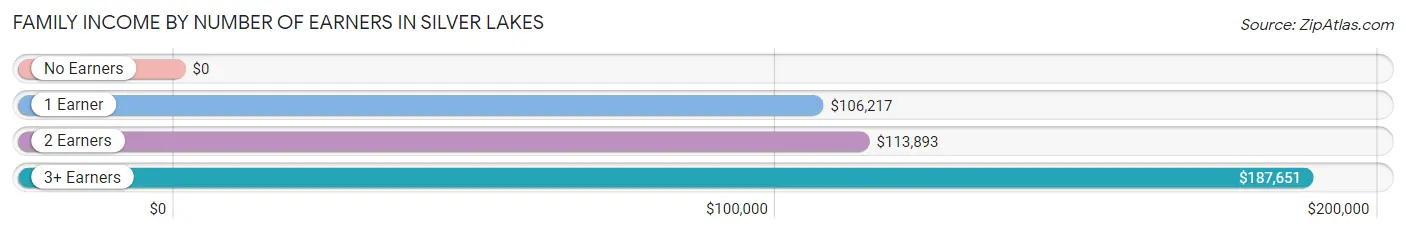
| Number of Earners | # Families | Median Income |
| No Earners | 361 (23.0%) | $0 |
| 1 Earner | 521 (33.1%) | $106,217 |
| 2 Earners | 448 (28.5%) | $113,893 |
| 3+ Earners | 243 (15.4%) | $187,651 |
| Total | 1,573 (100.0%) | $108,469 |
Household Income in Silver Lakes
Household Income Brackets in Silver Lakes
With 636 households falling in the category, the $100,000 to $149,999 income range is the most frequent in Silver Lakes, accounting for 29.6% of all households. In contrast, only 28 households (1.3%) fall into the $10,000 to $14,999 income bracket, making it the least populous group.
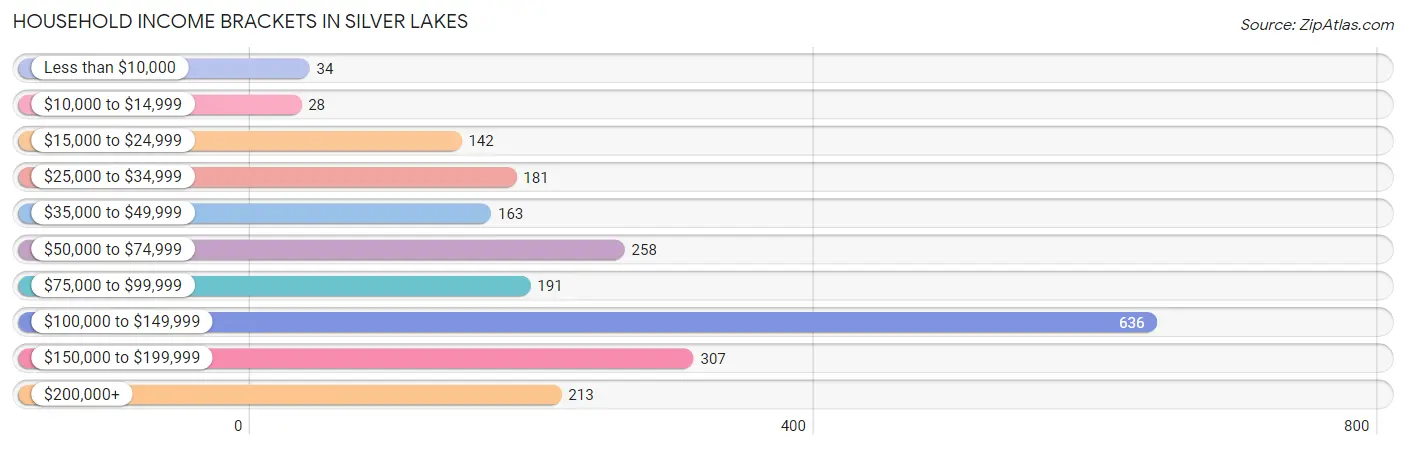
| Income Bracket | # Households | % Households |
| Less than $10,000 | 34 | 1.6% |
| $10,000 to $14,999 | 28 | 1.3% |
| $15,000 to $24,999 | 142 | 6.6% |
| $25,000 to $34,999 | 181 | 8.4% |
| $35,000 to $49,999 | 163 | 7.6% |
| $50,000 to $74,999 | 258 | 12.0% |
| $75,000 to $99,999 | 191 | 8.9% |
| $100,000 to $149,999 | 636 | 29.6% |
| $150,000 to $199,999 | 307 | 14.3% |
| $200,000+ | 213 | 9.9% |
Household Income by Householder Age in Silver Lakes
The median household income in Silver Lakes is $105,993, with the highest median household income of $117,198 found in the 45 to 64 years age bracket for the primary householder. A total of 709 households (33.0%) fall into this category.
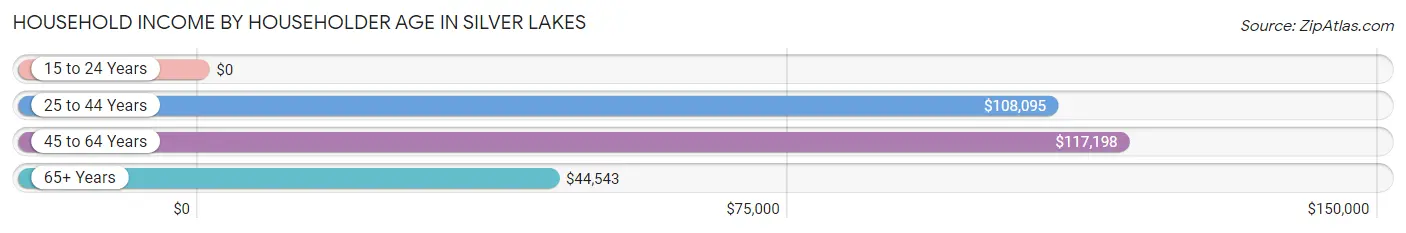
| Income Bracket | # Households | Median Income |
| 15 to 24 Years | 0 (0.0%) | $0 |
| 25 to 44 Years | 817 (38.0%) | $108,095 |
| 45 to 64 Years | 709 (33.0%) | $117,198 |
| 65+ Years | 624 (29.0%) | $44,543 |
| Total | 2,150 (100.0%) | $105,993 |
Poverty in Silver Lakes
Income Below Poverty by Sex and Age in Silver Lakes
With 1.0% poverty level for males and 3.5% for females among the residents of Silver Lakes, 65 to 74 year old males and 65 to 74 year old females are the most vulnerable to poverty, with 28 males (10.5%) and 27 females (12.6%) in their respective age groups living below the poverty level.
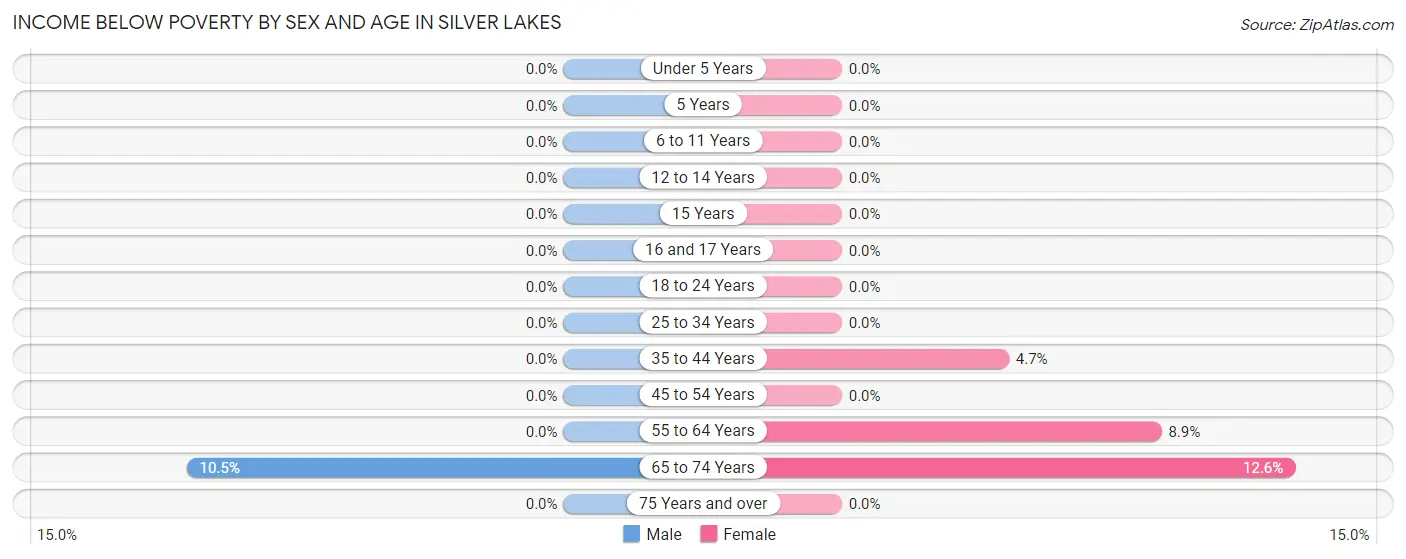
| Age Bracket | Male | Female |
| Under 5 Years | 0 (0.0%) | 0 (0.0%) |
| 5 Years | 0 (0.0%) | 0 (0.0%) |
| 6 to 11 Years | 0 (0.0%) | 0 (0.0%) |
| 12 to 14 Years | 0 (0.0%) | 0 (0.0%) |
| 15 Years | 0 (0.0%) | 0 (0.0%) |
| 16 and 17 Years | 0 (0.0%) | 0 (0.0%) |
| 18 to 24 Years | 0 (0.0%) | 0 (0.0%) |
| 25 to 34 Years | 0 (0.0%) | 0 (0.0%) |
| 35 to 44 Years | 0 (0.0%) | 34 (4.6%) |
| 45 to 54 Years | 0 (0.0%) | 0 (0.0%) |
| 55 to 64 Years | 0 (0.0%) | 34 (8.9%) |
| 65 to 74 Years | 28 (10.5%) | 27 (12.6%) |
| 75 Years and over | 0 (0.0%) | 0 (0.0%) |
| Total | 28 (1.0%) | 95 (3.5%) |
Income Above Poverty by Sex and Age in Silver Lakes
According to the poverty statistics in Silver Lakes, males aged under 5 years and females aged under 5 years are the age groups that are most secure financially, with 100.0% of males and 100.0% of females in these age groups living above the poverty line.
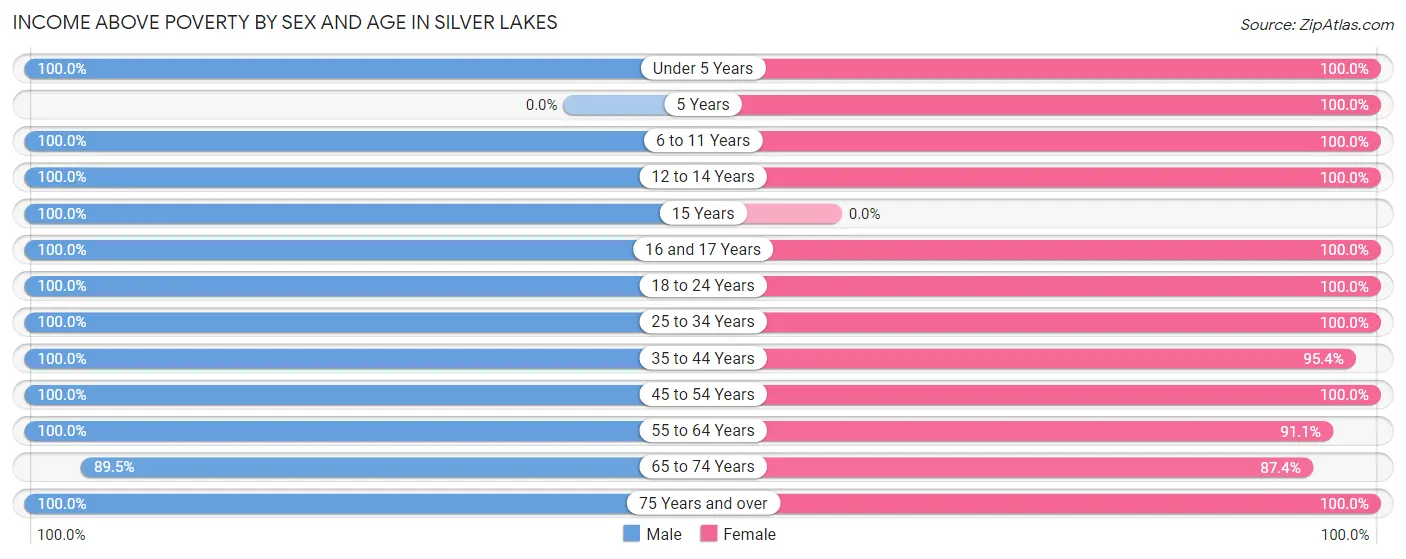
| Age Bracket | Male | Female |
| Under 5 Years | 37 (100.0%) | 191 (100.0%) |
| 5 Years | 0 (0.0%) | 145 (100.0%) |
| 6 to 11 Years | 357 (100.0%) | 145 (100.0%) |
| 12 to 14 Years | 138 (100.0%) | 36 (100.0%) |
| 15 Years | 65 (100.0%) | 0 (0.0%) |
| 16 and 17 Years | 64 (100.0%) | 103 (100.0%) |
| 18 to 24 Years | 233 (100.0%) | 60 (100.0%) |
| 25 to 34 Years | 447 (100.0%) | 92 (100.0%) |
| 35 to 44 Years | 395 (100.0%) | 697 (95.4%) |
| 45 to 54 Years | 284 (100.0%) | 274 (100.0%) |
| 55 to 64 Years | 327 (100.0%) | 348 (91.1%) |
| 65 to 74 Years | 239 (89.5%) | 187 (87.4%) |
| 75 Years and over | 210 (100.0%) | 335 (100.0%) |
| Total | 2,796 (99.0%) | 2,613 (96.5%) |
Income Below Poverty Among Married-Couple Families in Silver Lakes
The poverty statistics for married-couple families in Silver Lakes show that 2.1% or 27 of the total 1,270 families live below the poverty line. Families with no children have the highest poverty rate of 3.5%, comprising of 27 families. On the other hand, families with 1 or 2 children have the lowest poverty rate of 0.0%, which includes 0 families.
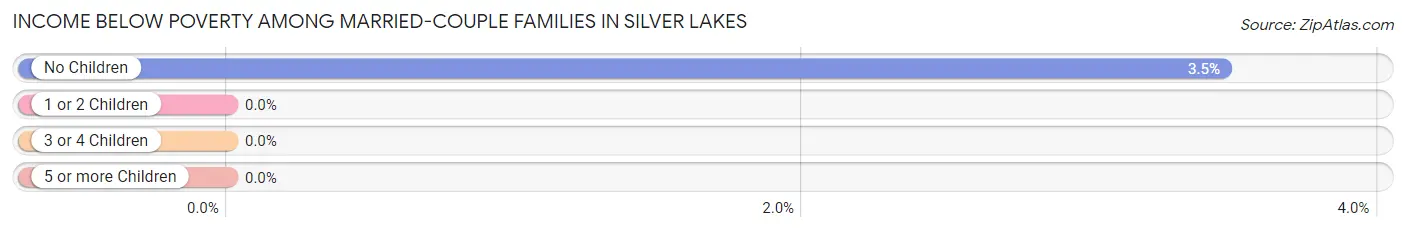
| Children | Above Poverty | Below Poverty |
| No Children | 753 (96.5%) | 27 (3.5%) |
| 1 or 2 Children | 373 (100.0%) | 0 (0.0%) |
| 3 or 4 Children | 117 (100.0%) | 0 (0.0%) |
| 5 or more Children | 0 (0.0%) | 0 (0.0%) |
| Total | 1,243 (97.9%) | 27 (2.1%) |
Income Below Poverty Among Single-Parent Households in Silver Lakes
| Children | Single Father | Single Mother |
| No Children | 0 (0.0%) | 0 (0.0%) |
| 1 or 2 Children | 0 (0.0%) | 0 (0.0%) |
| 3 or 4 Children | 0 (0.0%) | 0 (0.0%) |
| 5 or more Children | 0 (0.0%) | 0 (0.0%) |
| Total | 0 (0.0%) | 0 (0.0%) |
Income Below Poverty Among Married-Couple vs Single-Parent Households in Silver Lakes
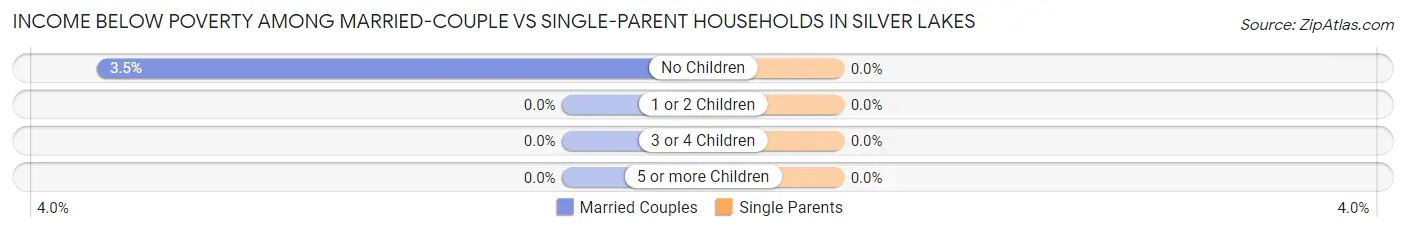
| Children | Married-Couple Families | Single-Parent Households |
| No Children | 27 (3.5%) | 0 (0.0%) |
| 1 or 2 Children | 0 (0.0%) | 0 (0.0%) |
| 3 or 4 Children | 0 (0.0%) | 0 (0.0%) |
| 5 or more Children | 0 (0.0%) | 0 (0.0%) |
| Total | 27 (2.1%) | 0 (0.0%) |
Race in Silver Lakes
The most populous races in Silver Lakes are White / Caucasian (3,078 | 55.6%), Hispanic or Latino (1,273 | 23.0%), and Two or more Races (1,080 | 19.5%).
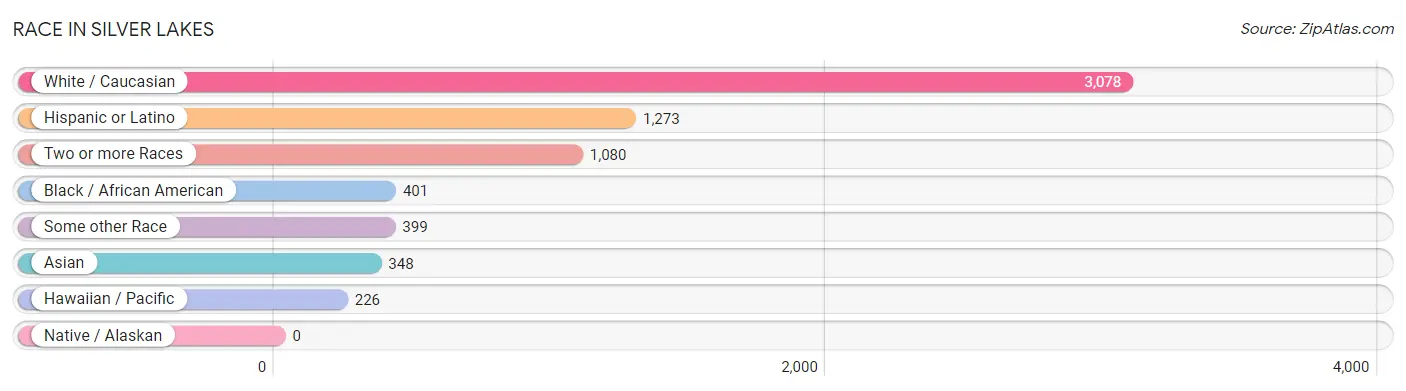
| Race | # Population | % Population |
| Asian | 348 | 6.3% |
| Black / African American | 401 | 7.2% |
| Hawaiian / Pacific | 226 | 4.1% |
| Hispanic or Latino | 1,273 | 23.0% |
| Native / Alaskan | 0 | 0.0% |
| White / Caucasian | 3,078 | 55.6% |
| Two or more Races | 1,080 | 19.5% |
| Some other Race | 399 | 7.2% |
| Total | 5,532 | 100.0% |
Ancestry in Silver Lakes
The most populous ancestries reported in Silver Lakes are Mexican (1,144 | 20.7%), German (685 | 12.4%), Irish (365 | 6.6%), Korean (363 | 6.6%), and Indian (Asian) (297 | 5.4%), together accounting for 51.6% of all Silver Lakes residents.
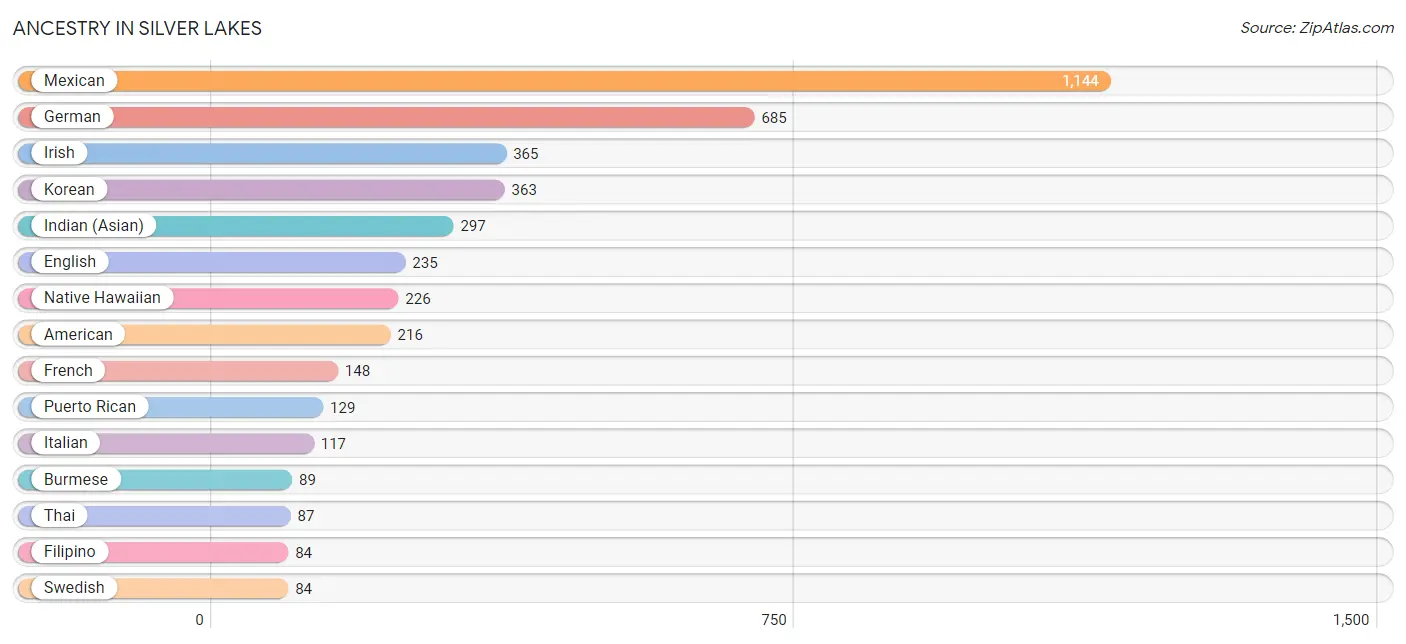
| Ancestry | # Population | % Population |
| American | 216 | 3.9% |
| Burmese | 89 | 1.6% |
| Danish | 56 | 1.0% |
| Dutch | 61 | 1.1% |
| English | 235 | 4.3% |
| European | 62 | 1.1% |
| Filipino | 84 | 1.5% |
| Finnish | 32 | 0.6% |
| French | 148 | 2.7% |
| French Canadian | 27 | 0.5% |
| German | 685 | 12.4% |
| Indian (Asian) | 297 | 5.4% |
| Irish | 365 | 6.6% |
| Italian | 117 | 2.1% |
| Korean | 363 | 6.6% |
| Mexican | 1,144 | 20.7% |
| Native Hawaiian | 226 | 4.1% |
| Northern European | 28 | 0.5% |
| Norwegian | 27 | 0.5% |
| Portuguese | 58 | 1.1% |
| Potawatomi | 55 | 1.0% |
| Puerto Rican | 129 | 2.3% |
| Russian | 28 | 0.5% |
| Scandinavian | 27 | 0.5% |
| Scotch-Irish | 27 | 0.5% |
| Scottish | 23 | 0.4% |
| Swedish | 84 | 1.5% |
| Swiss | 59 | 1.1% |
| Thai | 87 | 1.6% |
| Welsh | 30 | 0.5% |
| Yaqui | 39 | 0.7% | View All 31 Rows |
Immigrants in Silver Lakes
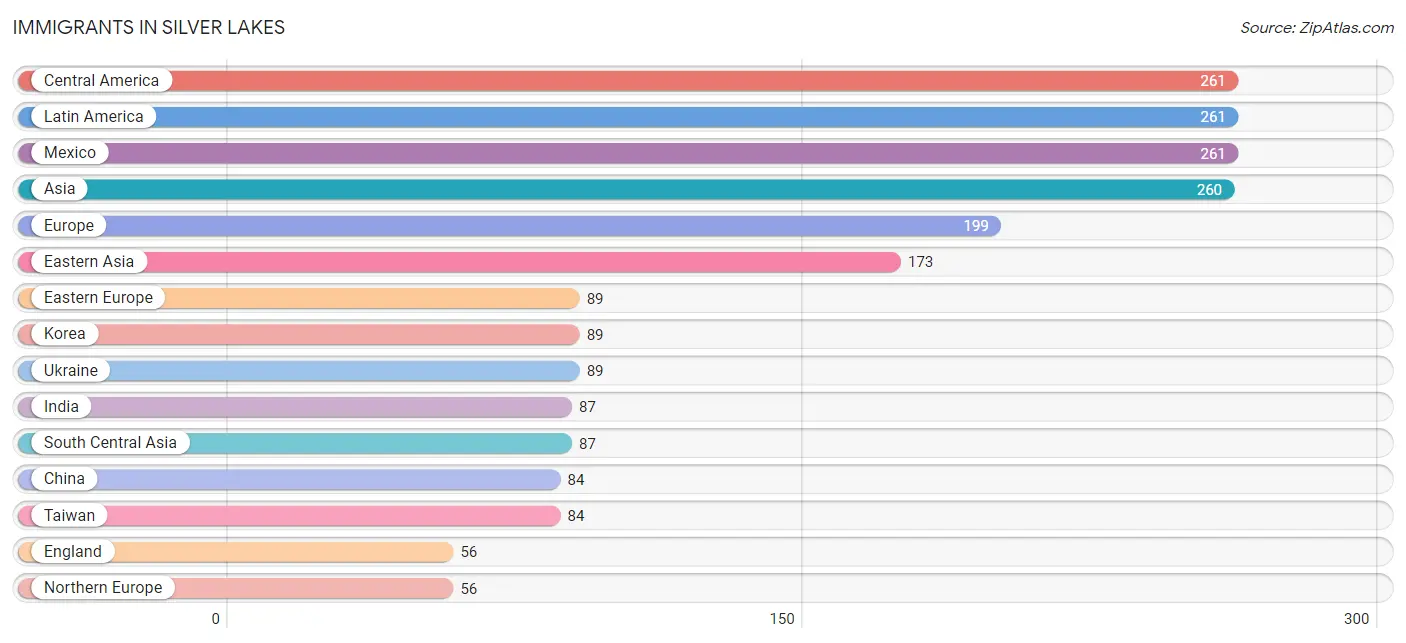
The most numerous immigrant groups reported in Silver Lakes came from Central America (261 | 4.7%), Latin America (261 | 4.7%), Mexico (261 | 4.7%), Asia (260 | 4.7%), and Europe (199 | 3.6%), together accounting for 22.5% of all Silver Lakes residents.
| Immigration Origin | # Population | % Population |
| Asia | 260 | 4.7% |
| Azores | 28 | 0.5% |
| Central America | 261 | 4.7% |
| China | 84 | 1.5% |
| Eastern Asia | 173 | 3.1% |
| Eastern Europe | 89 | 1.6% |
| England | 56 | 1.0% |
| Europe | 199 | 3.6% |
| Germany | 26 | 0.5% |
| India | 87 | 1.6% |
| Korea | 89 | 1.6% |
| Latin America | 261 | 4.7% |
| Mexico | 261 | 4.7% |
| Northern Europe | 56 | 1.0% |
| Portugal | 28 | 0.5% |
| South Central Asia | 87 | 1.6% |
| Southern Europe | 28 | 0.5% |
| Taiwan | 84 | 1.5% |
| Ukraine | 89 | 1.6% |
| Western Europe | 26 | 0.5% | View All 20 Rows |
Sex and Age in Silver Lakes
Sex and Age in Silver Lakes
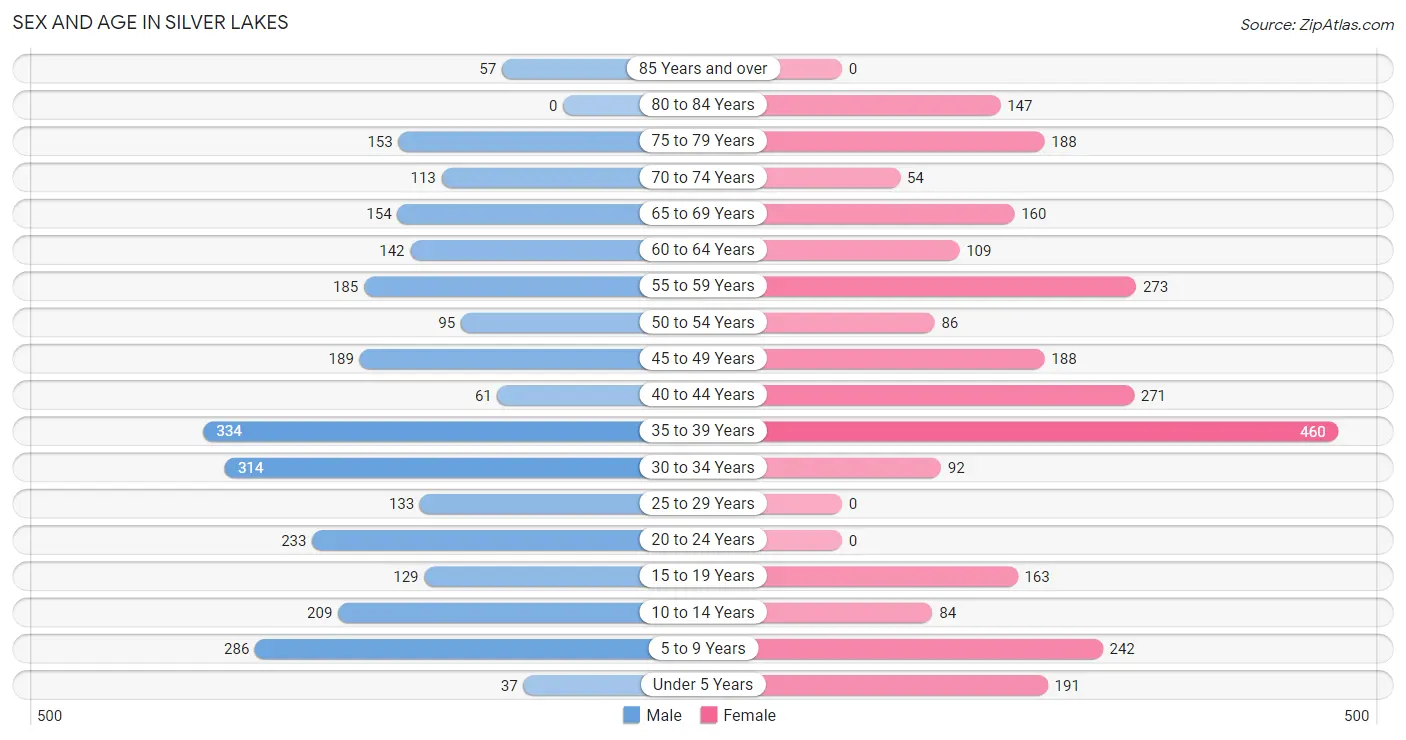
The most populous age groups in Silver Lakes are 35 to 39 Years (334 | 11.8%) for men and 35 to 39 Years (460 | 17.0%) for women.
| Age Bracket | Male | Female |
| Under 5 Years | 37 (1.3%) | 191 (7.0%) |
| 5 to 9 Years | 286 (10.1%) | 242 (8.9%) |
| 10 to 14 Years | 209 (7.4%) | 84 (3.1%) |
| 15 to 19 Years | 129 (4.6%) | 163 (6.0%) |
| 20 to 24 Years | 233 (8.3%) | 0 (0.0%) |
| 25 to 29 Years | 133 (4.7%) | 0 (0.0%) |
| 30 to 34 Years | 314 (11.1%) | 92 (3.4%) |
| 35 to 39 Years | 334 (11.8%) | 460 (17.0%) |
| 40 to 44 Years | 61 (2.2%) | 271 (10.0%) |
| 45 to 49 Years | 189 (6.7%) | 188 (6.9%) |
| 50 to 54 Years | 95 (3.4%) | 86 (3.2%) |
| 55 to 59 Years | 185 (6.6%) | 273 (10.1%) |
| 60 to 64 Years | 142 (5.0%) | 109 (4.0%) |
| 65 to 69 Years | 154 (5.4%) | 160 (5.9%) |
| 70 to 74 Years | 113 (4.0%) | 54 (2.0%) |
| 75 to 79 Years | 153 (5.4%) | 188 (6.9%) |
| 80 to 84 Years | 0 (0.0%) | 147 (5.4%) |
| 85 Years and over | 57 (2.0%) | 0 (0.0%) |
| Total | 2,824 (100.0%) | 2,708 (100.0%) |
Families and Households in Silver Lakes
Median Family Size in Silver Lakes
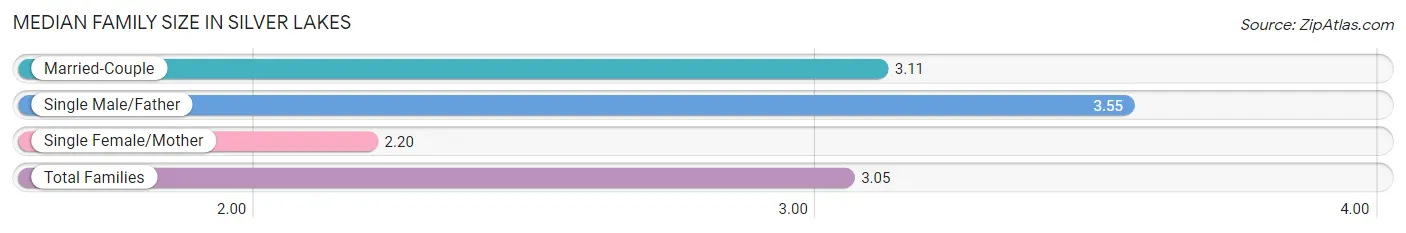
The median family size in Silver Lakes is 3.05 persons per family, with single male/father families (135 | 8.6%) accounting for the largest median family size of 3.55 persons per family. On the other hand, single female/mother families (168 | 10.7%) represent the smallest median family size with 2.20 persons per family.
| Family Type | # Families | Family Size |
| Married-Couple | 1,270 (80.7%) | 3.11 |
| Single Male/Father | 135 (8.6%) | 3.55 |
| Single Female/Mother | 168 (10.7%) | 2.20 |
| Total Families | 1,573 (100.0%) | 3.05 |
Median Household Size in Silver Lakes
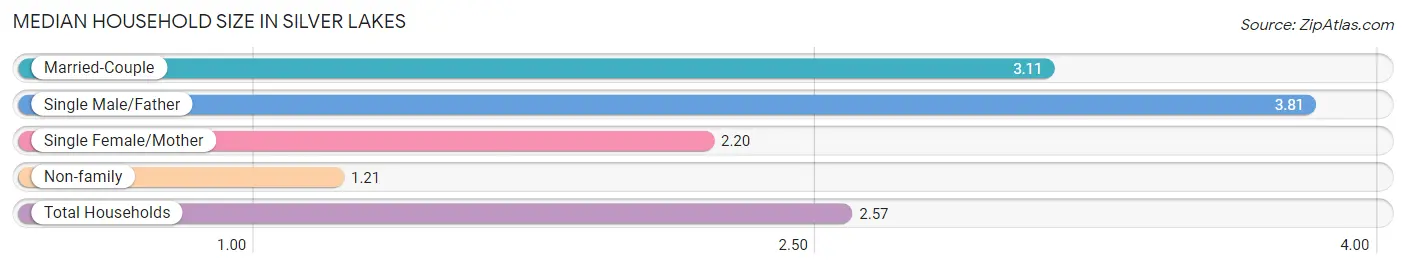
The median household size in Silver Lakes is 2.57 persons per household, with single male/father households (135 | 6.3%) accounting for the largest median household size of 3.81 persons per household. non-family households (577 | 26.8%) represent the smallest median household size with 1.21 persons per household.
| Household Type | # Households | Household Size |
| Married-Couple | 1,270 (59.1%) | 3.11 |
| Single Male/Father | 135 (6.3%) | 3.81 |
| Single Female/Mother | 168 (7.8%) | 2.20 |
| Non-family | 577 (26.8%) | 1.21 |
| Total Households | 2,150 (100.0%) | 2.57 |
Household Size by Marriage Status in Silver Lakes
Out of a total of 2,150 households in Silver Lakes, 1,573 (73.2%) are family households, while 577 (26.8%) are nonfamily households. The most numerous type of family households are 2-person households, comprising 879, and the most common type of nonfamily households are 1-person households, comprising 456.
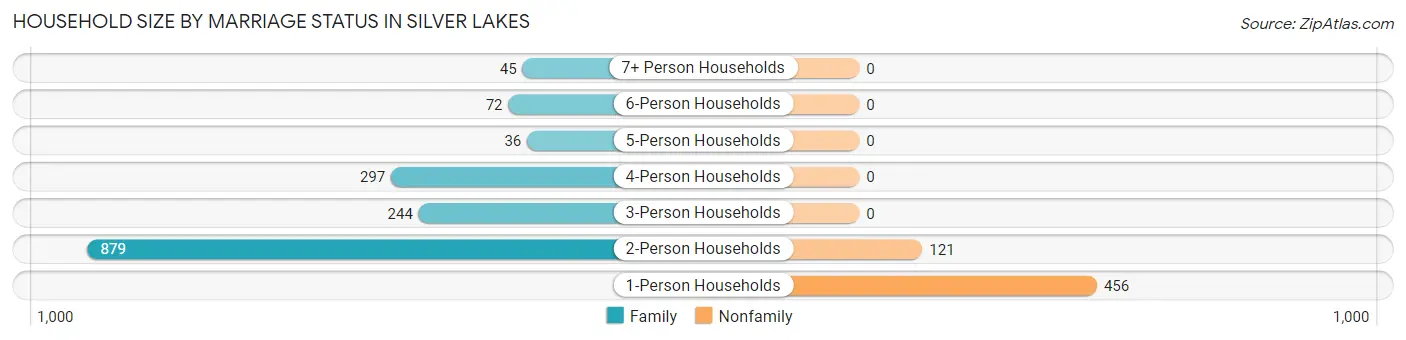
| Household Size | Family Households | Nonfamily Households |
| 1-Person Households | - | 456 (21.2%) |
| 2-Person Households | 879 (40.9%) | 121 (5.6%) |
| 3-Person Households | 244 (11.4%) | 0 (0.0%) |
| 4-Person Households | 297 (13.8%) | 0 (0.0%) |
| 5-Person Households | 36 (1.7%) | 0 (0.0%) |
| 6-Person Households | 72 (3.4%) | 0 (0.0%) |
| 7+ Person Households | 45 (2.1%) | 0 (0.0%) |
| Total | 1,573 (73.2%) | 577 (26.8%) |
Female Fertility in Silver Lakes
Fertility by Age in Silver Lakes
| Age Bracket | Women with Births | Births / 1,000 Women |
| 15 to 19 years | 0 (0.0%) | 0.0 |
| 20 to 34 years | 0 (0.0%) | 0.0 |
| 35 to 50 years | 0 (0.0%) | 0.0 |
| Total | 0 (0.0%) | 0.0 |
Fertility by Age by Marriage Status in Silver Lakes
| Age Bracket | Married | Unmarried |
| 15 to 19 years | 0 (0.0%) | 0 (0.0%) |
| 20 to 34 years | 0 (0.0%) | 0 (0.0%) |
| 35 to 50 years | 0 (0.0%) | 0 (0.0%) |
| Total | 0 (0.0%) | 0 (0.0%) |
Fertility by Education in Silver Lakes
| Educational Attainment | Women with Births | Births / 1,000 Women |
| Less than High School | 0 (0.0%) | 0.0 |
| High School Diploma | 0 (0.0%) | 0.0 |
| College or Associate's Degree | 0 (0.0%) | 0.0 |
| Bachelor's Degree | 0 (0.0%) | 0.0 |
| Graduate Degree | 0 (0.0%) | 0.0 |
| Total | 0 (0.0%) | 0.0 |
Fertility by Education by Marriage Status in Silver Lakes
| Educational Attainment | Married | Unmarried |
| Less than High School | 0 (0.0%) | 0 (0.0%) |
| High School Diploma | 0 (0.0%) | 0 (0.0%) |
| College or Associate's Degree | 0 (0.0%) | 0 (0.0%) |
| Bachelor's Degree | 0 (0.0%) | 0 (0.0%) |
| Graduate Degree | 0 (0.0%) | 0 (0.0%) |
| Total | 0 (0.0%) | 0 (0.0%) |
Employment Characteristics in Silver Lakes
Employment by Class of Employer in Silver Lakes
Among the 2,398 employed individuals in Silver Lakes, private company employees (1,293 | 53.9%), federal government employees (397 | 16.6%), and state government employees (264 | 11.0%) make up the most common classes of employment.
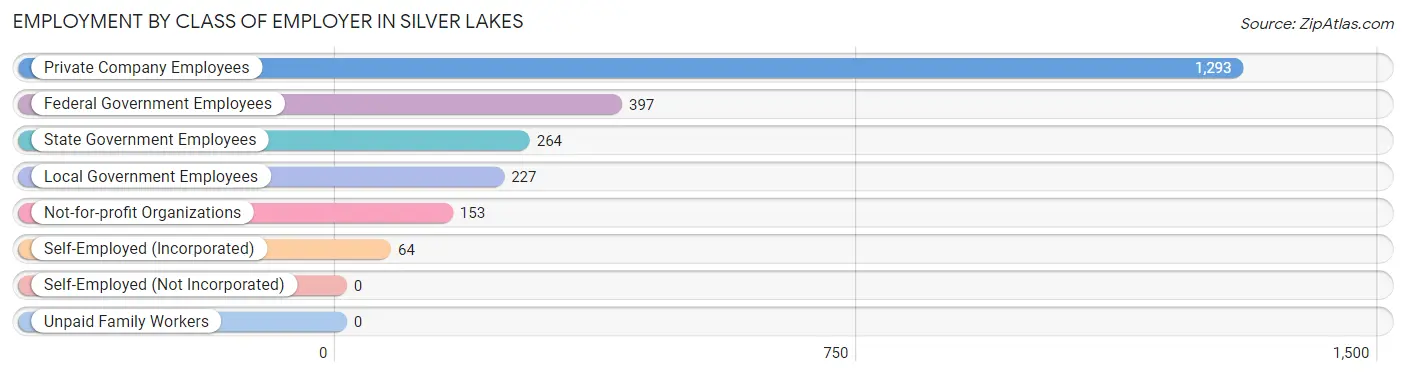
| Employer Class | # Employees | % Employees |
| Private Company Employees | 1,293 | 53.9% |
| Self-Employed (Incorporated) | 64 | 2.7% |
| Self-Employed (Not Incorporated) | 0 | 0.0% |
| Not-for-profit Organizations | 153 | 6.4% |
| Local Government Employees | 227 | 9.5% |
| State Government Employees | 264 | 11.0% |
| Federal Government Employees | 397 | 16.6% |
| Unpaid Family Workers | 0 | 0.0% |
| Total | 2,398 | 100.0% |
Employment Status by Age in Silver Lakes
According to the labor force statistics for Silver Lakes, out of the total population over 16 years of age (4,418), 59.4% or 2,624 individuals are in the labor force, with 2.8% or 73 of them unemployed. The age group with the highest labor force participation rate is 25 to 29 years, with 100.0% or 133 individuals in the labor force. Within the labor force, the 75 years and over age range has the highest percentage of unemployed individuals, with 53.0% or 35 of them being unemployed.
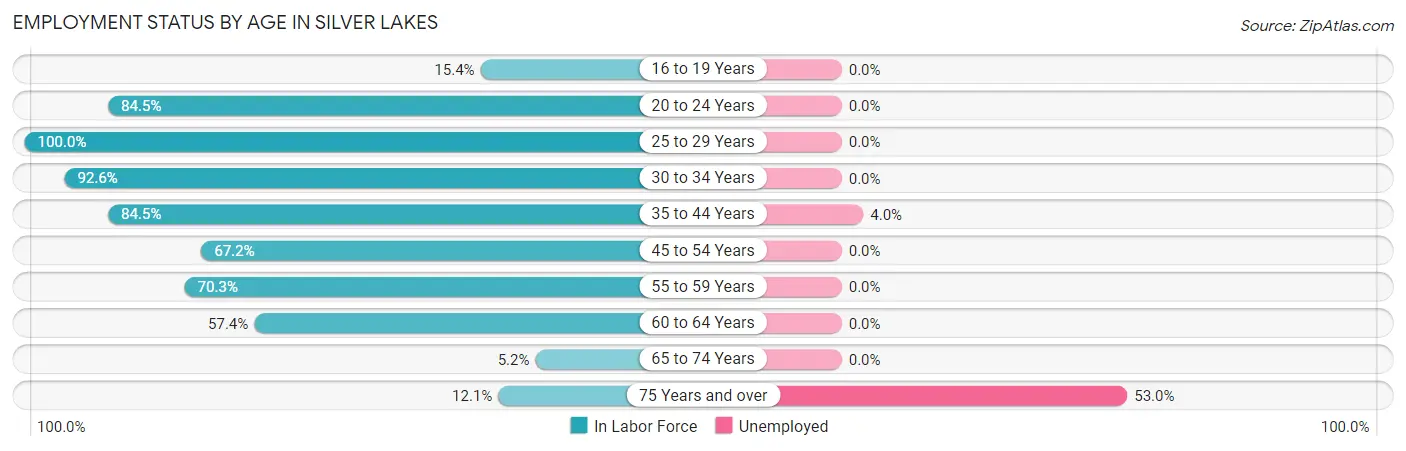
| Age Bracket | In Labor Force | Unemployed |
| 16 to 19 Years | 35 (15.4%) | 0 (0.0%) |
| 20 to 24 Years | 197 (84.5%) | 0 (0.0%) |
| 25 to 29 Years | 133 (100.0%) | 0 (0.0%) |
| 30 to 34 Years | 376 (92.6%) | 0 (0.0%) |
| 35 to 44 Years | 951 (84.5%) | 38 (4.0%) |
| 45 to 54 Years | 375 (67.2%) | 0 (0.0%) |
| 55 to 59 Years | 322 (70.3%) | 0 (0.0%) |
| 60 to 64 Years | 144 (57.4%) | 0 (0.0%) |
| 65 to 74 Years | 25 (5.2%) | 0 (0.0%) |
| 75 Years and over | 66 (12.1%) | 35 (53.0%) |
| Total | 2,624 (59.4%) | 73 (2.8%) |
Employment Status by Educational Attainment in Silver Lakes
According to labor force statistics for Silver Lakes, 78.5% of individuals (2,302) out of the total population between 25 and 64 years of age (2,932) are in the labor force, with 1.7% or 39 of them being unemployed. The group with the highest labor force participation rate are those with the educational attainment of bachelor's degree or higher, with 91.7% or 711 individuals in the labor force. Within the labor force, individuals with college / associate degree education have the highest percentage of unemployment, with 3.6% or 38 of them being unemployed.
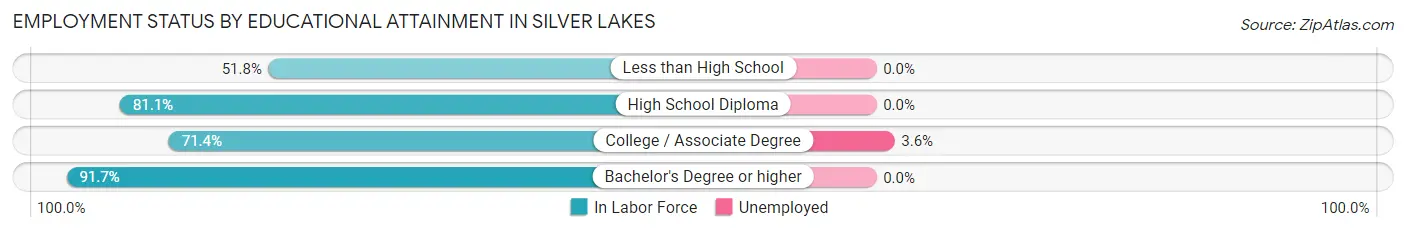
| Educational Attainment | In Labor Force | Unemployed |
| Less than High School | 29 (51.8%) | 0 (0.0%) |
| High School Diploma | 510 (81.1%) | 0 (0.0%) |
| College / Associate Degree | 1,051 (71.4%) | 53 (3.6%) |
| Bachelor's Degree or higher | 711 (91.7%) | 0 (0.0%) |
| Total | 2,302 (78.5%) | 50 (1.7%) |
Employment Occupations by Sex in Silver Lakes
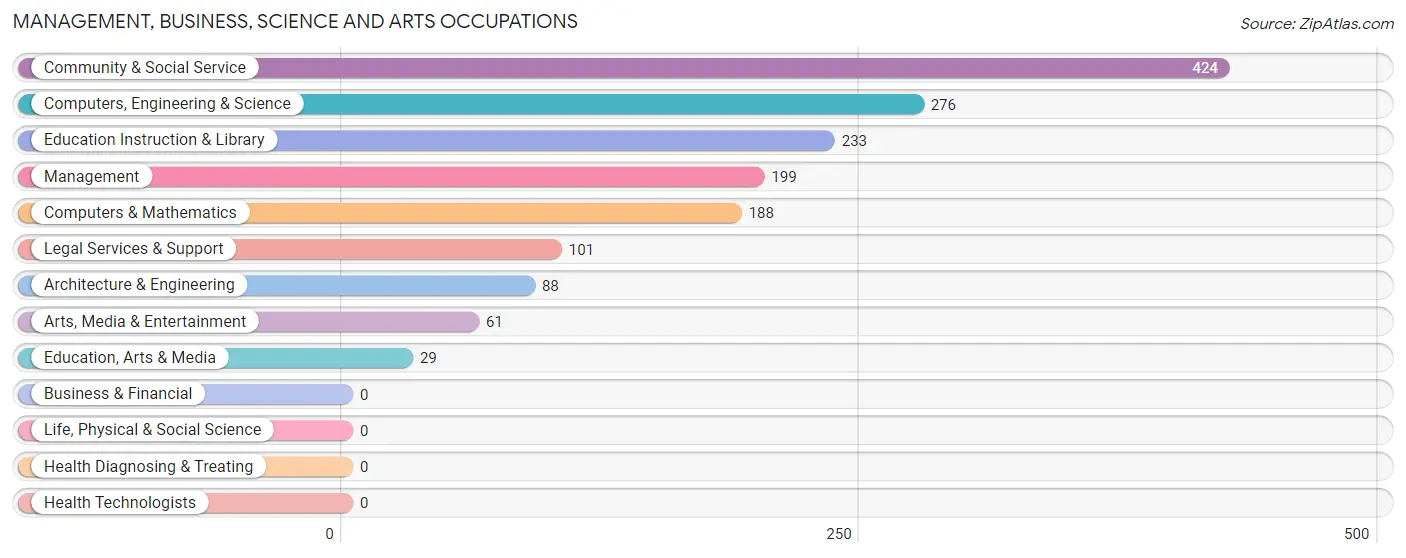
Management, Business, Science and Arts Occupations
The most common Management, Business, Science and Arts occupations in Silver Lakes are Community & Social Service (424 | 16.6%), Computers, Engineering & Science (276 | 10.8%), Education Instruction & Library (233 | 9.1%), Management (199 | 7.8%), and Computers & Mathematics (188 | 7.4%).
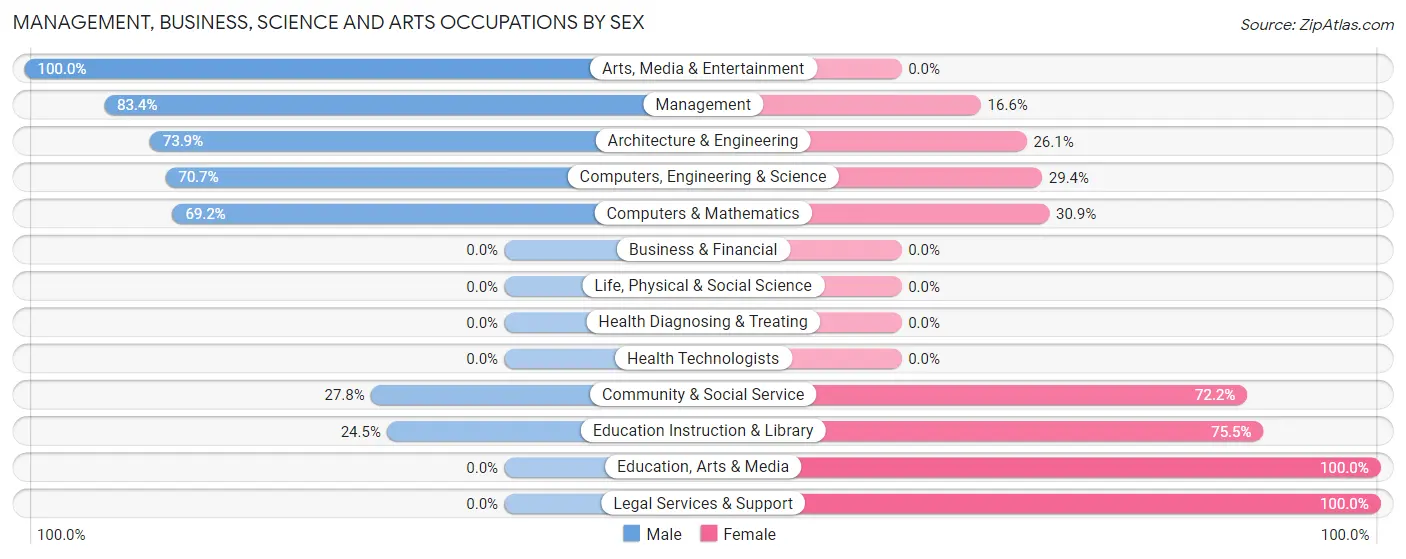
Management, Business, Science and Arts Occupations by Sex
Within the Management, Business, Science and Arts occupations in Silver Lakes, the most male-oriented occupations are Arts, Media & Entertainment (100.0%), Management (83.4%), and Architecture & Engineering (73.9%), while the most female-oriented occupations are Education, Arts & Media (100.0%), Legal Services & Support (100.0%), and Education Instruction & Library (75.5%).
| Occupation | Male | Female |
| Management | 166 (83.4%) | 33 (16.6%) |
| Business & Financial | 0 (0.0%) | 0 (0.0%) |
| Computers, Engineering & Science | 195 (70.7%) | 81 (29.3%) |
| Computers & Mathematics | 130 (69.2%) | 58 (30.8%) |
| Architecture & Engineering | 65 (73.9%) | 23 (26.1%) |
| Life, Physical & Social Science | 0 (0.0%) | 0 (0.0%) |
| Community & Social Service | 118 (27.8%) | 306 (72.2%) |
| Education, Arts & Media | 0 (0.0%) | 29 (100.0%) |
| Legal Services & Support | 0 (0.0%) | 101 (100.0%) |
| Education Instruction & Library | 57 (24.5%) | 176 (75.5%) |
| Arts, Media & Entertainment | 61 (100.0%) | 0 (0.0%) |
| Health Diagnosing & Treating | 0 (0.0%) | 0 (0.0%) |
| Health Technologists | 0 (0.0%) | 0 (0.0%) |
| Total (Category) | 479 (53.3%) | 420 (46.7%) |
| Total (Overall) | 1,485 (58.2%) | 1,066 (41.8%) |
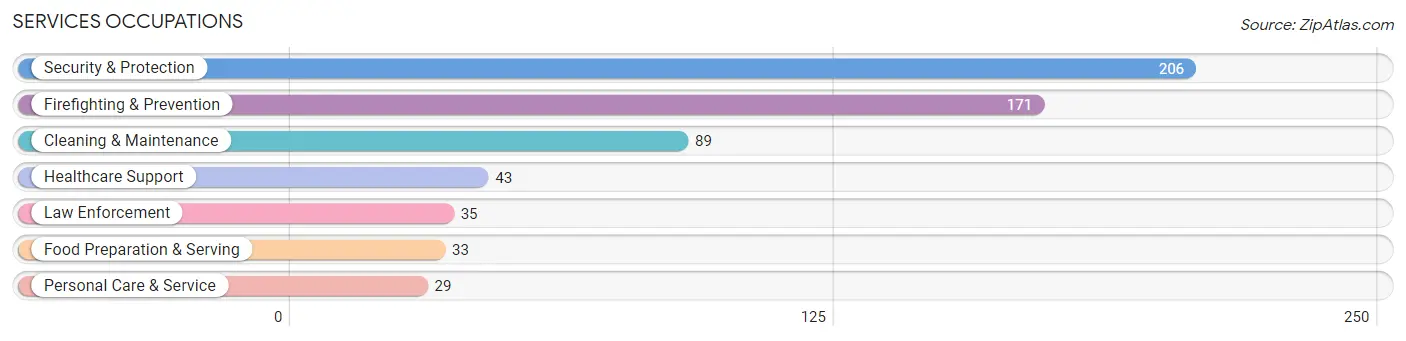
Services Occupations
The most common Services occupations in Silver Lakes are Security & Protection (206 | 8.1%), Firefighting & Prevention (171 | 6.7%), Cleaning & Maintenance (89 | 3.5%), Healthcare Support (43 | 1.7%), and Law Enforcement (35 | 1.4%).
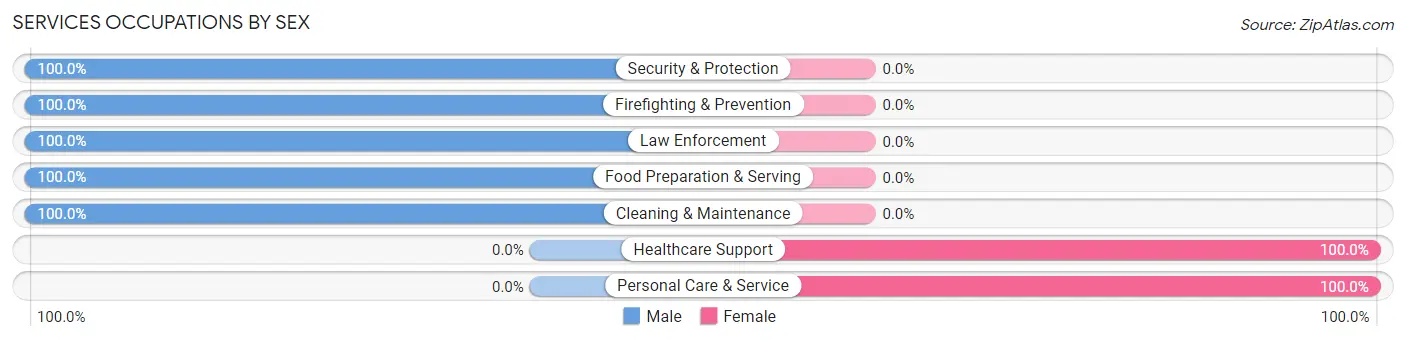
Services Occupations by Sex
Within the Services occupations in Silver Lakes, the most male-oriented occupations are Security & Protection (100.0%), Firefighting & Prevention (100.0%), and Law Enforcement (100.0%), while the most female-oriented occupations are Healthcare Support (100.0%), and Personal Care & Service (100.0%).
| Occupation | Male | Female |
| Healthcare Support | 0 (0.0%) | 43 (100.0%) |
| Security & Protection | 206 (100.0%) | 0 (0.0%) |
| Firefighting & Prevention | 171 (100.0%) | 0 (0.0%) |
| Law Enforcement | 35 (100.0%) | 0 (0.0%) |
| Food Preparation & Serving | 33 (100.0%) | 0 (0.0%) |
| Cleaning & Maintenance | 89 (100.0%) | 0 (0.0%) |
| Personal Care & Service | 0 (0.0%) | 29 (100.0%) |
| Total (Category) | 328 (82.0%) | 72 (18.0%) |
| Total (Overall) | 1,485 (58.2%) | 1,066 (41.8%) |
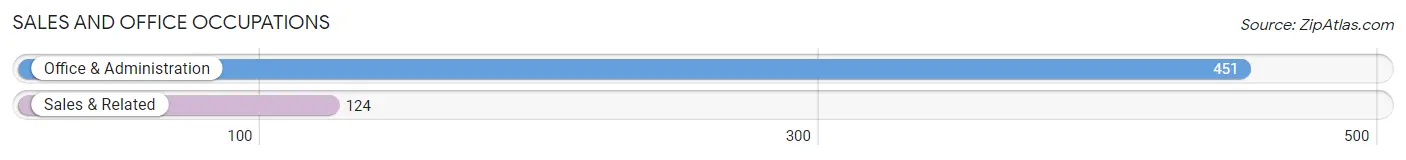
Sales and Office Occupations
The most common Sales and Office occupations in Silver Lakes are Office & Administration (451 | 17.7%), and Sales & Related (124 | 4.9%).
Sales and Office Occupations by Sex
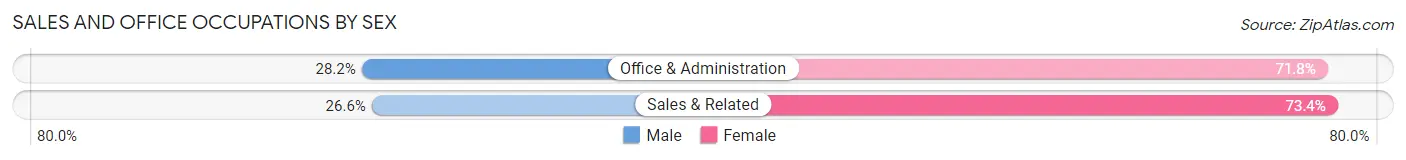
| Occupation | Male | Female |
| Sales & Related | 33 (26.6%) | 91 (73.4%) |
| Office & Administration | 127 (28.2%) | 324 (71.8%) |
| Total (Category) | 160 (27.8%) | 415 (72.2%) |
| Total (Overall) | 1,485 (58.2%) | 1,066 (41.8%) |
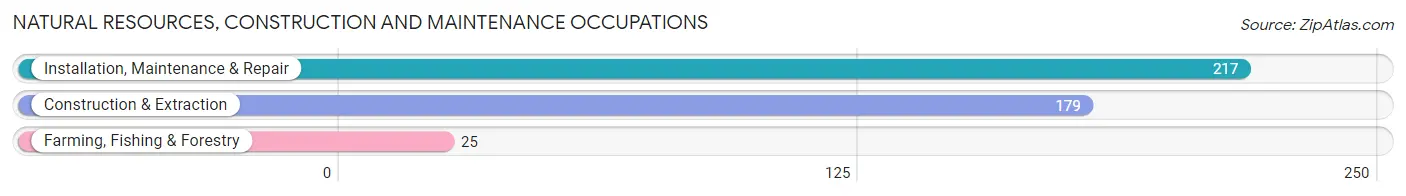
Natural Resources, Construction and Maintenance Occupations
The most common Natural Resources, Construction and Maintenance occupations in Silver Lakes are Installation, Maintenance & Repair (217 | 8.5%), Construction & Extraction (179 | 7.0%), and Farming, Fishing & Forestry (25 | 1.0%).
Natural Resources, Construction and Maintenance Occupations by Sex
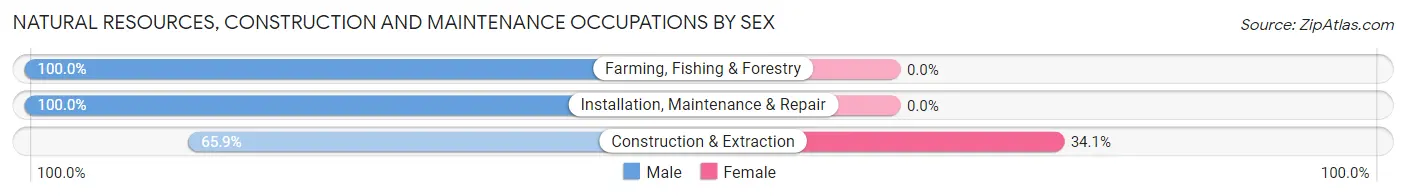
| Occupation | Male | Female |
| Farming, Fishing & Forestry | 25 (100.0%) | 0 (0.0%) |
| Construction & Extraction | 118 (65.9%) | 61 (34.1%) |
| Installation, Maintenance & Repair | 217 (100.0%) | 0 (0.0%) |
| Total (Category) | 360 (85.5%) | 61 (14.5%) |
| Total (Overall) | 1,485 (58.2%) | 1,066 (41.8%) |
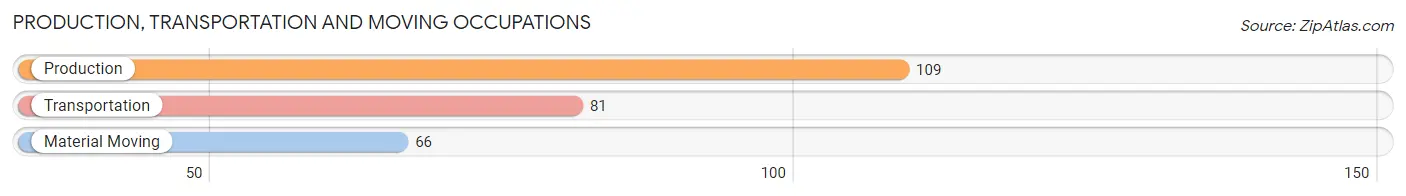
Production, Transportation and Moving Occupations
The most common Production, Transportation and Moving occupations in Silver Lakes are Production (109 | 4.3%), Transportation (81 | 3.2%), and Material Moving (66 | 2.6%).
Production, Transportation and Moving Occupations by Sex
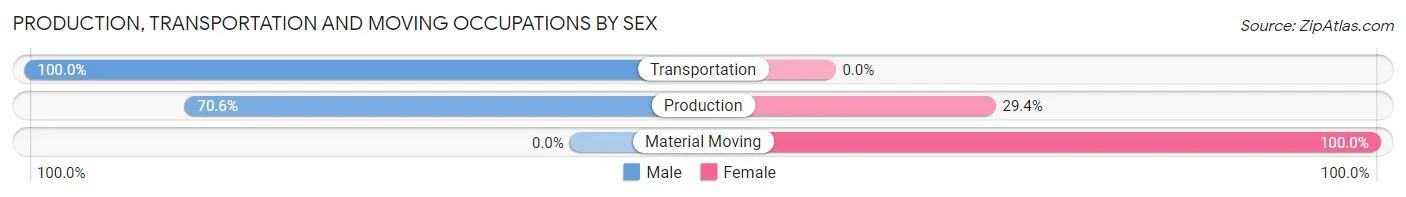
| Occupation | Male | Female |
| Production | 77 (70.6%) | 32 (29.4%) |
| Transportation | 81 (100.0%) | 0 (0.0%) |
| Material Moving | 0 (0.0%) | 66 (100.0%) |
| Total (Category) | 158 (61.7%) | 98 (38.3%) |
| Total (Overall) | 1,485 (58.2%) | 1,066 (41.8%) |
Employment Industries by Sex in Silver Lakes
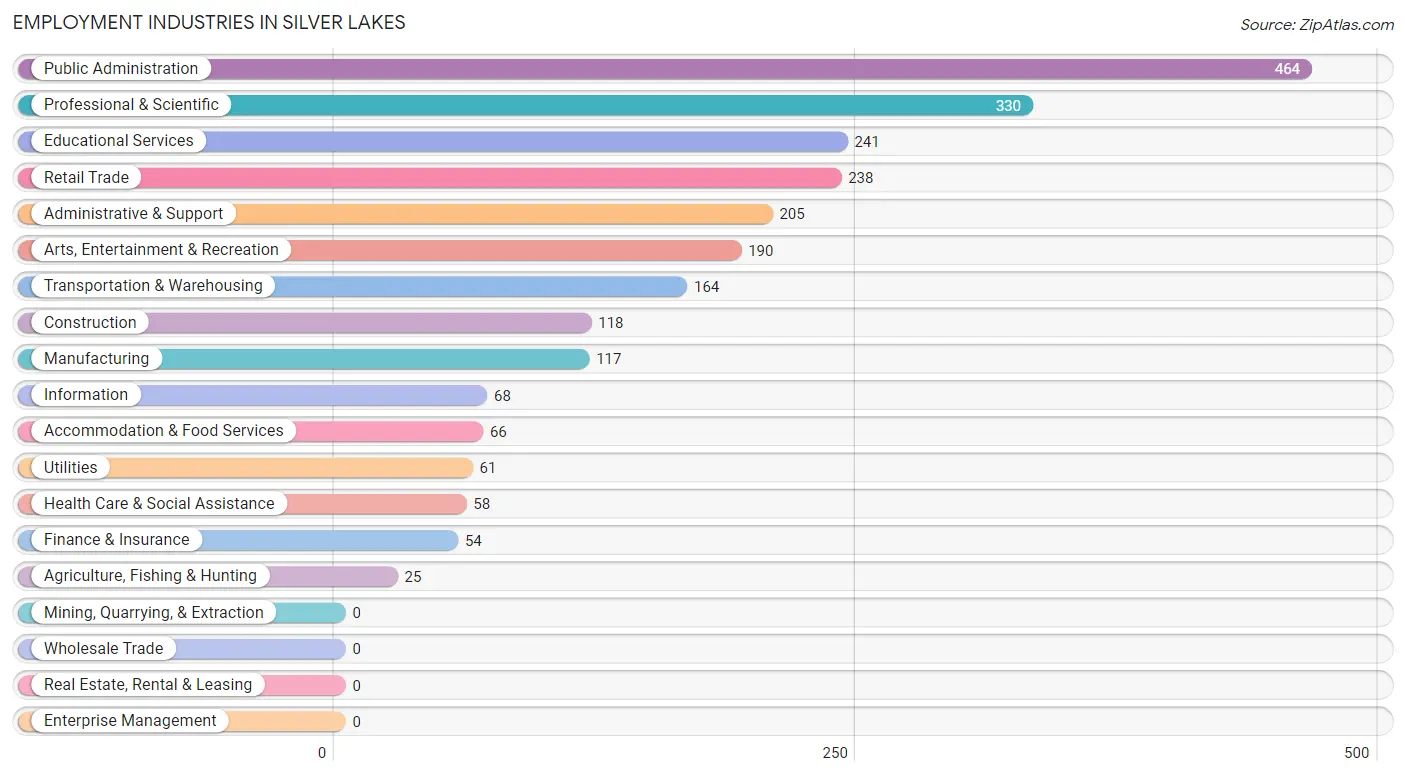
Employment Industries in Silver Lakes
The major employment industries in Silver Lakes include Public Administration (464 | 18.2%), Professional & Scientific (330 | 12.9%), Educational Services (241 | 9.5%), Retail Trade (238 | 9.3%), and Administrative & Support (205 | 8.0%).
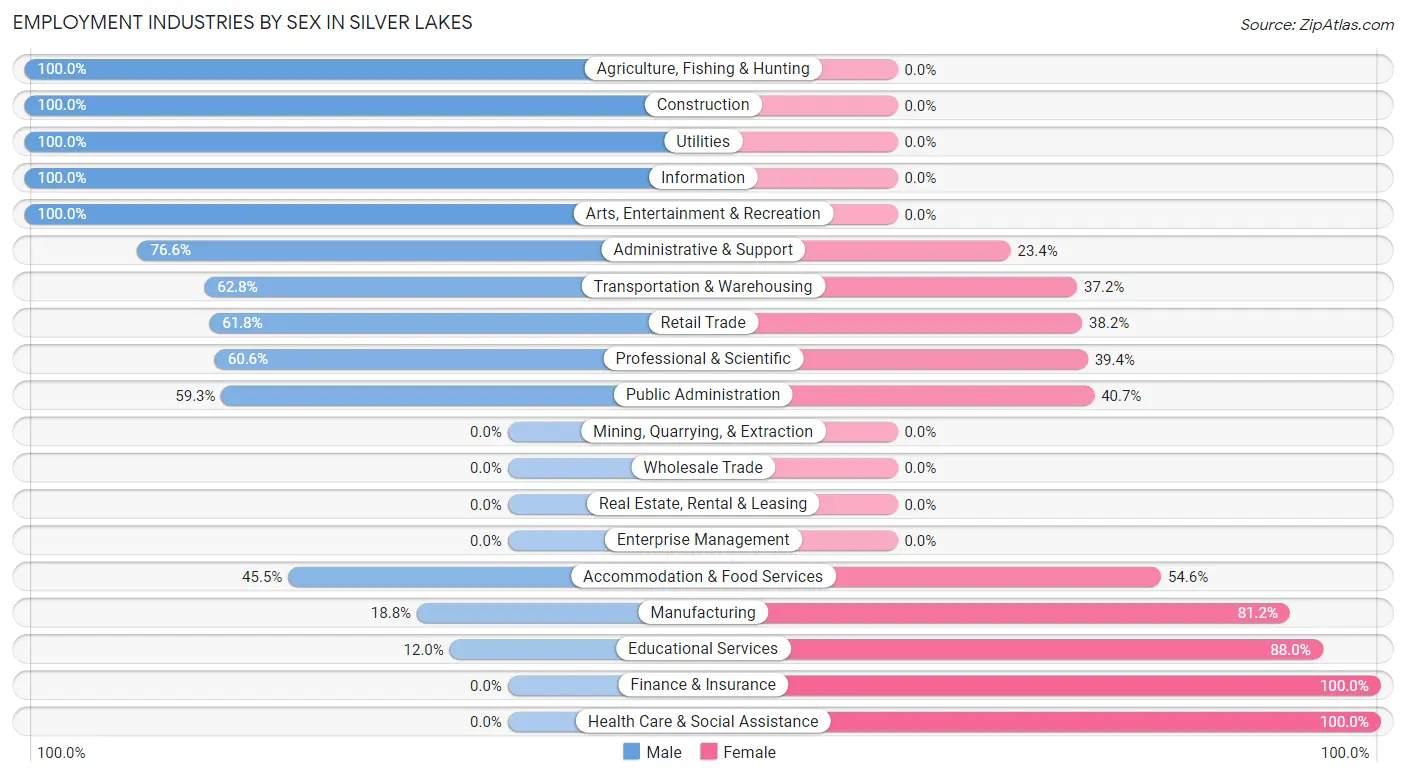
Employment Industries by Sex in Silver Lakes
The Silver Lakes industries that see more men than women are Agriculture, Fishing & Hunting (100.0%), Construction (100.0%), and Utilities (100.0%), whereas the industries that tend to have a higher number of women are Finance & Insurance (100.0%), Health Care & Social Assistance (100.0%), and Educational Services (88.0%).
| Industry | Male | Female |
| Agriculture, Fishing & Hunting | 25 (100.0%) | 0 (0.0%) |
| Mining, Quarrying, & Extraction | 0 (0.0%) | 0 (0.0%) |
| Construction | 118 (100.0%) | 0 (0.0%) |
| Manufacturing | 22 (18.8%) | 95 (81.2%) |
| Wholesale Trade | 0 (0.0%) | 0 (0.0%) |
| Retail Trade | 147 (61.8%) | 91 (38.2%) |
| Transportation & Warehousing | 103 (62.8%) | 61 (37.2%) |
| Utilities | 61 (100.0%) | 0 (0.0%) |
| Information | 68 (100.0%) | 0 (0.0%) |
| Finance & Insurance | 0 (0.0%) | 54 (100.0%) |
| Real Estate, Rental & Leasing | 0 (0.0%) | 0 (0.0%) |
| Professional & Scientific | 200 (60.6%) | 130 (39.4%) |
| Enterprise Management | 0 (0.0%) | 0 (0.0%) |
| Administrative & Support | 157 (76.6%) | 48 (23.4%) |
| Educational Services | 29 (12.0%) | 212 (88.0%) |
| Health Care & Social Assistance | 0 (0.0%) | 58 (100.0%) |
| Arts, Entertainment & Recreation | 190 (100.0%) | 0 (0.0%) |
| Accommodation & Food Services | 30 (45.5%) | 36 (54.5%) |
| Public Administration | 275 (59.3%) | 189 (40.7%) |
| Total | 1,485 (58.2%) | 1,066 (41.8%) |
Education in Silver Lakes
School Enrollment in Silver Lakes
The most common levels of schooling among the 1,341 students in Silver Lakes are elementary school (369 | 27.5%), high school (268 | 20.0%), and middle school (257 | 19.2%).
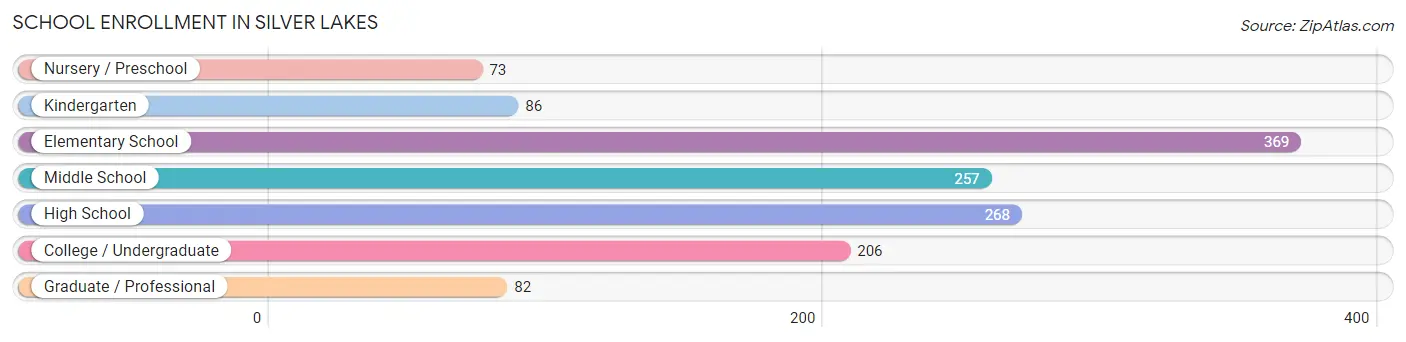
| School Level | # Students | % Students |
| Nursery / Preschool | 73 | 5.4% |
| Kindergarten | 86 | 6.4% |
| Elementary School | 369 | 27.5% |
| Middle School | 257 | 19.2% |
| High School | 268 | 20.0% |
| College / Undergraduate | 206 | 15.4% |
| Graduate / Professional | 82 | 6.1% |
| Total | 1,341 | 100.0% |
School Enrollment by Age by Funding Source in Silver Lakes
Out of a total of 1,341 students who are enrolled in schools in Silver Lakes, 325 (24.2%) attend a private institution, while the remaining 1,016 (75.8%) are enrolled in public schools. The age group of 25 to 34 year olds has the highest likelihood of being enrolled in private schools, with 30 (50.0% in the age bracket) enrolled. Conversely, the age group of 18 to 19 year olds has the lowest likelihood of being enrolled in a private school, with 25 (100.0% in the age bracket) attending a public institution.
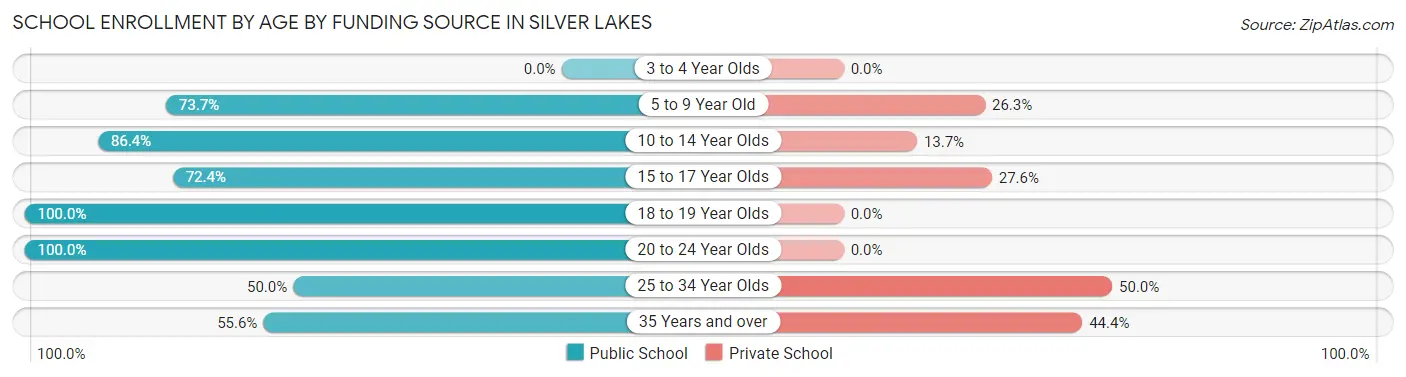
| Age Bracket | Public School | Private School |
| 3 to 4 Year Olds | 0 (0.0%) | 0 (0.0%) |
| 5 to 9 Year Old | 389 (73.7%) | 139 (26.3%) |
| 10 to 14 Year Olds | 253 (86.4%) | 40 (13.7%) |
| 15 to 17 Year Olds | 168 (72.4%) | 64 (27.6%) |
| 18 to 19 Year Olds | 25 (100.0%) | 0 (0.0%) |
| 20 to 24 Year Olds | 86 (100.0%) | 0 (0.0%) |
| 25 to 34 Year Olds | 30 (50.0%) | 30 (50.0%) |
| 35 Years and over | 65 (55.6%) | 52 (44.4%) |
| Total | 1,016 (75.8%) | 325 (24.2%) |
Educational Attainment by Field of Study in Silver Lakes
Visual & performing arts (214 | 22.0%), arts & humanities (206 | 21.2%), education (138 | 14.2%), engineering (137 | 14.1%), and liberal arts & history (91 | 9.4%) are the most common fields of study among 972 individuals in Silver Lakes who have obtained a bachelor's degree or higher.
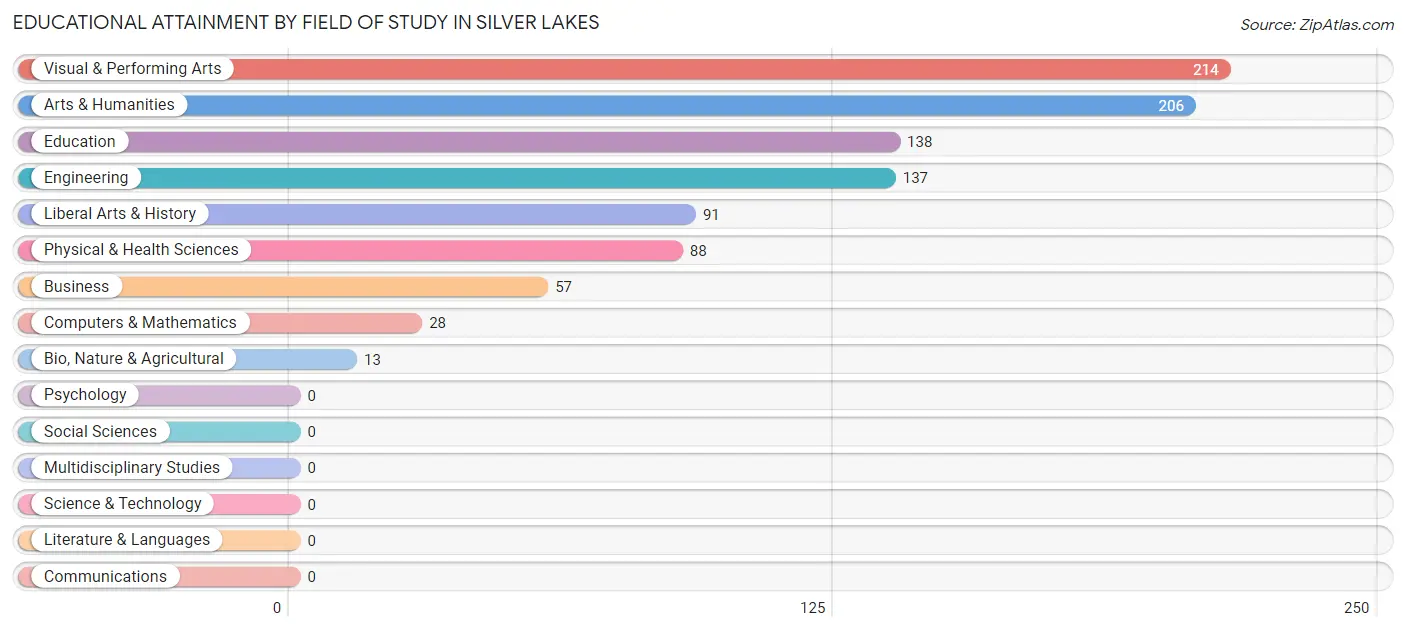
| Field of Study | # Graduates | % Graduates |
| Computers & Mathematics | 28 | 2.9% |
| Bio, Nature & Agricultural | 13 | 1.3% |
| Physical & Health Sciences | 88 | 9.0% |
| Psychology | 0 | 0.0% |
| Social Sciences | 0 | 0.0% |
| Engineering | 137 | 14.1% |
| Multidisciplinary Studies | 0 | 0.0% |
| Science & Technology | 0 | 0.0% |
| Business | 57 | 5.9% |
| Education | 138 | 14.2% |
| Literature & Languages | 0 | 0.0% |
| Liberal Arts & History | 91 | 9.4% |
| Visual & Performing Arts | 214 | 22.0% |
| Communications | 0 | 0.0% |
| Arts & Humanities | 206 | 21.2% |
| Total | 972 | 100.0% |
Transportation & Commute in Silver Lakes
Vehicle Availability by Sex in Silver Lakes
The most prevalent vehicle ownership categories in Silver Lakes are males with 3 vehicles (737, accounting for 51.8%) and females with 3 vehicles (480, making up 75.7%).
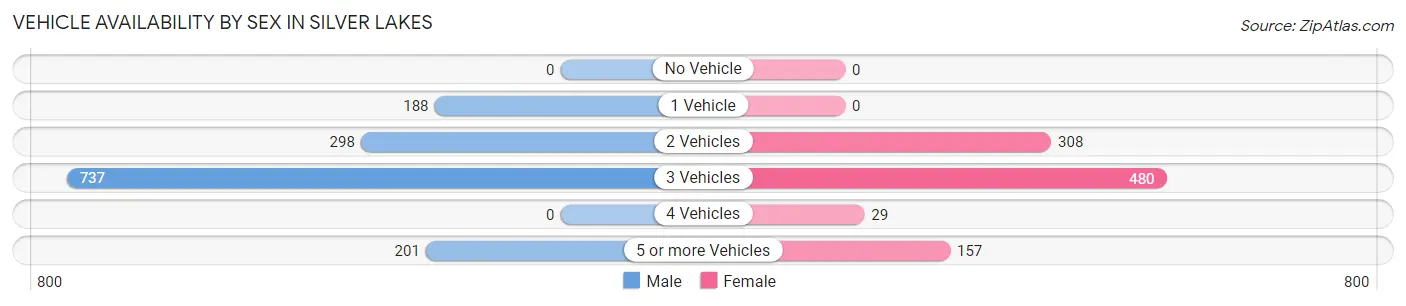
| Vehicles Available | Male | Female |
| No Vehicle | 0 (0.0%) | 0 (0.0%) |
| 1 Vehicle | 188 (13.2%) | 0 (0.0%) |
| 2 Vehicles | 298 (20.9%) | 308 (31.6%) |
| 3 Vehicles | 737 (51.8%) | 480 (49.3%) |
| 4 Vehicles | 0 (0.0%) | 29 (3.0%) |
| 5 or more Vehicles | 201 (14.1%) | 157 (16.1%) |
| Total | 1,424 (100.0%) | 974 (100.0%) |
Commute Time in Silver Lakes
The most frequently occuring commute durations in Silver Lakes are 60 to 89 minutes (659 commuters, 29.6%), 30 to 34 minutes (469 commuters, 21.0%), and 25 to 29 minutes (427 commuters, 19.2%).
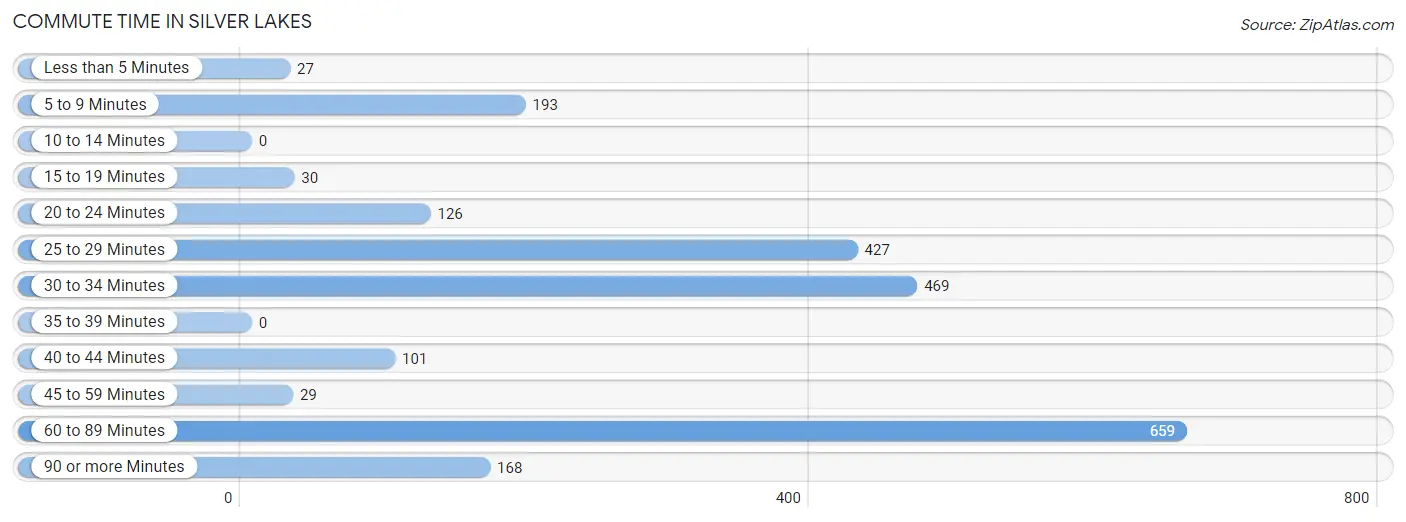
| Commute Time | # Commuters | % Commuters |
| Less than 5 Minutes | 27 | 1.2% |
| 5 to 9 Minutes | 193 | 8.7% |
| 10 to 14 Minutes | 0 | 0.0% |
| 15 to 19 Minutes | 30 | 1.3% |
| 20 to 24 Minutes | 126 | 5.7% |
| 25 to 29 Minutes | 427 | 19.2% |
| 30 to 34 Minutes | 469 | 21.0% |
| 35 to 39 Minutes | 0 | 0.0% |
| 40 to 44 Minutes | 101 | 4.5% |
| 45 to 59 Minutes | 29 | 1.3% |
| 60 to 89 Minutes | 659 | 29.6% |
| 90 or more Minutes | 168 | 7.5% |
Commute Time by Sex in Silver Lakes
The most common commute times in Silver Lakes are 60 to 89 minutes (539 commuters, 39.7%) for males and 30 to 34 minutes (290 commuters, 33.3%) for females.
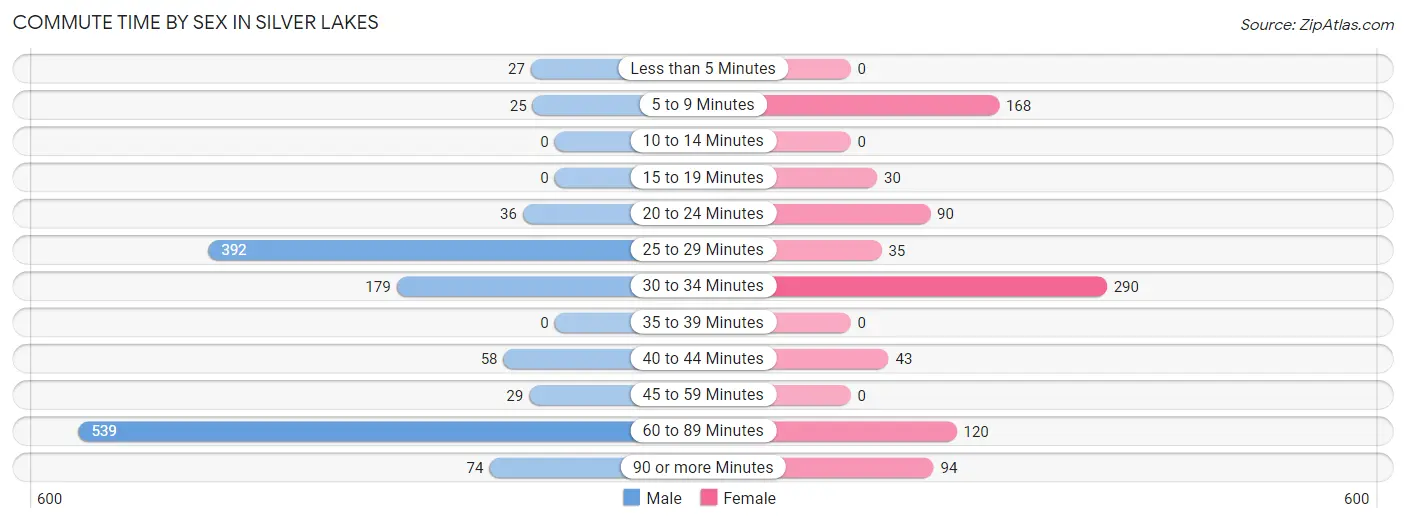
| Commute Time | Male | Female |
| Less than 5 Minutes | 27 (2.0%) | 0 (0.0%) |
| 5 to 9 Minutes | 25 (1.8%) | 168 (19.3%) |
| 10 to 14 Minutes | 0 (0.0%) | 0 (0.0%) |
| 15 to 19 Minutes | 0 (0.0%) | 30 (3.5%) |
| 20 to 24 Minutes | 36 (2.6%) | 90 (10.3%) |
| 25 to 29 Minutes | 392 (28.8%) | 35 (4.0%) |
| 30 to 34 Minutes | 179 (13.2%) | 290 (33.3%) |
| 35 to 39 Minutes | 0 (0.0%) | 0 (0.0%) |
| 40 to 44 Minutes | 58 (4.3%) | 43 (4.9%) |
| 45 to 59 Minutes | 29 (2.1%) | 0 (0.0%) |
| 60 to 89 Minutes | 539 (39.7%) | 120 (13.8%) |
| 90 or more Minutes | 74 (5.4%) | 94 (10.8%) |
Time of Departure to Work by Sex in Silver Lakes
The most frequent times of departure to work in Silver Lakes are 8:30 AM to 8:59 AM (198, 14.6%) for males and 9:00 AM to 9:59 AM (126, 14.5%) for females.
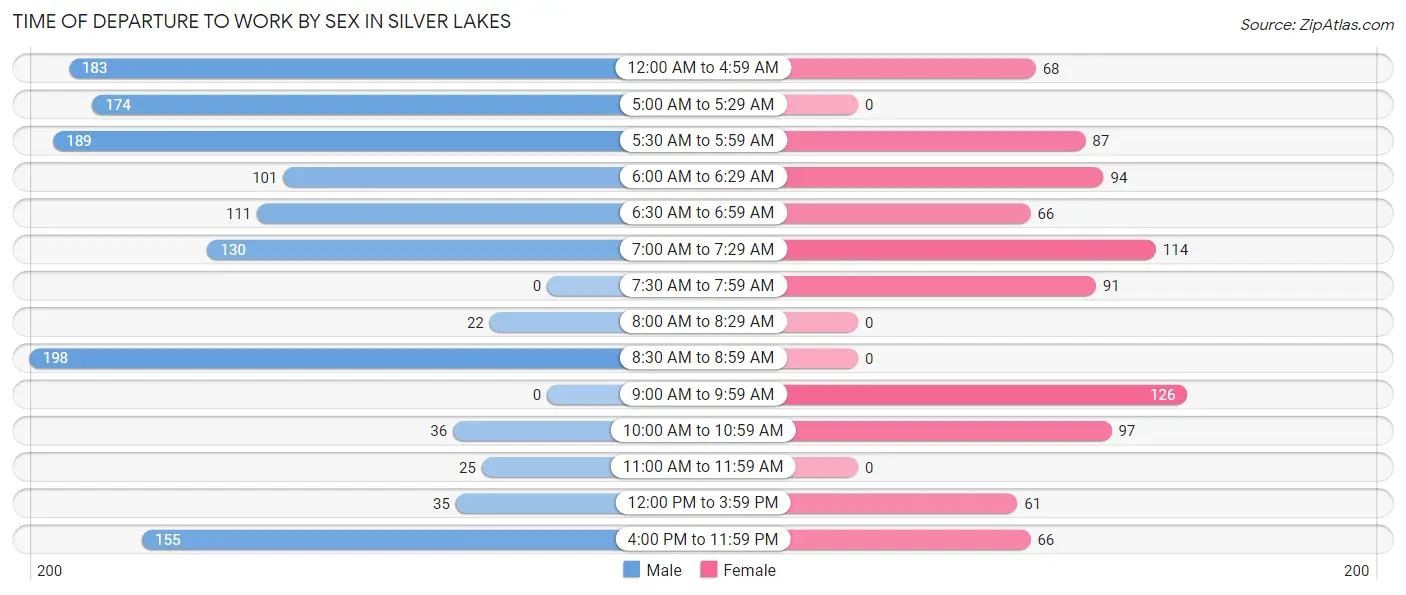
| Time of Departure | Male | Female |
| 12:00 AM to 4:59 AM | 183 (13.5%) | 68 (7.8%) |
| 5:00 AM to 5:29 AM | 174 (12.8%) | 0 (0.0%) |
| 5:30 AM to 5:59 AM | 189 (13.9%) | 87 (10.0%) |
| 6:00 AM to 6:29 AM | 101 (7.4%) | 94 (10.8%) |
| 6:30 AM to 6:59 AM | 111 (8.2%) | 66 (7.6%) |
| 7:00 AM to 7:29 AM | 130 (9.6%) | 114 (13.1%) |
| 7:30 AM to 7:59 AM | 0 (0.0%) | 91 (10.5%) |
| 8:00 AM to 8:29 AM | 22 (1.6%) | 0 (0.0%) |
| 8:30 AM to 8:59 AM | 198 (14.6%) | 0 (0.0%) |
| 9:00 AM to 9:59 AM | 0 (0.0%) | 126 (14.5%) |
| 10:00 AM to 10:59 AM | 36 (2.6%) | 97 (11.2%) |
| 11:00 AM to 11:59 AM | 25 (1.8%) | 0 (0.0%) |
| 12:00 PM to 3:59 PM | 35 (2.6%) | 61 (7.0%) |
| 4:00 PM to 11:59 PM | 155 (11.4%) | 66 (7.6%) |
| Total | 1,359 (100.0%) | 870 (100.0%) |
Housing Occupancy in Silver Lakes
Occupancy by Ownership in Silver Lakes
Of the total 2,150 dwellings in Silver Lakes, owner-occupied units account for 1,885 (87.7%), while renter-occupied units make up 265 (12.3%).
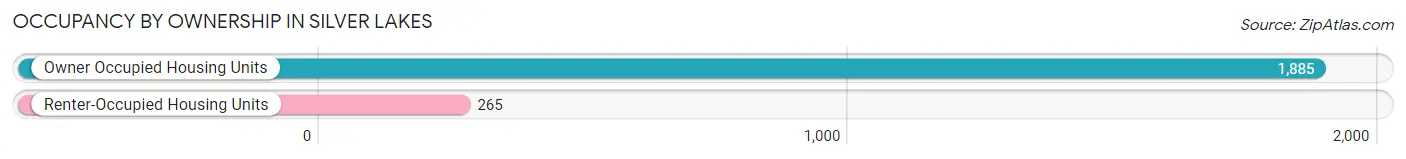
| Occupancy | # Housing Units | % Housing Units |
| Owner Occupied Housing Units | 1,885 | 87.7% |
| Renter-Occupied Housing Units | 265 | 12.3% |
| Total Occupied Housing Units | 2,150 | 100.0% |
Occupancy by Household Size in Silver Lakes
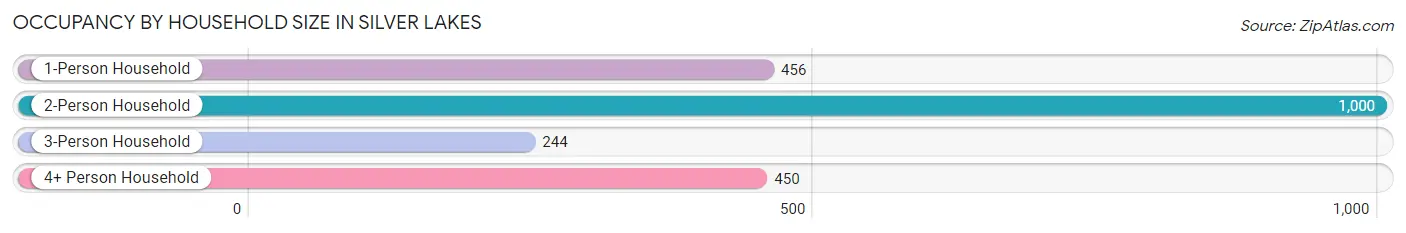
| Household Size | # Housing Units | % Housing Units |
| 1-Person Household | 456 | 21.2% |
| 2-Person Household | 1,000 | 46.5% |
| 3-Person Household | 244 | 11.4% |
| 4+ Person Household | 450 | 20.9% |
| Total Housing Units | 2,150 | 100.0% |
Occupancy by Ownership by Household Size in Silver Lakes
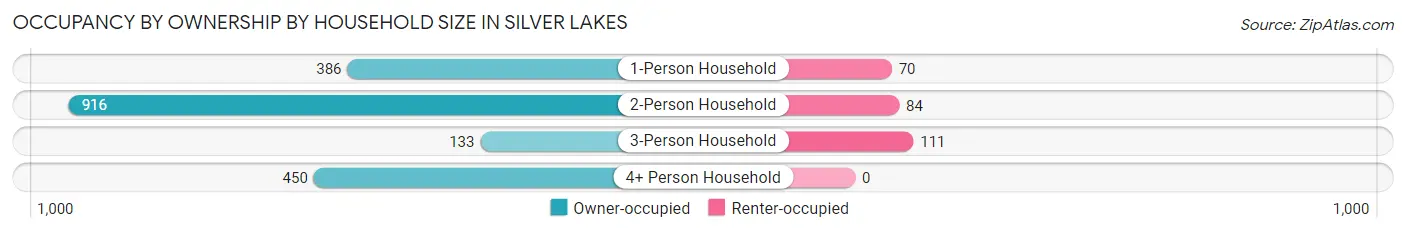
| Household Size | Owner-occupied | Renter-occupied |
| 1-Person Household | 386 (84.7%) | 70 (15.3%) |
| 2-Person Household | 916 (91.6%) | 84 (8.4%) |
| 3-Person Household | 133 (54.5%) | 111 (45.5%) |
| 4+ Person Household | 450 (100.0%) | 0 (0.0%) |
| Total Housing Units | 1,885 (87.7%) | 265 (12.3%) |
Occupancy by Educational Attainment in Silver Lakes
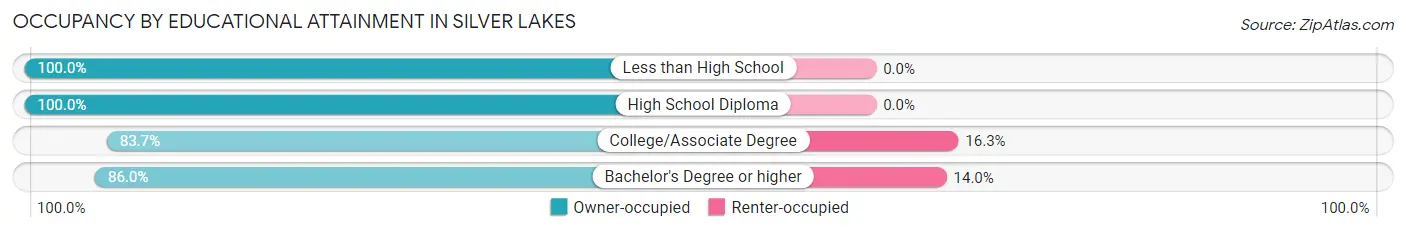
| Household Size | Owner-occupied | Renter-occupied |
| Less than High School | 90 (100.0%) | 0 (0.0%) |
| High School Diploma | 343 (100.0%) | 0 (0.0%) |
| College/Associate Degree | 904 (83.7%) | 176 (16.3%) |
| Bachelor's Degree or higher | 548 (86.0%) | 89 (14.0%) |
Occupancy by Age of Householder in Silver Lakes
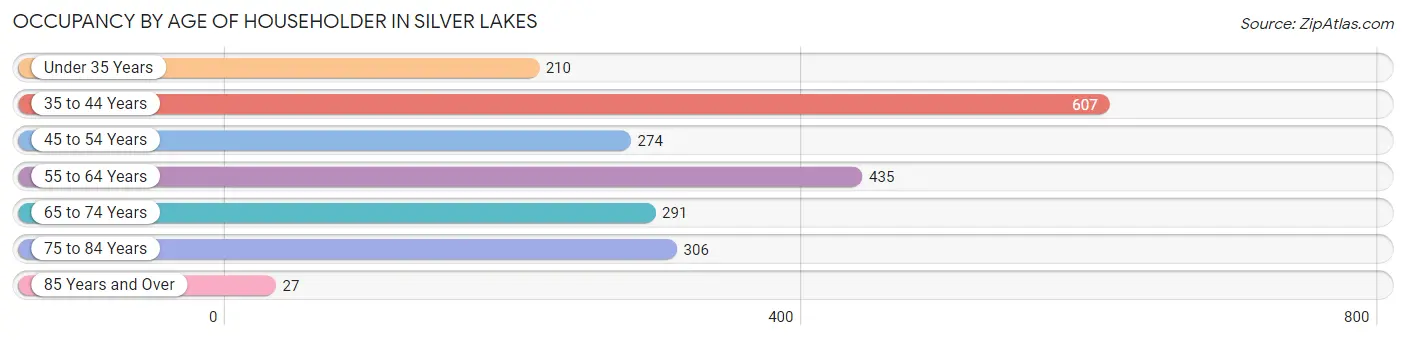
| Age Bracket | # Households | % Households |
| Under 35 Years | 210 | 9.8% |
| 35 to 44 Years | 607 | 28.2% |
| 45 to 54 Years | 274 | 12.7% |
| 55 to 64 Years | 435 | 20.2% |
| 65 to 74 Years | 291 | 13.5% |
| 75 to 84 Years | 306 | 14.2% |
| 85 Years and Over | 27 | 1.3% |
| Total | 2,150 | 100.0% |
Housing Finances in Silver Lakes
Median Income by Occupancy in Silver Lakes
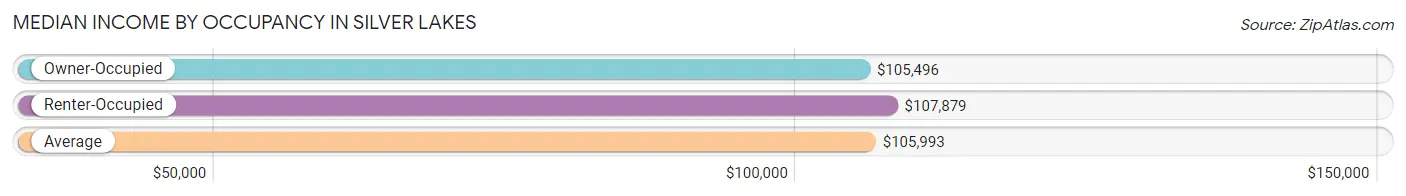
| Occupancy Type | # Households | Median Income |
| Owner-Occupied | 1,885 (87.7%) | $105,496 |
| Renter-Occupied | 265 (12.3%) | $107,879 |
| Average | 2,150 (100.0%) | $105,993 |
Occupancy by Householder Income Bracket in Silver Lakes
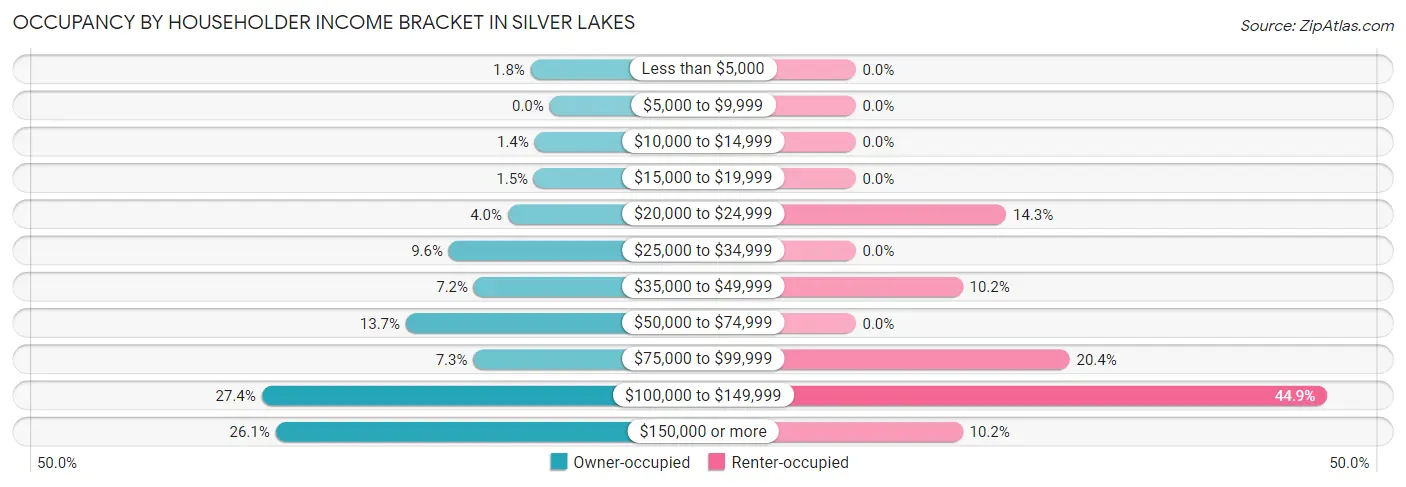
| Income Bracket | Owner-occupied | Renter-occupied |
| Less than $5,000 | 34 (1.8%) | 0 (0.0%) |
| $5,000 to $9,999 | 0 (0.0%) | 0 (0.0%) |
| $10,000 to $14,999 | 27 (1.4%) | 0 (0.0%) |
| $15,000 to $19,999 | 28 (1.5%) | 0 (0.0%) |
| $20,000 to $24,999 | 75 (4.0%) | 38 (14.3%) |
| $25,000 to $34,999 | 181 (9.6%) | 0 (0.0%) |
| $35,000 to $49,999 | 136 (7.2%) | 27 (10.2%) |
| $50,000 to $74,999 | 258 (13.7%) | 0 (0.0%) |
| $75,000 to $99,999 | 137 (7.3%) | 54 (20.4%) |
| $100,000 to $149,999 | 517 (27.4%) | 119 (44.9%) |
| $150,000 or more | 492 (26.1%) | 27 (10.2%) |
| Total | 1,885 (100.0%) | 265 (100.0%) |
Monthly Housing Cost Tiers in Silver Lakes
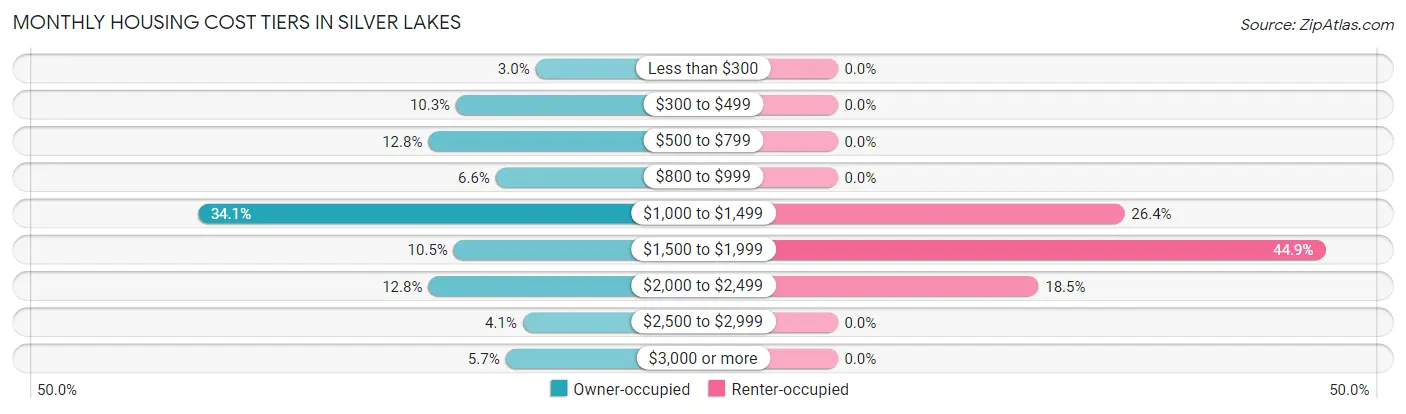
| Monthly Cost | Owner-occupied | Renter-occupied |
| Less than $300 | 56 (3.0%) | 0 (0.0%) |
| $300 to $499 | 194 (10.3%) | 0 (0.0%) |
| $500 to $799 | 242 (12.8%) | 0 (0.0%) |
| $800 to $999 | 125 (6.6%) | 0 (0.0%) |
| $1,000 to $1,499 | 642 (34.1%) | 70 (26.4%) |
| $1,500 to $1,999 | 198 (10.5%) | 119 (44.9%) |
| $2,000 to $2,499 | 242 (12.8%) | 49 (18.5%) |
| $2,500 to $2,999 | 78 (4.1%) | 0 (0.0%) |
| $3,000 or more | 108 (5.7%) | 0 (0.0%) |
| Total | 1,885 (100.0%) | 265 (100.0%) |
Physical Housing Characteristics in Silver Lakes
Housing Structures in Silver Lakes
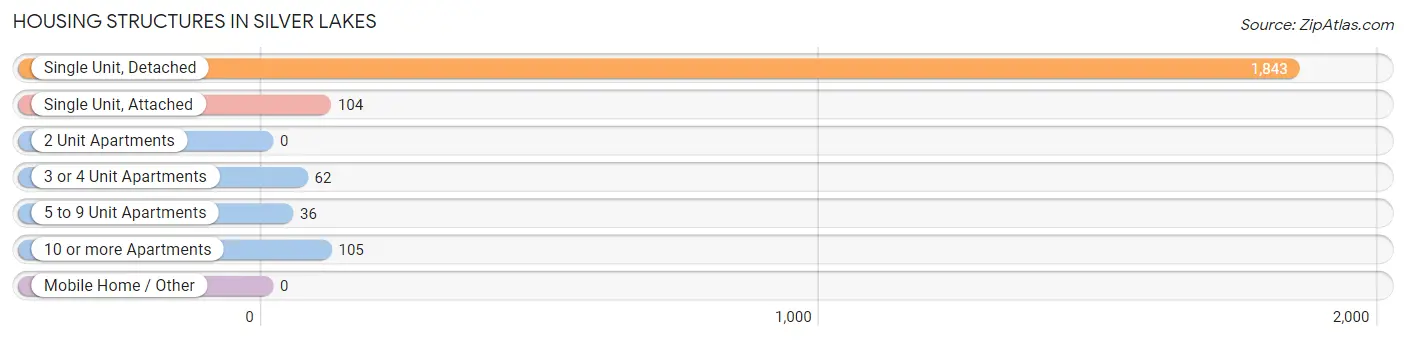
| Structure Type | # Housing Units | % Housing Units |
| Single Unit, Detached | 1,843 | 85.7% |
| Single Unit, Attached | 104 | 4.8% |
| 2 Unit Apartments | 0 | 0.0% |
| 3 or 4 Unit Apartments | 62 | 2.9% |
| 5 to 9 Unit Apartments | 36 | 1.7% |
| 10 or more Apartments | 105 | 4.9% |
| Mobile Home / Other | 0 | 0.0% |
| Total | 2,150 | 100.0% |
Housing Structures by Occupancy in Silver Lakes
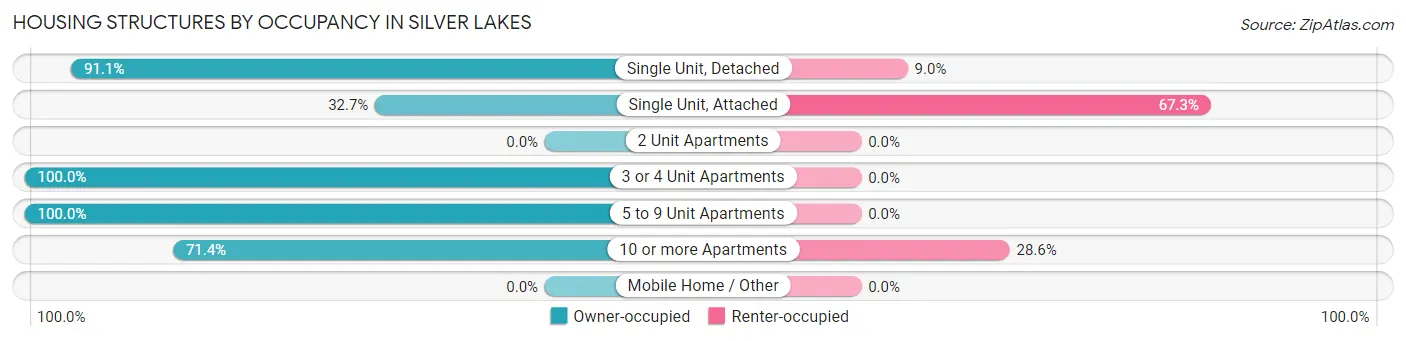
| Structure Type | Owner-occupied | Renter-occupied |
| Single Unit, Detached | 1,678 (91.0%) | 165 (8.9%) |
| Single Unit, Attached | 34 (32.7%) | 70 (67.3%) |
| 2 Unit Apartments | 0 (0.0%) | 0 (0.0%) |
| 3 or 4 Unit Apartments | 62 (100.0%) | 0 (0.0%) |
| 5 to 9 Unit Apartments | 36 (100.0%) | 0 (0.0%) |
| 10 or more Apartments | 75 (71.4%) | 30 (28.6%) |
| Mobile Home / Other | 0 (0.0%) | 0 (0.0%) |
| Total | 1,885 (87.7%) | 265 (12.3%) |
Housing Structures by Number of Rooms in Silver Lakes
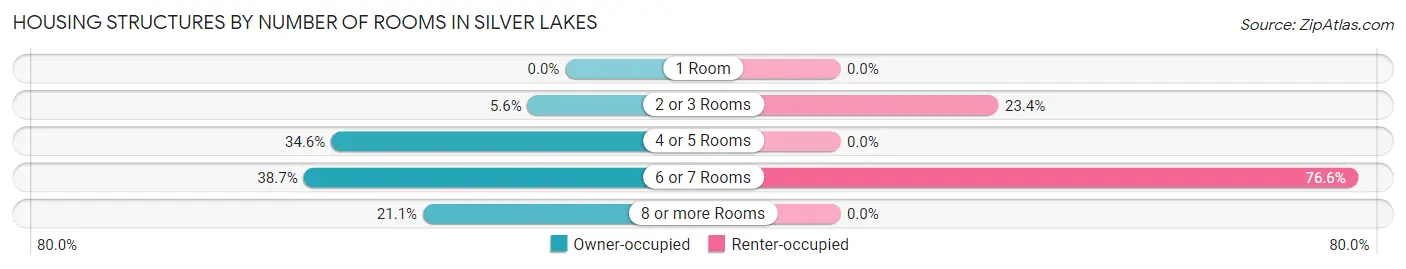
| Number of Rooms | Owner-occupied | Renter-occupied |
| 1 Room | 0 (0.0%) | 0 (0.0%) |
| 2 or 3 Rooms | 105 (5.6%) | 62 (23.4%) |
| 4 or 5 Rooms | 653 (34.6%) | 0 (0.0%) |
| 6 or 7 Rooms | 730 (38.7%) | 203 (76.6%) |
| 8 or more Rooms | 397 (21.1%) | 0 (0.0%) |
| Total | 1,885 (100.0%) | 265 (100.0%) |
Housing Structure by Heating Type in Silver Lakes
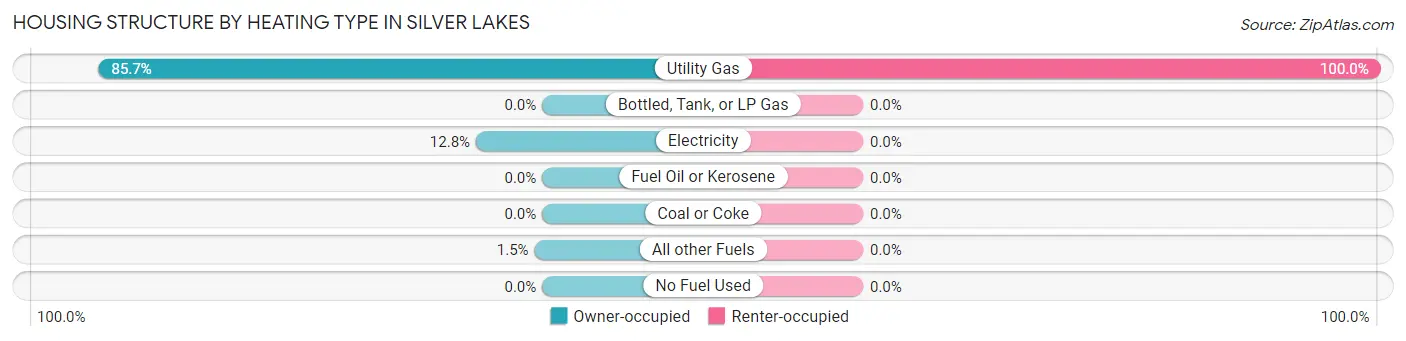
| Heating Type | Owner-occupied | Renter-occupied |
| Utility Gas | 1,616 (85.7%) | 265 (100.0%) |
| Bottled, Tank, or LP Gas | 0 (0.0%) | 0 (0.0%) |
| Electricity | 241 (12.8%) | 0 (0.0%) |
| Fuel Oil or Kerosene | 0 (0.0%) | 0 (0.0%) |
| Coal or Coke | 0 (0.0%) | 0 (0.0%) |
| All other Fuels | 28 (1.5%) | 0 (0.0%) |
| No Fuel Used | 0 (0.0%) | 0 (0.0%) |
| Total | 1,885 (100.0%) | 265 (100.0%) |
Household Vehicle Usage in Silver Lakes
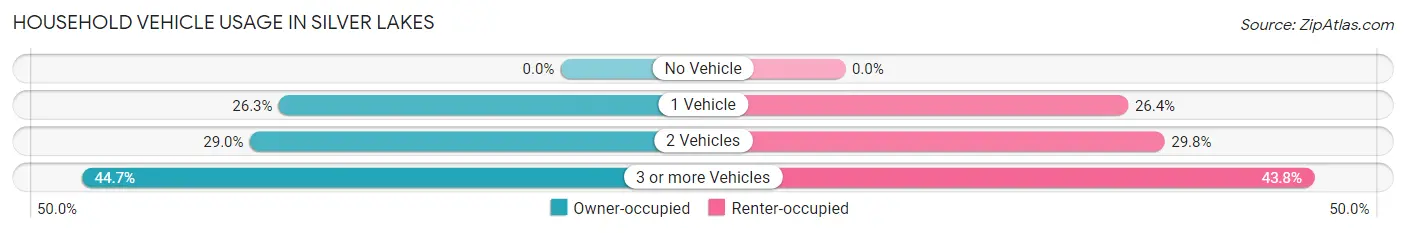
| Vehicles per Household | Owner-occupied | Renter-occupied |
| No Vehicle | 0 (0.0%) | 0 (0.0%) |
| 1 Vehicle | 496 (26.3%) | 70 (26.4%) |
| 2 Vehicles | 547 (29.0%) | 79 (29.8%) |
| 3 or more Vehicles | 842 (44.7%) | 116 (43.8%) |
| Total | 1,885 (100.0%) | 265 (100.0%) |
Real Estate & Mortgages in Silver Lakes
Real Estate and Mortgage Overview in Silver Lakes
| Characteristic | Without Mortgage | With Mortgage |
| Housing Units | 827 | 1,058 |
| Median Property Value | $309,100 | $341,600 |
| Median Household Income | $115,647 | $194 |
| Monthly Housing Costs | $710 | $108 |
| Real Estate Taxes | $3,546 | $0 |
Property Value by Mortgage Status in Silver Lakes
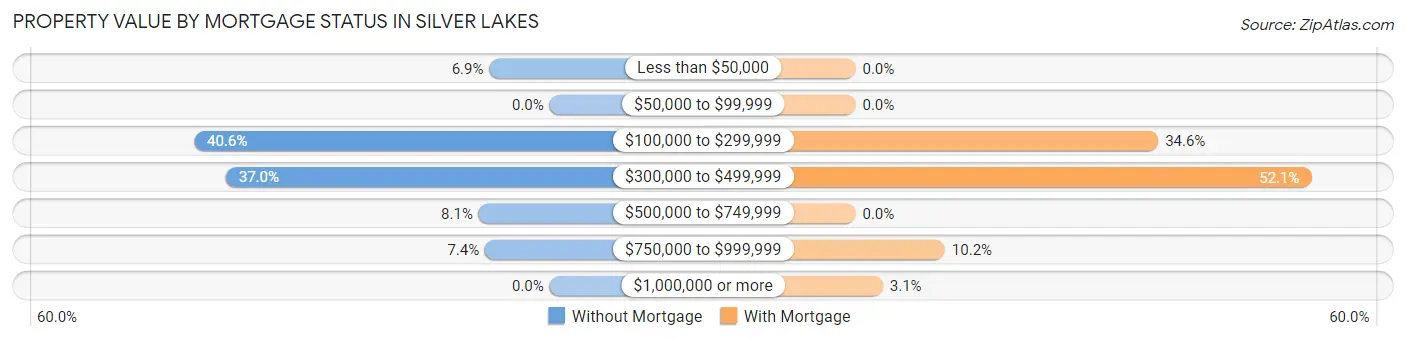
| Property Value | Without Mortgage | With Mortgage |
| Less than $50,000 | 57 (6.9%) | 0 (0.0%) |
| $50,000 to $99,999 | 0 (0.0%) | 0 (0.0%) |
| $100,000 to $299,999 | 336 (40.6%) | 366 (34.6%) |
| $300,000 to $499,999 | 306 (37.0%) | 551 (52.1%) |
| $500,000 to $749,999 | 67 (8.1%) | 0 (0.0%) |
| $750,000 to $999,999 | 61 (7.4%) | 108 (10.2%) |
| $1,000,000 or more | 0 (0.0%) | 33 (3.1%) |
| Total | 827 (100.0%) | 1,058 (100.0%) |
Household Income by Mortgage Status in Silver Lakes
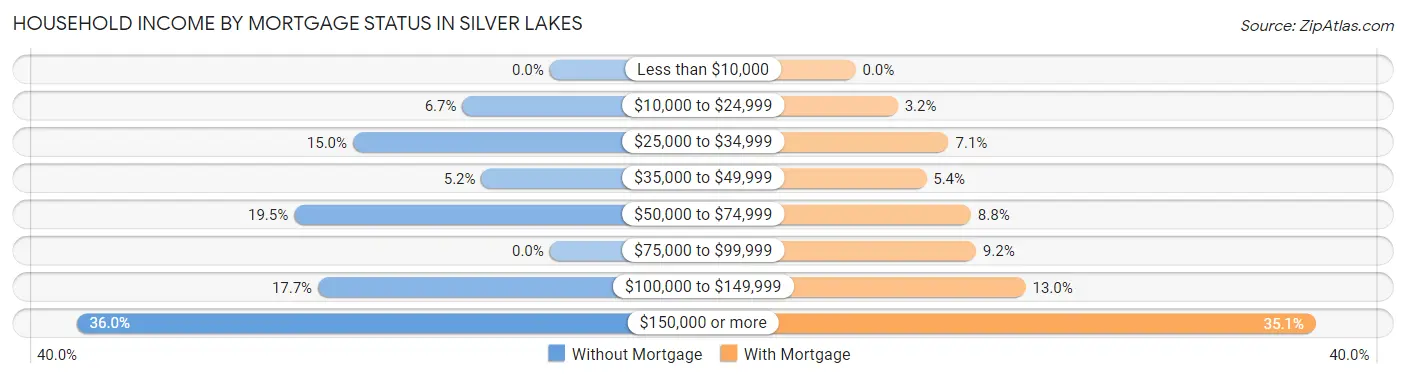
| Household Income | Without Mortgage | With Mortgage |
| Less than $10,000 | 0 (0.0%) | 0 (0.0%) |
| $10,000 to $24,999 | 55 (6.7%) | 34 (3.2%) |
| $25,000 to $34,999 | 124 (15.0%) | 75 (7.1%) |
| $35,000 to $49,999 | 43 (5.2%) | 57 (5.4%) |
| $50,000 to $74,999 | 161 (19.5%) | 93 (8.8%) |
| $75,000 to $99,999 | 0 (0.0%) | 97 (9.2%) |
| $100,000 to $149,999 | 146 (17.6%) | 137 (13.0%) |
| $150,000 or more | 298 (36.0%) | 371 (35.1%) |
| Total | 827 (100.0%) | 1,058 (100.0%) |
Property Value to Household Income Ratio in Silver Lakes
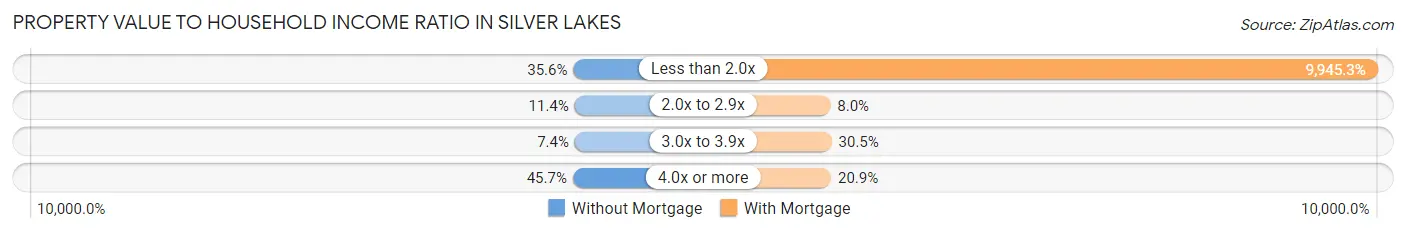
| Value-to-Income Ratio | Without Mortgage | With Mortgage |
| Less than 2.0x | 294 (35.5%) | 105,221 (9,945.3%) |
| 2.0x to 2.9x | 94 (11.4%) | 85 (8.0%) |
| 3.0x to 3.9x | 61 (7.4%) | 323 (30.5%) |
| 4.0x or more | 378 (45.7%) | 221 (20.9%) |
| Total | 827 (100.0%) | 1,058 (100.0%) |
Real Estate Taxes by Mortgage Status in Silver Lakes
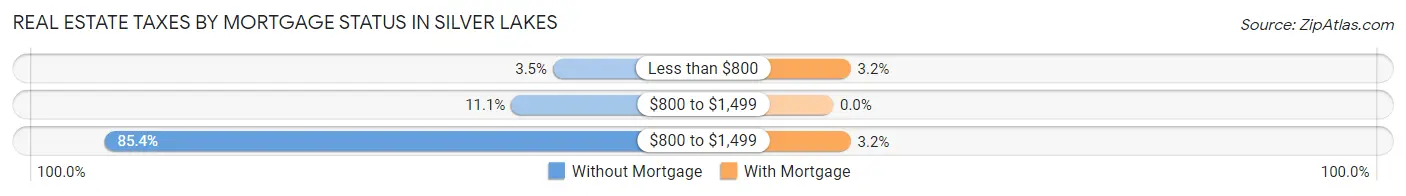
| Property Taxes | Without Mortgage | With Mortgage |
| Less than $800 | 29 (3.5%) | 34 (3.2%) |
| $800 to $1,499 | 92 (11.1%) | 0 (0.0%) |
| $800 to $1,499 | 706 (85.4%) | 34 (3.2%) |
| Total | 827 (100.0%) | 1,058 (100.0%) |
Health & Disability in Silver Lakes
Health Insurance Coverage by Age in Silver Lakes
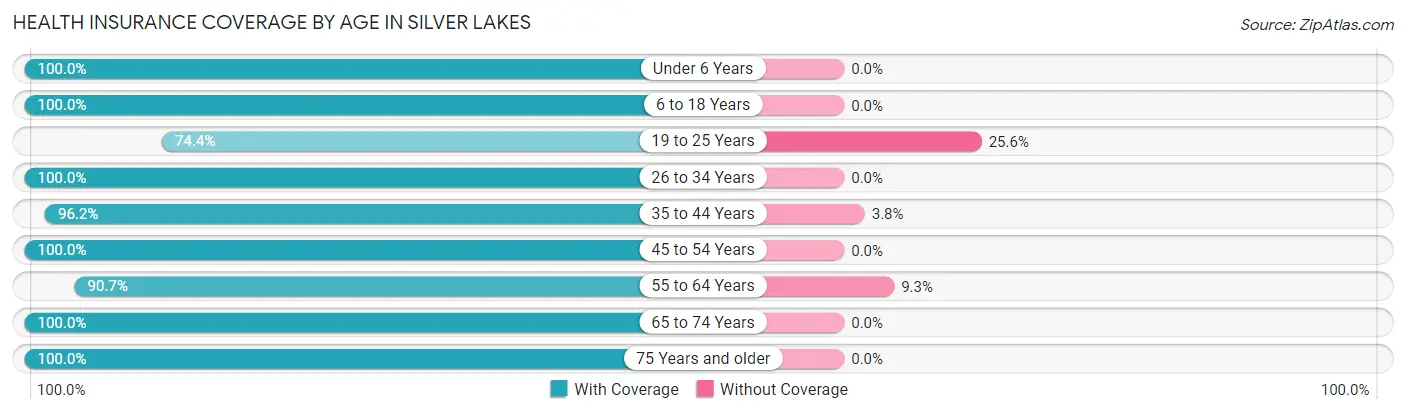
| Age Bracket | With Coverage | Without Coverage |
| Under 6 Years | 373 (100.0%) | 0 (0.0%) |
| 6 to 18 Years | 908 (100.0%) | 0 (0.0%) |
| 19 to 25 Years | 293 (74.4%) | 101 (25.6%) |
| 26 to 34 Years | 438 (100.0%) | 0 (0.0%) |
| 35 to 44 Years | 1,083 (96.2%) | 43 (3.8%) |
| 45 to 54 Years | 558 (100.0%) | 0 (0.0%) |
| 55 to 64 Years | 643 (90.7%) | 66 (9.3%) |
| 65 to 74 Years | 481 (100.0%) | 0 (0.0%) |
| 75 Years and older | 545 (100.0%) | 0 (0.0%) |
| Total | 5,322 (96.2%) | 210 (3.8%) |
Health Insurance Coverage by Citizenship Status in Silver Lakes
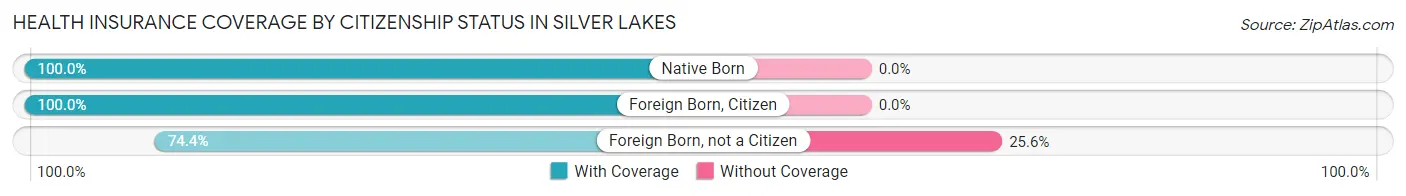
| Citizenship Status | With Coverage | Without Coverage |
| Native Born | 373 (100.0%) | 0 (0.0%) |
| Foreign Born, Citizen | 908 (100.0%) | 0 (0.0%) |
| Foreign Born, not a Citizen | 293 (74.4%) | 101 (25.6%) |
Health Insurance Coverage by Household Income in Silver Lakes
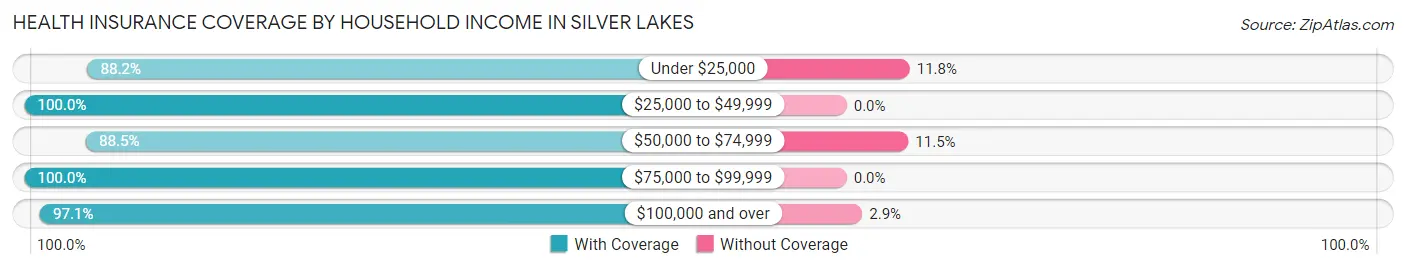
| Household Income | With Coverage | Without Coverage |
| Under $25,000 | 254 (88.2%) | 34 (11.8%) |
| $25,000 to $49,999 | 574 (100.0%) | 0 (0.0%) |
| $50,000 to $74,999 | 575 (88.5%) | 75 (11.5%) |
| $75,000 to $99,999 | 555 (100.0%) | 0 (0.0%) |
| $100,000 and over | 3,364 (97.1%) | 101 (2.9%) |
Public vs Private Health Insurance Coverage by Age in Silver Lakes
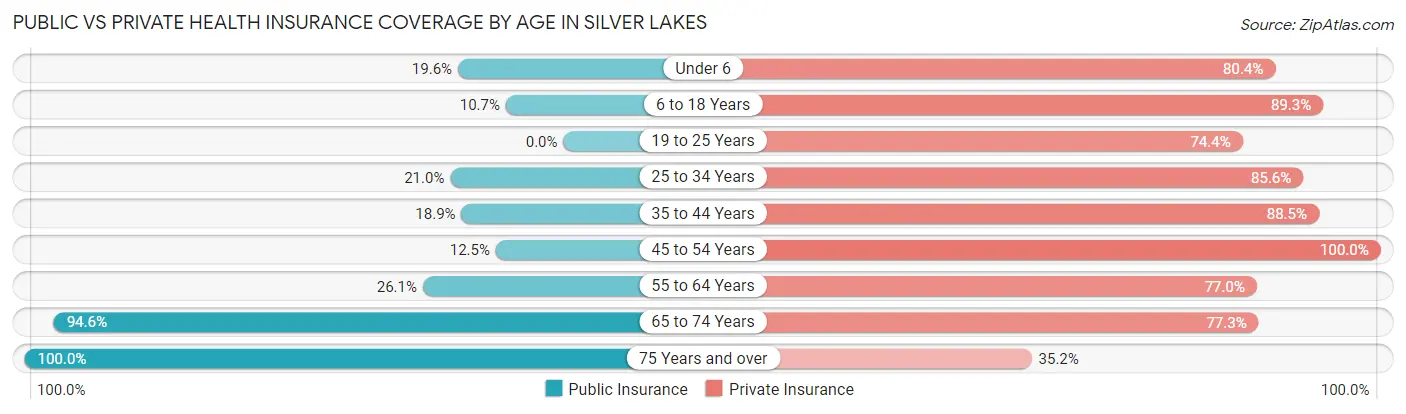
| Age Bracket | Public Insurance | Private Insurance |
| Under 6 | 73 (19.6%) | 300 (80.4%) |
| 6 to 18 Years | 97 (10.7%) | 811 (89.3%) |
| 19 to 25 Years | 0 (0.0%) | 293 (74.4%) |
| 25 to 34 Years | 92 (21.0%) | 375 (85.6%) |
| 35 to 44 Years | 213 (18.9%) | 997 (88.5%) |
| 45 to 54 Years | 70 (12.5%) | 558 (100.0%) |
| 55 to 64 Years | 185 (26.1%) | 546 (77.0%) |
| 65 to 74 Years | 455 (94.6%) | 372 (77.3%) |
| 75 Years and over | 545 (100.0%) | 192 (35.2%) |
| Total | 1,730 (31.3%) | 4,444 (80.3%) |
Disability Status by Sex by Age in Silver Lakes
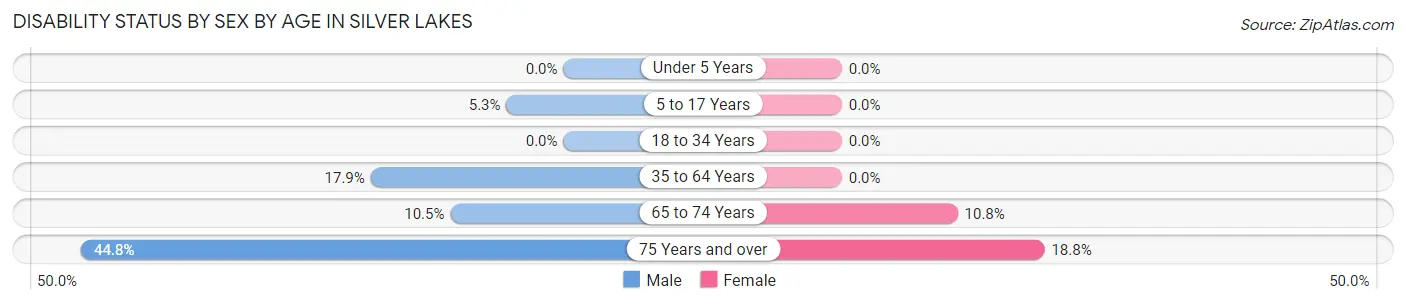
| Age Bracket | Male | Female |
| Under 5 Years | 0 (0.0%) | 0 (0.0%) |
| 5 to 17 Years | 33 (5.3%) | 0 (0.0%) |
| 18 to 34 Years | 0 (0.0%) | 0 (0.0%) |
| 35 to 64 Years | 180 (17.9%) | 0 (0.0%) |
| 65 to 74 Years | 28 (10.5%) | 23 (10.7%) |
| 75 Years and over | 94 (44.8%) | 63 (18.8%) |
Disability Class by Sex by Age in Silver Lakes
Disability Class: Hearing Difficulty
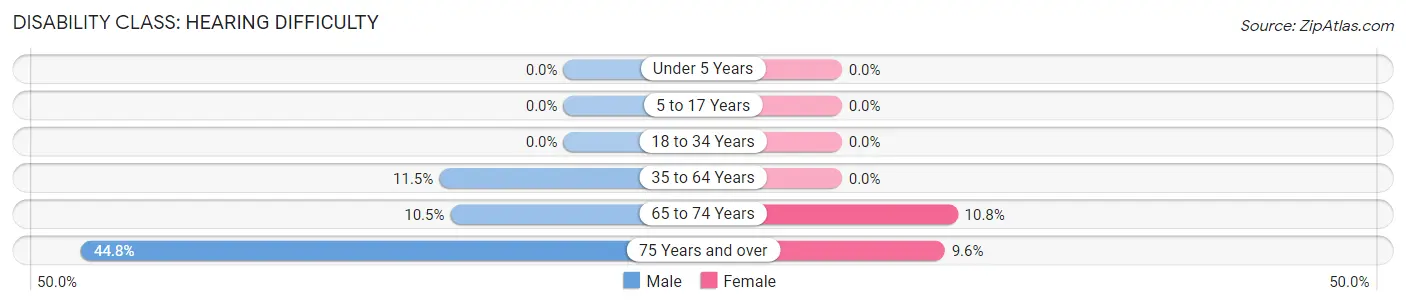
| Age Bracket | Male | Female |
| Under 5 Years | 0 (0.0%) | 0 (0.0%) |
| 5 to 17 Years | 0 (0.0%) | 0 (0.0%) |
| 18 to 34 Years | 0 (0.0%) | 0 (0.0%) |
| 35 to 64 Years | 116 (11.5%) | 0 (0.0%) |
| 65 to 74 Years | 28 (10.5%) | 23 (10.7%) |
| 75 Years and over | 94 (44.8%) | 32 (9.6%) |
Disability Class: Vision Difficulty
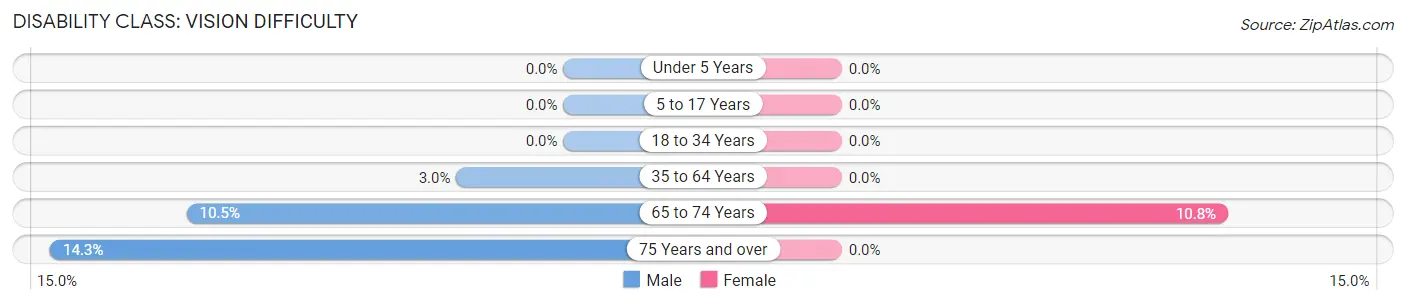
| Age Bracket | Male | Female |
| Under 5 Years | 0 (0.0%) | 0 (0.0%) |
| 5 to 17 Years | 0 (0.0%) | 0 (0.0%) |
| 18 to 34 Years | 0 (0.0%) | 0 (0.0%) |
| 35 to 64 Years | 30 (3.0%) | 0 (0.0%) |
| 65 to 74 Years | 28 (10.5%) | 23 (10.7%) |
| 75 Years and over | 30 (14.3%) | 0 (0.0%) |
Disability Class: Cognitive Difficulty
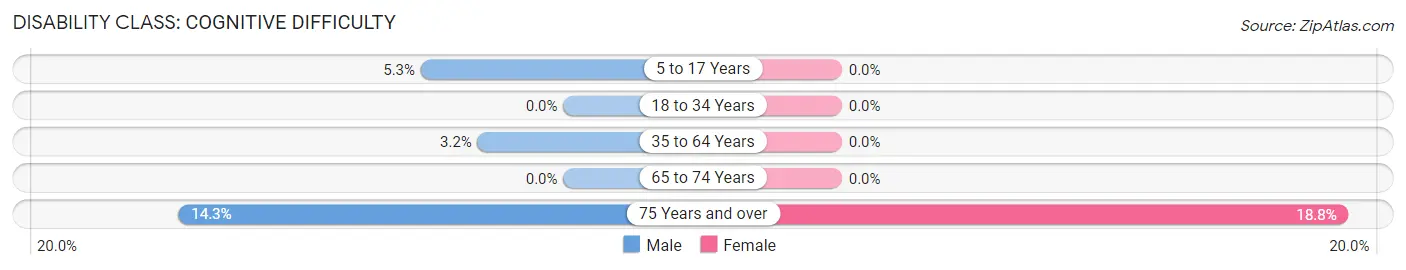
| Age Bracket | Male | Female |
| 5 to 17 Years | 33 (5.3%) | 0 (0.0%) |
| 18 to 34 Years | 0 (0.0%) | 0 (0.0%) |
| 35 to 64 Years | 32 (3.2%) | 0 (0.0%) |
| 65 to 74 Years | 0 (0.0%) | 0 (0.0%) |
| 75 Years and over | 30 (14.3%) | 63 (18.8%) |
Disability Class: Ambulatory Difficulty
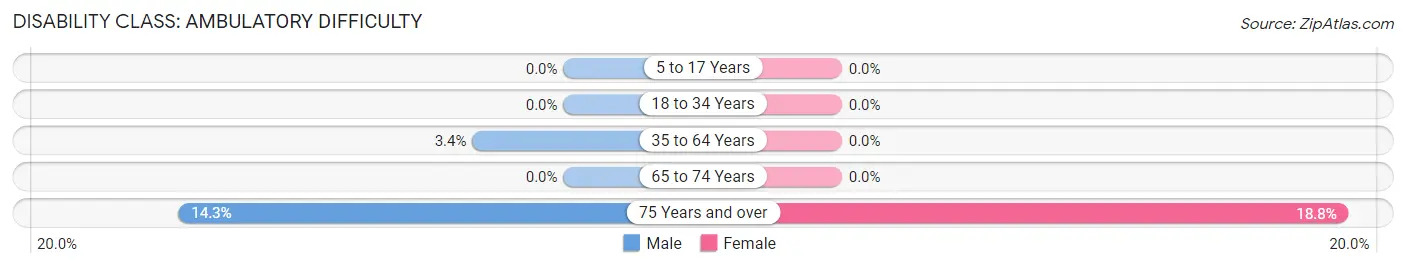
| Age Bracket | Male | Female |
| 5 to 17 Years | 0 (0.0%) | 0 (0.0%) |
| 18 to 34 Years | 0 (0.0%) | 0 (0.0%) |
| 35 to 64 Years | 34 (3.4%) | 0 (0.0%) |
| 65 to 74 Years | 0 (0.0%) | 0 (0.0%) |
| 75 Years and over | 30 (14.3%) | 63 (18.8%) |
Disability Class: Self-Care Difficulty
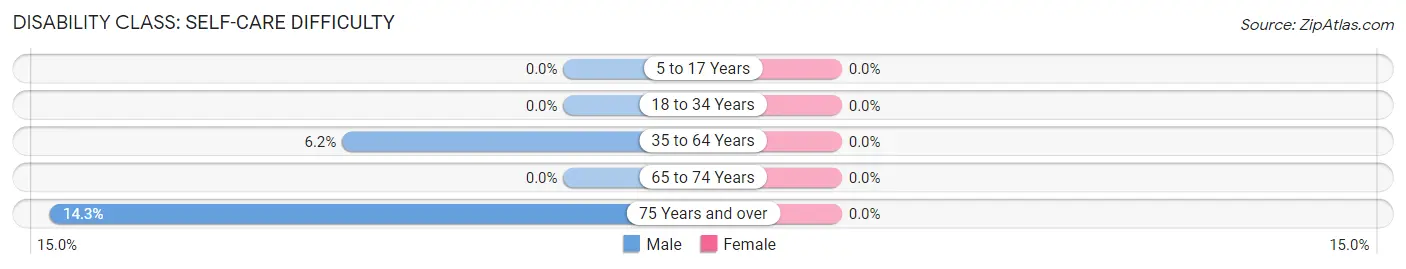
| Age Bracket | Male | Female |
| 5 to 17 Years | 0 (0.0%) | 0 (0.0%) |
| 18 to 34 Years | 0 (0.0%) | 0 (0.0%) |
| 35 to 64 Years | 62 (6.2%) | 0 (0.0%) |
| 65 to 74 Years | 0 (0.0%) | 0 (0.0%) |
| 75 Years and over | 30 (14.3%) | 0 (0.0%) |
Technology Access in Silver Lakes
Computing Device Access in Silver Lakes
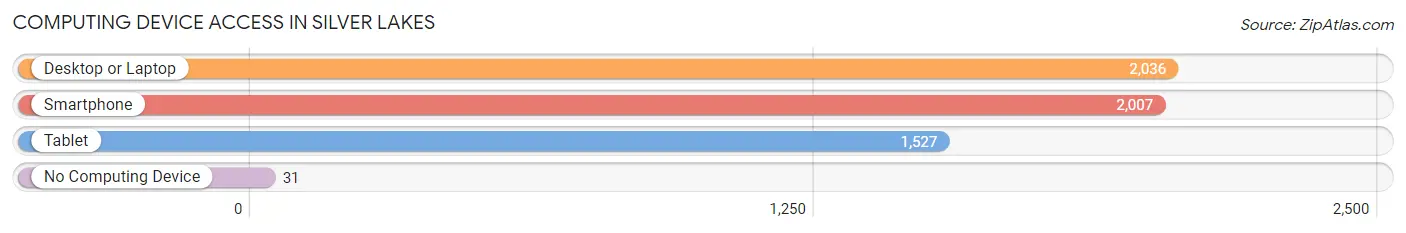
| Device Type | # Households | % Households |
| Desktop or Laptop | 2,036 | 94.7% |
| Smartphone | 2,007 | 93.3% |
| Tablet | 1,527 | 71.0% |
| No Computing Device | 31 | 1.4% |
| Total | 2,150 | 100.0% |
Internet Access in Silver Lakes
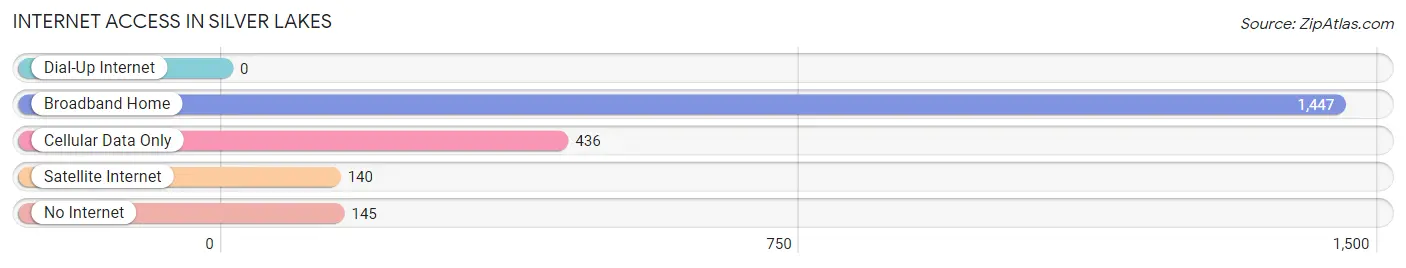
| Internet Type | # Households | % Households |
| Dial-Up Internet | 0 | 0.0% |
| Broadband Home | 1,447 | 67.3% |
| Cellular Data Only | 436 | 20.3% |
| Satellite Internet | 140 | 6.5% |
| No Internet | 145 | 6.7% |
| Total | 2,150 | 100.0% |
Silver Lakes Summary
Introduction
Silver Lakes is a census-designated place located in San Bernardino County, California. It is situated in the Mojave Desert, approximately 25 miles northeast of Barstow. The population of Silver Lakes was 2,845 at the 2010 census. The area is known for its recreational activities, such as fishing, boating, and camping.
History
Silver Lakes was originally inhabited by the Serrano Indians, who were the first to settle in the area. The Serrano Indians were a peaceful tribe who lived off the land and were known for their basket weaving and pottery.
In the late 1800s, the area was settled by ranchers and miners who were looking for gold and silver. The area was known as Silver Lakes because of the many lakes in the area. The area was also known for its abundance of wild game, such as deer, antelope, and rabbits.
In the early 1900s, the area was developed as a resort community. The Silver Lakes Resort was built in the 1920s and was a popular destination for tourists. The resort featured a golf course, tennis courts, and a swimming pool.
In the 1950s, the area was developed as a residential community. The Silver Lakes Country Club was built in the 1960s and is still a popular destination for golfers.
Geography
Silver Lakes is located in the Mojave Desert, approximately 25 miles northeast of Barstow. The area is known for its dry climate and is surrounded by mountains. The area is also known for its abundance of lakes, which are used for recreational activities such as fishing, boating, and camping.
The area is also known for its abundance of wildlife, such as deer, antelope, and rabbits. The area is also home to a variety of birds, including quail, doves, and hawks.
Economy
The economy of Silver Lakes is largely based on tourism. The area is known for its recreational activities, such as fishing, boating, and camping. The Silver Lakes Country Club is a popular destination for golfers.
The area is also home to a variety of businesses, such as restaurants, convenience stores, and gas stations. The area is also home to a variety of manufacturing companies, such as furniture makers and metal fabricators.
Demographics
The population of Silver Lakes was 2,845 at the 2010 census. The population is largely composed of white (77.3%) and Hispanic (17.2%) residents. The median household income is $45,938 and the median age is 37.
Conclusion
Silver Lakes is a census-designated place located in San Bernardino County, California. It is situated in the Mojave Desert, approximately 25 miles northeast of Barstow. The population of Silver Lakes was 2,845 at the 2010 census. The area is known for its recreational activities, such as fishing, boating, and camping. The economy of Silver Lakes is largely based on tourism and the area is home to a variety of businesses. The population is largely composed of white (77.3%) and Hispanic (17.2%) residents.
Common Questions
What is Per Capita Income in Silver Lakes?
Per Capita income in Silver Lakes is $43,661.
What is the Median Family Income in Silver Lakes?
Median Family Income in Silver Lakes is $108,469.
What is the Median Household income in Silver Lakes?
Median Household Income in Silver Lakes is $105,993.
What is Income or Wage Gap in Silver Lakes?
Income or Wage Gap in Silver Lakes is 29.1%.
Women in Silver Lakes earn 70.9 cents for every dollar earned by a man.
What is Inequality or Gini Index in Silver Lakes?
Inequality or Gini Index in Silver Lakes is 0.38.
What is the Total Population of Silver Lakes?
Total Population of Silver Lakes is 5,532.
What is the Total Male Population of Silver Lakes?
Total Male Population of Silver Lakes is 2,824.
What is the Total Female Population of Silver Lakes?
Total Female Population of Silver Lakes is 2,708.
What is the Ratio of Males per 100 Females in Silver Lakes?
There are 104.28 Males per 100 Females in Silver Lakes.
What is the Ratio of Females per 100 Males in Silver Lakes?
There are 95.89 Females per 100 Males in Silver Lakes.
What is the Median Population Age in Silver Lakes?
Median Population Age in Silver Lakes is 39.5 Years.
What is the Average Family Size in Silver Lakes
Average Family Size in Silver Lakes is 3.0 People.
What is the Average Household Size in Silver Lakes
Average Household Size in Silver Lakes is 2.6 People.
How Large is the Labor Force in Silver Lakes?
There are 2,624 People in the Labor Forcein in Silver Lakes.
What is the Percentage of People in the Labor Force in Silver Lakes?
59.4% of People are in the Labor Force in Silver Lakes.
What is the Unemployment Rate in Silver Lakes?
Unemployment Rate in Silver Lakes is 2.8%.