Cities with the Highest Percentage of Honduran Population in California
RELATED REPORTS & OPTIONS
Honduran
California
Compare Cities
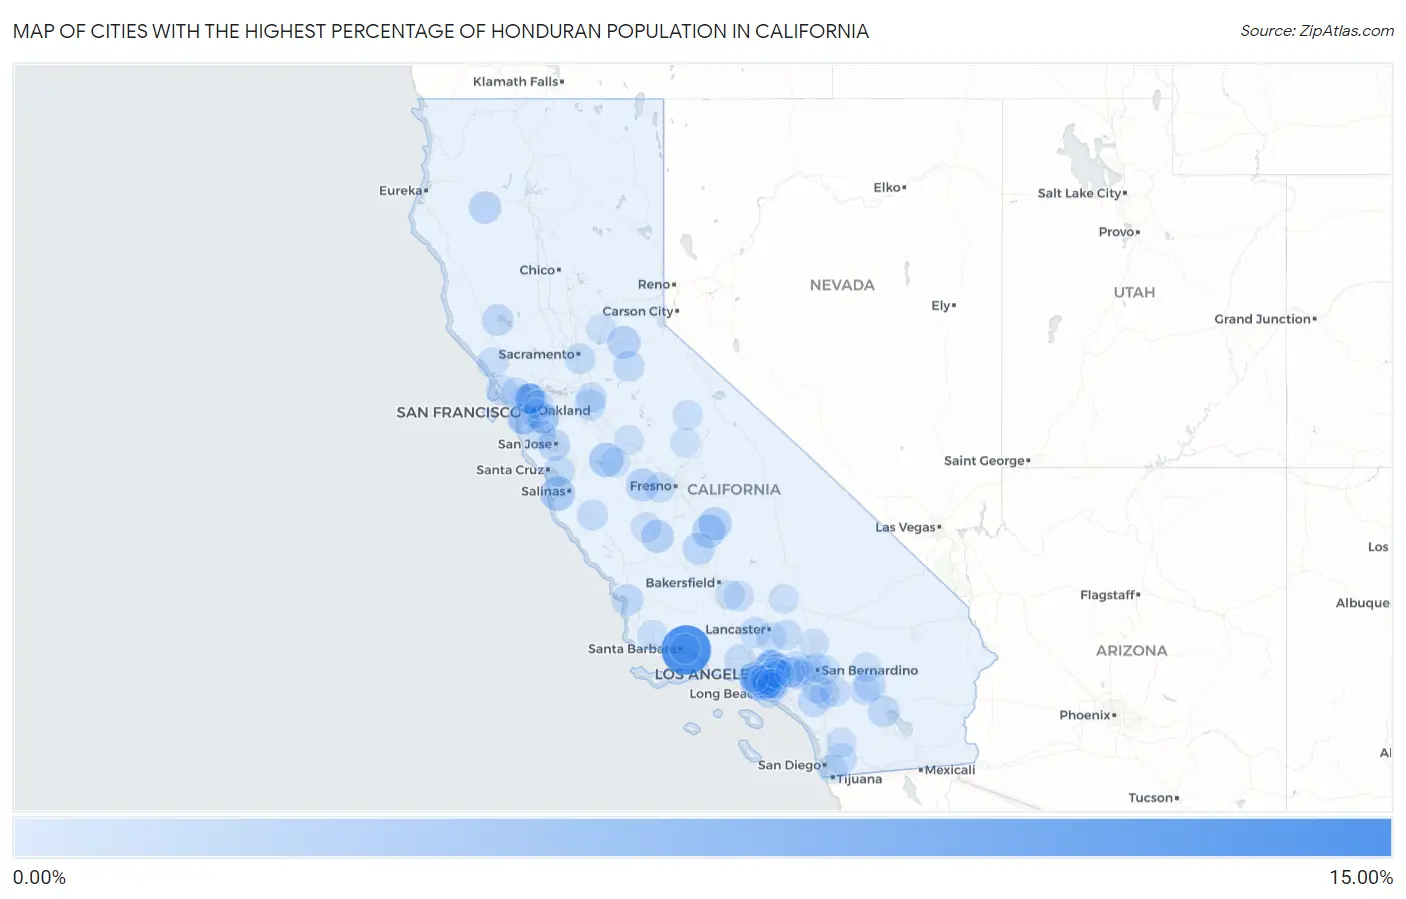
Map of Cities with the Highest Percentage of Honduran Population in California
0.00%
15.00%
Cities with the Highest Percentage of Honduran Population in California
| City | Honduran | vs State | vs National | |
| 1. | Summerland | 13.66% | 0.26%(+13.4)#1 | 0.32%(+13.3)#18 |
| 2. | East Pasadena | 3.76% | 0.26%(+3.51)#2 | 0.32%(+3.44)#213 |
| 3. | Sand City | 3.45% | 0.26%(+3.19)#3 | 0.32%(+3.13)#231 |
| 4. | Santa Nella | 3.31% | 0.26%(+3.05)#4 | 0.32%(+2.99)#252 |
| 5. | Woodville | 2.57% | 0.26%(+2.31)#5 | 0.32%(+2.25)#371 |
| 6. | Lindsay | 2.54% | 0.26%(+2.28)#6 | 0.32%(+2.21)#375 |
| 7. | Westmont | 2.51% | 0.26%(+2.25)#7 | 0.32%(+2.18)#381 |
| 8. | Mendota | 2.43% | 0.26%(+2.17)#8 | 0.32%(+2.11)#389 |
| 9. | Camino | 2.40% | 0.26%(+2.14)#9 | 0.32%(+2.07)#395 |
| 10. | Avenal | 2.35% | 0.26%(+2.10)#10 | 0.32%(+2.03)#409 |
| 11. | Colma | 2.18% | 0.26%(+1.92)#11 | 0.32%(+1.86)#445 |
| 12. | Hayfork | 1.98% | 0.26%(+1.73)#12 | 0.32%(+1.66)#488 |
| 13. | Allensworth | 1.96% | 0.26%(+1.70)#13 | 0.32%(+1.64)#489 |
| 14. | Lennox | 1.95% | 0.26%(+1.70)#14 | 0.32%(+1.63)#492 |
| 15. | Fruitdale | 1.89% | 0.26%(+1.63)#15 | 0.32%(+1.56)#504 |
| 16. | Montclair | 1.83% | 0.26%(+1.58)#16 | 0.32%(+1.51)#517 |
| 17. | Bell | 1.83% | 0.26%(+1.58)#17 | 0.32%(+1.51)#518 |
| 18. | San Pasqual | 1.76% | 0.26%(+1.50)#18 | 0.32%(+1.44)#535 |
| 19. | Huntington Park | 1.64% | 0.26%(+1.38)#19 | 0.32%(+1.32)#563 |
| 20. | Lakeport | 1.62% | 0.26%(+1.36)#20 | 0.32%(+1.29)#570 |
| 21. | Sky Valley | 1.60% | 0.26%(+1.35)#21 | 0.32%(+1.28)#577 |
| 22. | Oasis | 1.56% | 0.26%(+1.31)#22 | 0.32%(+1.24)#595 |
| 23. | North Richmond | 1.55% | 0.26%(+1.30)#23 | 0.32%(+1.23)#598 |
| 24. | Lakeland Village | 1.50% | 0.26%(+1.25)#24 | 0.32%(+1.18)#616 |
| 25. | Florence Graham | 1.47% | 0.26%(+1.21)#25 | 0.32%(+1.15)#632 |
| 26. | Lynwood | 1.45% | 0.26%(+1.20)#26 | 0.32%(+1.13)#638 |
| 27. | Grover Beach | 1.45% | 0.26%(+1.19)#27 | 0.32%(+1.13)#640 |
| 28. | West Rancho Dominguez | 1.43% | 0.26%(+1.17)#28 | 0.32%(+1.11)#652 |
| 29. | French Camp | 1.40% | 0.26%(+1.14)#29 | 0.32%(+1.08)#662 |
| 30. | South Gate | 1.31% | 0.26%(+1.05)#30 | 0.32%(+0.987)#701 |
| 31. | Red Corral | 1.26% | 0.26%(+1.00)#31 | 0.32%(+0.936)#729 |
| 32. | Santa Susana | 1.24% | 0.26%(+0.979)#32 | 0.32%(+0.914)#743 |
| 33. | Ashland | 1.22% | 0.26%(+0.960)#33 | 0.32%(+0.895)#751 |
| 34. | Lemon Hill | 1.21% | 0.26%(+0.957)#34 | 0.32%(+0.892)#755 |
| 35. | Greenfield | 1.16% | 0.26%(+0.906)#35 | 0.32%(+0.841)#778 |
| 36. | Willowbrook | 1.12% | 0.26%(+0.867)#36 | 0.32%(+0.802)#807 |
| 37. | East Rancho Dominguez | 1.08% | 0.26%(+0.821)#37 | 0.32%(+0.756)#840 |
| 38. | Crest | 1.07% | 0.26%(+0.812)#38 | 0.32%(+0.747)#846 |
| 39. | San Antonio Heights | 1.03% | 0.26%(+0.774)#39 | 0.32%(+0.710)#872 |
| 40. | Aptos Hills Larkin Valley | 1.03% | 0.26%(+0.773)#40 | 0.32%(+0.708)#873 |
| 41. | Elizabeth Lake | 1.02% | 0.26%(+0.763)#41 | 0.32%(+0.698)#881 |
| 42. | Bell Gardens | 1.00% | 0.26%(+0.741)#42 | 0.32%(+0.676)#896 |
| 43. | Long Beach | 0.97% | 0.26%(+0.710)#43 | 0.32%(+0.645)#917 |
| 44. | Inverness | 0.95% | 0.26%(+0.695)#44 | 0.32%(+0.630)#928 |
| 45. | Rollingwood | 0.95% | 0.26%(+0.690)#45 | 0.32%(+0.625)#933 |
| 46. | Pasadena | 0.94% | 0.26%(+0.686)#46 | 0.32%(+0.621)#937 |
| 47. | Monte Rio | 0.91% | 0.26%(+0.650)#47 | 0.32%(+0.585)#954 |
| 48. | Cherryland | 0.88% | 0.26%(+0.620)#48 | 0.32%(+0.555)#973 |
| 49. | Kerman | 0.87% | 0.26%(+0.612)#49 | 0.32%(+0.547)#981 |
| 50. | Coalinga | 0.85% | 0.26%(+0.589)#50 | 0.32%(+0.524)#1,006 |
| 51. | August | 0.84% | 0.26%(+0.578)#51 | 0.32%(+0.514)#1,016 |
| 52. | San Jacinto | 0.84% | 0.26%(+0.578)#52 | 0.32%(+0.513)#1,017 |
| 53. | San Pablo | 0.82% | 0.26%(+0.567)#53 | 0.32%(+0.502)#1,035 |
| 54. | Palmdale | 0.82% | 0.26%(+0.558)#54 | 0.32%(+0.493)#1,046 |
| 55. | South Monrovia Island | 0.80% | 0.26%(+0.547)#55 | 0.32%(+0.482)#1,057 |
| 56. | Romoland | 0.80% | 0.26%(+0.546)#56 | 0.32%(+0.481)#1,059 |
| 57. | Lawndale | 0.80% | 0.26%(+0.544)#57 | 0.32%(+0.479)#1,062 |
| 58. | Lake Los Angeles | 0.79% | 0.26%(+0.536)#58 | 0.32%(+0.471)#1,067 |
| 59. | Richmond | 0.79% | 0.26%(+0.528)#59 | 0.32%(+0.463)#1,073 |
| 60. | Daly City | 0.78% | 0.26%(+0.523)#60 | 0.32%(+0.458)#1,075 |
| 61. | Compton | 0.78% | 0.26%(+0.517)#61 | 0.32%(+0.452)#1,083 |
| 62. | Bear Valley Springs | 0.77% | 0.26%(+0.510)#62 | 0.32%(+0.445)#1,090 |
| 63. | Los Angeles | 0.75% | 0.26%(+0.492)#63 | 0.32%(+0.427)#1,112 |
| 64. | Lucas Valley Marinwood | 0.73% | 0.26%(+0.469)#64 | 0.32%(+0.404)#1,143 |
| 65. | Maywood | 0.72% | 0.26%(+0.462)#65 | 0.32%(+0.397)#1,155 |
| 66. | La Mirada | 0.69% | 0.26%(+0.435)#66 | 0.32%(+0.370)#1,192 |
| 67. | Yosemite Valley | 0.69% | 0.26%(+0.433)#67 | 0.32%(+0.368)#1,195 |
| 68. | Ontario | 0.67% | 0.26%(+0.417)#68 | 0.32%(+0.352)#1,216 |
| 69. | Buellton | 0.66% | 0.26%(+0.402)#69 | 0.32%(+0.337)#1,239 |
| 70. | La Puente | 0.64% | 0.26%(+0.387)#70 | 0.32%(+0.322)#1,259 |
| 71. | Fontana | 0.63% | 0.26%(+0.376)#71 | 0.32%(+0.311)#1,273 |
| 72. | Walnut Park | 0.59% | 0.26%(+0.335)#72 | 0.32%(+0.270)#1,326 |
| 73. | Inglewood | 0.59% | 0.26%(+0.327)#73 | 0.32%(+0.263)#1,341 |
| 74. | Cathedral City | 0.57% | 0.26%(+0.312)#74 | 0.32%(+0.247)#1,371 |
| 75. | Winton | 0.56% | 0.26%(+0.301)#75 | 0.32%(+0.236)#1,394 |
| 76. | Mead Valley | 0.56% | 0.26%(+0.301)#76 | 0.32%(+0.236)#1,395 |
| 77. | Montecito | 0.55% | 0.26%(+0.293)#77 | 0.32%(+0.228)#1,409 |
| 78. | Mountain View Acres | 0.55% | 0.26%(+0.292)#78 | 0.32%(+0.227)#1,411 |
| 79. | Highland | 0.55% | 0.26%(+0.292)#79 | 0.32%(+0.227)#1,414 |
| 80. | Arvin | 0.55% | 0.26%(+0.288)#80 | 0.32%(+0.223)#1,418 |
| 81. | Los Banos | 0.53% | 0.26%(+0.276)#81 | 0.32%(+0.211)#1,433 |
| 82. | West Puente Valley | 0.53% | 0.26%(+0.272)#82 | 0.32%(+0.207)#1,439 |
| 83. | Montebello | 0.53% | 0.26%(+0.271)#83 | 0.32%(+0.206)#1,440 |
| 84. | North Auburn | 0.52% | 0.26%(+0.263)#84 | 0.32%(+0.198)#1,454 |
| 85. | Bonita | 0.52% | 0.26%(+0.262)#85 | 0.32%(+0.197)#1,456 |
| 86. | Oakland | 0.51% | 0.26%(+0.255)#86 | 0.32%(+0.190)#1,478 |
| 87. | El Monte | 0.51% | 0.26%(+0.248)#87 | 0.32%(+0.183)#1,490 |
| 88. | California City | 0.50% | 0.26%(+0.242)#88 | 0.32%(+0.177)#1,502 |
| 89. | Lakewood | 0.48% | 0.26%(+0.226)#89 | 0.32%(+0.161)#1,528 |
| 90. | Culver City | 0.48% | 0.26%(+0.225)#90 | 0.32%(+0.161)#1,529 |
| 91. | Oakhurst | 0.48% | 0.26%(+0.222)#91 | 0.32%(+0.157)#1,536 |
| 92. | East Niles | 0.48% | 0.26%(+0.219)#92 | 0.32%(+0.154)#1,544 |
| 93. | Ramona | 0.47% | 0.26%(+0.217)#93 | 0.32%(+0.152)#1,547 |
| 94. | Paramount | 0.47% | 0.26%(+0.215)#94 | 0.32%(+0.151)#1,550 |
| 95. | San Bernardino | 0.47% | 0.26%(+0.214)#95 | 0.32%(+0.149)#1,557 |
| 96. | Norwalk | 0.46% | 0.26%(+0.203)#96 | 0.32%(+0.138)#1,581 |
| 97. | Pomona | 0.46% | 0.26%(+0.202)#97 | 0.32%(+0.137)#1,582 |
| 98. | Menlo Park | 0.46% | 0.26%(+0.201)#98 | 0.32%(+0.136)#1,584 |
| 99. | Orinda | 0.46% | 0.26%(+0.199)#99 | 0.32%(+0.134)#1,591 |
| 100. | Yucca Valley | 0.46% | 0.26%(+0.199)#100 | 0.32%(+0.134)#1,594 |
Common Questions
What are the Top 10 Cities with the Highest Percentage of Honduran Population in California?
Top 10 Cities with the Highest Percentage of Honduran Population in California are:
#1
13.66%
#2
3.76%
#3
3.45%
#4
3.31%
#5
2.57%
#6
2.54%
#7
2.51%
#8
2.43%
#9
2.40%
#10
2.35%
What city has the Highest Percentage of Honduran Population in California?
Summerland has the Highest Percentage of Honduran Population in California with 13.66%.
What is the Percentage of Honduran Population in the State of California?
Percentage of Honduran Population in California is 0.26%.
What is the Percentage of Honduran Population in the United States?
Percentage of Honduran Population in the United States is 0.32%.