Cities with the Most Immigrants from Eritrea in California
RELATED REPORTS & OPTIONS
Eritrea
California
Compare Cities
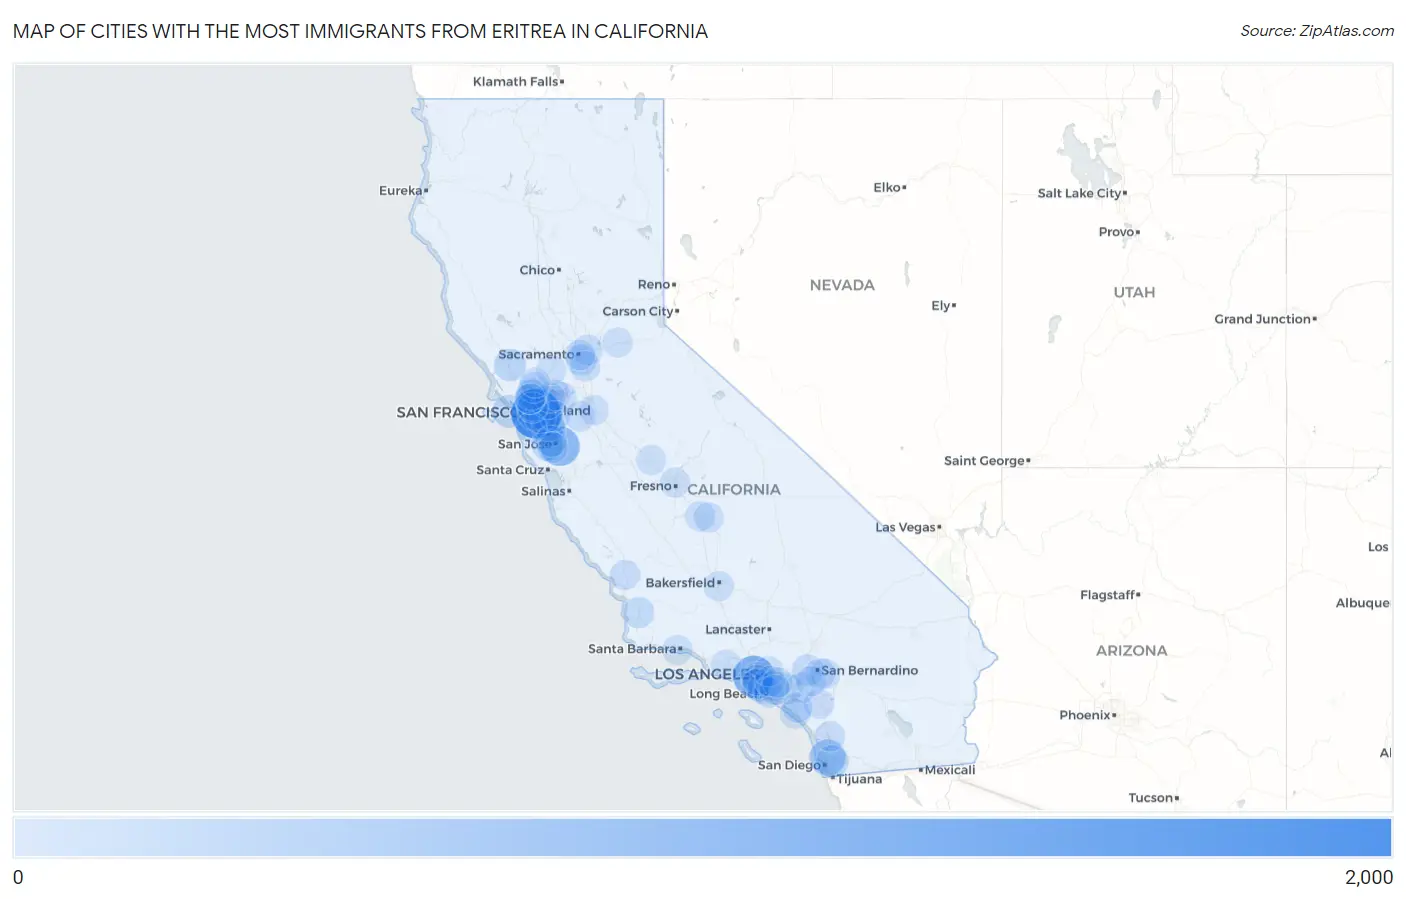
Map of Cities with the Most Immigrants from Eritrea in California
0
2,000
Cities with the Most Immigrants from Eritrea in California
| City | Eritrea | vs State | vs National | |
| 1. | Oakland | 1,707 | 7,279(23.45%)#1 | 50,543(3.38%)#3 |
| 2. | Los Angeles | 956 | 7,279(13.13%)#2 | 50,543(1.89%)#9 |
| 3. | San Jose | 802 | 7,279(11.02%)#3 | 50,543(1.59%)#12 |
| 4. | San Diego | 518 | 7,279(7.12%)#4 | 50,543(1.02%)#17 |
| 5. | Fremont | 269 | 7,279(3.70%)#5 | 50,543(0.53%)#38 |
| 6. | San Francisco | 213 | 7,279(2.93%)#6 | 50,543(0.42%)#44 |
| 7. | La Mesa | 190 | 7,279(2.61%)#7 | 50,543(0.38%)#55 |
| 8. | Union City | 187 | 7,279(2.57%)#8 | 50,543(0.37%)#57 |
| 9. | Santa Rosa | 180 | 7,279(2.47%)#9 | 50,543(0.36%)#61 |
| 10. | Castro Valley | 157 | 7,279(2.16%)#10 | 50,543(0.31%)#69 |
| 11. | Alameda | 147 | 7,279(2.02%)#11 | 50,543(0.29%)#74 |
| 12. | Cupertino | 117 | 7,279(1.61%)#12 | 50,543(0.23%)#90 |
| 13. | Anaheim | 110 | 7,279(1.51%)#13 | 50,543(0.22%)#95 |
| 14. | Berkeley | 109 | 7,279(1.50%)#14 | 50,543(0.22%)#100 |
| 15. | Fontana | 99 | 7,279(1.36%)#15 | 50,543(0.20%)#107 |
| 16. | San Leandro | 91 | 7,279(1.25%)#16 | 50,543(0.18%)#114 |
| 17. | Santa Maria | 89 | 7,279(1.22%)#17 | 50,543(0.18%)#116 |
| 18. | Santa Clara | 74 | 7,279(1.02%)#18 | 50,543(0.15%)#130 |
| 19. | Parkway | 72 | 7,279(0.99%)#19 | 50,543(0.14%)#136 |
| 20. | View Park Windsor Hills | 63 | 7,279(0.87%)#20 | 50,543(0.12%)#148 |
| 21. | Lawndale | 60 | 7,279(0.82%)#21 | 50,543(0.12%)#154 |
| 22. | Carmichael | 48 | 7,279(0.66%)#22 | 50,543(0.09%)#175 |
| 23. | Walnut Creek | 46 | 7,279(0.63%)#23 | 50,543(0.09%)#178 |
| 24. | Antioch | 45 | 7,279(0.62%)#24 | 50,543(0.09%)#181 |
| 25. | Hawthorne | 44 | 7,279(0.60%)#25 | 50,543(0.09%)#183 |
| 26. | Spring Valley Cdp San Diego County | 44 | 7,279(0.60%)#26 | 50,543(0.09%)#184 |
| 27. | Campbell | 43 | 7,279(0.59%)#27 | 50,543(0.09%)#186 |
| 28. | Hercules | 43 | 7,279(0.59%)#28 | 50,543(0.09%)#187 |
| 29. | Corona | 39 | 7,279(0.54%)#29 | 50,543(0.08%)#201 |
| 30. | Carson | 34 | 7,279(0.47%)#30 | 50,543(0.07%)#225 |
| 31. | Elk Grove | 32 | 7,279(0.44%)#31 | 50,543(0.06%)#233 |
| 32. | Richmond | 30 | 7,279(0.41%)#32 | 50,543(0.06%)#243 |
| 33. | Redlands | 30 | 7,279(0.41%)#33 | 50,543(0.06%)#244 |
| 34. | Pittsburg | 28 | 7,279(0.38%)#34 | 50,543(0.06%)#253 |
| 35. | Escondido | 26 | 7,279(0.36%)#35 | 50,543(0.05%)#261 |
| 36. | Dublin | 26 | 7,279(0.36%)#36 | 50,543(0.05%)#262 |
| 37. | Loma Linda | 24 | 7,279(0.33%)#37 | 50,543(0.05%)#269 |
| 38. | Sacramento | 23 | 7,279(0.32%)#38 | 50,543(0.05%)#272 |
| 39. | Dana Point | 23 | 7,279(0.32%)#39 | 50,543(0.05%)#276 |
| 40. | Concord | 22 | 7,279(0.30%)#40 | 50,543(0.04%)#280 |
| 41. | Inglewood | 22 | 7,279(0.30%)#41 | 50,543(0.04%)#281 |
| 42. | San Mateo | 20 | 7,279(0.27%)#42 | 50,543(0.04%)#297 |
| 43. | Wildomar | 20 | 7,279(0.27%)#43 | 50,543(0.04%)#299 |
| 44. | Atascadero | 20 | 7,279(0.27%)#44 | 50,543(0.04%)#300 |
| 45. | Ladera Ranch | 20 | 7,279(0.27%)#45 | 50,543(0.04%)#303 |
| 46. | Tracy | 19 | 7,279(0.26%)#46 | 50,543(0.04%)#305 |
| 47. | Pinole | 17 | 7,279(0.23%)#47 | 50,543(0.03%)#317 |
| 48. | Cerritos | 16 | 7,279(0.22%)#48 | 50,543(0.03%)#319 |
| 49. | Long Beach | 15 | 7,279(0.21%)#49 | 50,543(0.03%)#324 |
| 50. | Visalia | 15 | 7,279(0.21%)#50 | 50,543(0.03%)#325 |
| 51. | Vallejo | 14 | 7,279(0.19%)#51 | 50,543(0.03%)#332 |
| 52. | Riverside | 12 | 7,279(0.16%)#52 | 50,543(0.02%)#340 |
| 53. | Bakersfield | 11 | 7,279(0.15%)#53 | 50,543(0.02%)#351 |
| 54. | Thousand Oaks | 11 | 7,279(0.15%)#54 | 50,543(0.02%)#354 |
| 55. | Vacaville | 11 | 7,279(0.15%)#55 | 50,543(0.02%)#355 |
| 56. | Emeryville | 11 | 7,279(0.15%)#56 | 50,543(0.02%)#362 |
| 57. | San Pablo | 10 | 7,279(0.14%)#57 | 50,543(0.02%)#369 |
| 58. | Downey | 9 | 7,279(0.12%)#58 | 50,543(0.02%)#377 |
| 59. | Alhambra | 9 | 7,279(0.12%)#59 | 50,543(0.02%)#379 |
| 60. | Cypress | 9 | 7,279(0.12%)#60 | 50,543(0.02%)#381 |
| 61. | East Whittier | 8 | 7,279(0.11%)#61 | 50,543(0.02%)#392 |
| 62. | Fresno | 7 | 7,279(0.10%)#62 | 50,543(0.01%)#395 |
| 63. | American Canyon | 7 | 7,279(0.10%)#63 | 50,543(0.01%)#399 |
| 64. | Manteca | 6 | 7,279(0.08%)#64 | 50,543(0.01%)#404 |
| 65. | Farmersville | 6 | 7,279(0.08%)#65 | 50,543(0.01%)#406 |
| 66. | Placerville | 4 | 7,279(0.05%)#66 | 50,543(0.01%)#419 |
| 67. | Chowchilla | 2 | 7,279(0.03%)#67 | 50,543(0.00%)#431 |
| 68. | Santa Barbara | 1 | 7,279(0.01%)#68 | 50,543(0.00%)#437 |
Common Questions
What are the Top 10 Cities with the Most Immigrants from Eritrea in California?
Top 10 Cities with the Most Immigrants from Eritrea in California are:
#1
1,707
#2
956
#3
802
#4
518
#5
269
#6
213
#7
190
#8
187
#9
180
#10
157
What city has the Most Immigrants from Eritrea in California?
Oakland has the Most Immigrants from Eritrea in California with 1,707.
What is the Total Immigrants from Eritrea in the State of California?
Total Immigrants from Eritrea in California is 7,279.
What is the Total Immigrants from Eritrea in the United States?
Total Immigrants from Eritrea in the United States is 50,543.