Cities with the Highest Poverty Level Among Married Couples in California
RELATED REPORTS & OPTIONS
Highest Poverty | Married Couple
California
Compare Cities
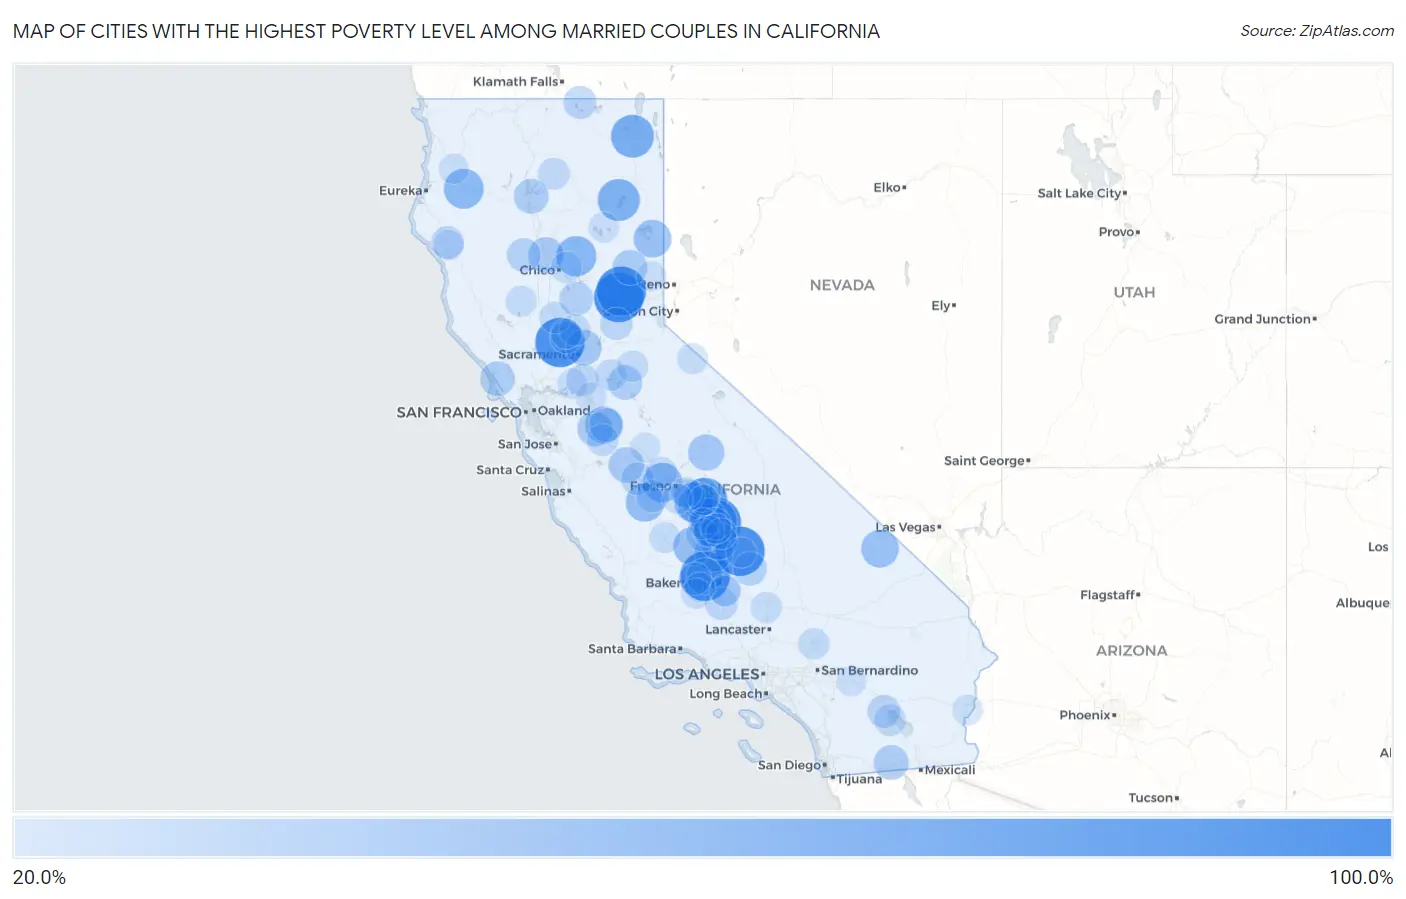
Map of Cities with the Highest Poverty Level Among Married Couples in California
0.0%
100.0%
Cities with the Highest Poverty Level Among Married Couples in California
| City | Married Couples Poverty | vs State | vs National | |
| 1. | Yolo | 100.0% | 5.1%(+94.9)#1 | 4.5%(+95.5)#19 |
| 2. | Cherokee Strip | 100.0% | 5.1%(+94.9)#2 | 4.5%(+95.5)#34 |
| 3. | Washington | 100.0% | 5.1%(+94.9)#3 | 4.5%(+95.5)#50 |
| 4. | El Rancho | 100.0% | 5.1%(+94.9)#4 | 4.5%(+95.5)#75 |
| 5. | Mcclenney Tract | 100.0% | 5.1%(+94.9)#5 | 4.5%(+95.5)#98 |
| 6. | Graniteville | 100.0% | 5.1%(+94.9)#6 | 4.5%(+95.5)#103 |
| 7. | East Orosi | 80.0% | 5.1%(+74.9)#7 | 4.5%(+75.5)#127 |
| 8. | Tonyville | 77.5% | 5.1%(+72.4)#8 | 4.5%(+73.0)#142 |
| 9. | Daphnedale Park | 73.0% | 5.1%(+67.9)#9 | 4.5%(+68.5)#156 |
| 10. | Oak Run | 72.4% | 5.1%(+67.3)#10 | 4.5%(+68.0)#160 |
| 11. | Spaulding | 69.4% | 5.1%(+64.3)#11 | 4.5%(+65.0)#169 |
| 12. | Delft Colony | 66.4% | 5.1%(+61.3)#12 | 4.5%(+61.9)#200 |
| 13. | Weitchpec | 63.6% | 5.1%(+58.5)#13 | 4.5%(+59.2)#220 |
| 14. | Stirling City | 62.1% | 5.1%(+56.9)#14 | 4.5%(+57.6)#235 |
| 15. | Edison | 61.5% | 5.1%(+56.4)#15 | 4.5%(+57.1)#246 |
| 16. | Burnt Ranch | 60.6% | 5.1%(+55.5)#16 | 4.5%(+56.1)#256 |
| 17. | Biola | 58.3% | 5.1%(+53.2)#17 | 4.5%(+53.9)#287 |
| 18. | Cantua Creek | 55.0% | 5.1%(+49.9)#18 | 4.5%(+50.5)#322 |
| 19. | Richgrove | 54.5% | 5.1%(+49.4)#19 | 4.5%(+50.0)#331 |
| 20. | Alpaugh | 54.1% | 5.1%(+49.0)#20 | 4.5%(+49.7)#335 |
| 21. | Patton Village | 51.7% | 5.1%(+46.6)#21 | 4.5%(+47.2)#361 |
| 22. | Tecopa | 51.4% | 5.1%(+46.3)#22 | 4.5%(+47.0)#364 |
| 23. | Terra Bella | 48.9% | 5.1%(+43.8)#23 | 4.5%(+44.5)#411 |
| 24. | Riverdale Park | 48.9% | 5.1%(+43.8)#24 | 4.5%(+44.4)#413 |
| 25. | Mexican Colony | 47.1% | 5.1%(+41.9)#25 | 4.5%(+42.6)#444 |
| 26. | Big Creek | 45.8% | 5.1%(+40.7)#26 | 4.5%(+41.4)#479 |
| 27. | Mcclellan Park | 44.3% | 5.1%(+39.2)#27 | 4.5%(+39.9)#505 |
| 28. | Linnell Camp | 43.9% | 5.1%(+38.8)#28 | 4.5%(+39.5)#516 |
| 29. | Vina | 43.5% | 5.1%(+38.4)#29 | 4.5%(+39.0)#523 |
| 30. | London | 43.3% | 5.1%(+38.1)#30 | 4.5%(+38.8)#530 |
| 31. | Dos Palos Y | 42.9% | 5.1%(+37.7)#31 | 4.5%(+38.4)#540 |
| 32. | Westley | 42.1% | 5.1%(+37.0)#32 | 4.5%(+37.6)#566 |
| 33. | Clio | 41.2% | 5.1%(+36.1)#33 | 4.5%(+36.7)#586 |
| 34. | Ocotillo | 40.3% | 5.1%(+35.2)#34 | 4.5%(+35.8)#611 |
| 35. | Mountain Gate | 39.9% | 5.1%(+34.7)#35 | 4.5%(+35.4)#640 |
| 36. | Tomales | 39.6% | 5.1%(+34.5)#36 | 4.5%(+35.2)#647 |
| 37. | San Andreas | 38.4% | 5.1%(+33.3)#37 | 4.5%(+34.0)#688 |
| 38. | Bret Harte | 37.0% | 5.1%(+31.8)#38 | 4.5%(+32.5)#738 |
| 39. | Honcut | 36.8% | 5.1%(+31.7)#39 | 4.5%(+32.3)#747 |
| 40. | Sultana | 36.5% | 5.1%(+31.3)#40 | 4.5%(+32.0)#755 |
| 41. | Orange Cove | 36.3% | 5.1%(+31.2)#41 | 4.5%(+31.8)#761 |
| 42. | Bodfish | 36.1% | 5.1%(+31.0)#42 | 4.5%(+31.6)#766 |
| 43. | Flournoy | 36.0% | 5.1%(+30.9)#43 | 4.5%(+31.5)#770 |
| 44. | Tulelake | 33.6% | 5.1%(+28.4)#44 | 4.5%(+29.1)#865 |
| 45. | Tipton | 32.4% | 5.1%(+27.3)#45 | 4.5%(+27.9)#921 |
| 46. | Oasis | 32.4% | 5.1%(+27.2)#46 | 4.5%(+27.9)#922 |
| 47. | Woodville Farm Labor Camp | 32.0% | 5.1%(+26.8)#47 | 4.5%(+27.5)#934 |
| 48. | Firebaugh | 31.9% | 5.1%(+26.8)#48 | 4.5%(+27.4)#937 |
| 49. | Garberville | 31.9% | 5.1%(+26.7)#49 | 4.5%(+27.4)#939 |
| 50. | Mettler | 31.6% | 5.1%(+26.5)#50 | 4.5%(+27.1)#953 |
| 51. | Foresthill | 31.5% | 5.1%(+26.3)#51 | 4.5%(+27.0)#957 |
| 52. | La Grange | 31.2% | 5.1%(+26.1)#52 | 4.5%(+26.8)#967 |
| 53. | San Joaquin | 30.7% | 5.1%(+25.6)#53 | 4.5%(+26.3)#1,000 |
| 54. | Buttonwillow | 30.7% | 5.1%(+25.6)#54 | 4.5%(+26.2)#1,002 |
| 55. | Thornton | 29.8% | 5.1%(+24.7)#55 | 4.5%(+25.3)#1,042 |
| 56. | Lindsay | 28.9% | 5.1%(+23.7)#56 | 4.5%(+24.4)#1,091 |
| 57. | Salton Sea Beach | 28.8% | 5.1%(+23.7)#57 | 4.5%(+24.4)#1,095 |
| 58. | Knights Landing | 28.8% | 5.1%(+23.7)#58 | 4.5%(+24.4)#1,096 |
| 59. | San Miguel Cdp San Luis Obispo County | 28.6% | 5.1%(+23.4)#59 | 4.5%(+24.1)#1,106 |
| 60. | Big Bend | 28.6% | 5.1%(+23.4)#60 | 4.5%(+24.1)#1,111 |
| 61. | Crows Landing | 28.3% | 5.1%(+23.1)#61 | 4.5%(+23.8)#1,138 |
| 62. | Buena Vista | 28.2% | 5.1%(+23.1)#62 | 4.5%(+23.8)#1,141 |
| 63. | Rexland Acres | 28.1% | 5.1%(+23.0)#63 | 4.5%(+23.7)#1,149 |
| 64. | Lamont | 28.0% | 5.1%(+22.9)#64 | 4.5%(+23.5)#1,173 |
| 65. | Grimes | 27.7% | 5.1%(+22.6)#65 | 4.5%(+23.2)#1,194 |
| 66. | Parlier | 27.4% | 5.1%(+22.3)#66 | 4.5%(+23.0)#1,214 |
| 67. | West Point | 27.3% | 5.1%(+22.2)#67 | 4.5%(+22.8)#1,221 |
| 68. | East Bakersfield | 27.2% | 5.1%(+22.0)#68 | 4.5%(+22.7)#1,236 |
| 69. | Parkwood | 27.0% | 5.1%(+21.9)#69 | 4.5%(+22.5)#1,246 |
| 70. | Mountain View Acres | 26.9% | 5.1%(+21.8)#70 | 4.5%(+22.5)#1,250 |
| 71. | Butte Creek Canyon | 26.7% | 5.1%(+21.6)#71 | 4.5%(+22.2)#1,266 |
| 72. | East Nicolaus | 26.7% | 5.1%(+21.5)#72 | 4.5%(+22.2)#1,271 |
| 73. | Mojave | 26.2% | 5.1%(+21.1)#73 | 4.5%(+21.8)#1,315 |
| 74. | Kettleman City | 26.0% | 5.1%(+20.9)#74 | 4.5%(+21.6)#1,327 |
| 75. | Bayview Cdp Humboldt County | 26.0% | 5.1%(+20.8)#75 | 4.5%(+21.5)#1,333 |
| 76. | Lodoga | 25.9% | 5.1%(+20.8)#76 | 4.5%(+21.5)#1,340 |
| 77. | East Tulare Villa | 25.8% | 5.1%(+20.7)#77 | 4.5%(+21.3)#1,346 |
| 78. | Walker | 25.0% | 5.1%(+19.9)#78 | 4.5%(+20.5)#1,410 |
| 79. | Weedpatch | 24.9% | 5.1%(+19.8)#79 | 4.5%(+20.4)#1,464 |
| 80. | Woodville | 24.6% | 5.1%(+19.5)#80 | 4.5%(+20.1)#1,483 |
| 81. | East Porterville | 24.6% | 5.1%(+19.4)#81 | 4.5%(+20.1)#1,487 |
| 82. | Clear Creek | 24.0% | 5.1%(+18.9)#82 | 4.5%(+19.5)#1,549 |
| 83. | Isleton | 23.9% | 5.1%(+18.8)#83 | 4.5%(+19.5)#1,558 |
| 84. | August | 23.9% | 5.1%(+18.7)#84 | 4.5%(+19.4)#1,566 |
| 85. | Ripley | 23.8% | 5.1%(+18.6)#85 | 4.5%(+19.3)#1,576 |
| 86. | Castella | 23.6% | 5.1%(+18.5)#86 | 4.5%(+19.2)#1,588 |
| 87. | Del Rey | 23.6% | 5.1%(+18.5)#87 | 4.5%(+19.2)#1,592 |
| 88. | Valley Acres | 23.2% | 5.1%(+18.1)#88 | 4.5%(+18.8)#1,636 |
| 89. | Benbow | 22.9% | 5.1%(+17.7)#89 | 4.5%(+18.4)#1,681 |
| 90. | Spring Valley Cdp Lake County | 22.8% | 5.1%(+17.7)#90 | 4.5%(+18.4)#1,683 |
| 91. | Hoopa | 22.8% | 5.1%(+17.7)#91 | 4.5%(+18.3)#1,689 |
| 92. | Robbins | 22.7% | 5.1%(+17.6)#92 | 4.5%(+18.3)#1,699 |
| 93. | Orosi | 22.6% | 5.1%(+17.5)#93 | 4.5%(+18.2)#1,709 |
| 94. | Monmouth | 22.6% | 5.1%(+17.5)#94 | 4.5%(+18.1)#1,718 |
| 95. | Tupman | 22.2% | 5.1%(+17.1)#95 | 4.5%(+17.8)#1,756 |
| 96. | Panorama Heights | 22.2% | 5.1%(+17.1)#96 | 4.5%(+17.8)#1,774 |
| 97. | Strathmore | 22.2% | 5.1%(+17.1)#97 | 4.5%(+17.7)#1,779 |
| 98. | Whitewater | 22.1% | 5.1%(+17.0)#98 | 4.5%(+17.7)#1,785 |
| 99. | Sierra Brooks | 22.1% | 5.1%(+17.0)#99 | 4.5%(+17.6)#1,791 |
| 100. | Planada | 22.1% | 5.1%(+16.9)#100 | 4.5%(+17.6)#1,794 |
Common Questions
What are the Top 10 Cities with the Highest Poverty Level Among Married Couples in California?
Top 10 Cities with the Highest Poverty Level Among Married Couples in California are:
#1
100.0%
#2
100.0%
#3
100.0%
#4
100.0%
#5
100.0%
#6
100.0%
#7
80.0%
#8
77.5%
#9
73.0%
#10
69.4%
What city has the Highest Poverty Level Among Married Couples in California?
Yolo has the Highest Poverty Level Among Married Couples in California with 100.0%.
What is the Poverty Level Among Married Couples in the State of California?
Poverty Level Among Married Couples in California is 5.1%.
What is the Poverty Level Among Married Couples in the United States?
Poverty Level Among Married Couples in the United States is 4.5%.