Cities with the Highest Percentage of Bangladeshi Population in California
RELATED REPORTS & OPTIONS
Bangladeshi
California
Compare Cities
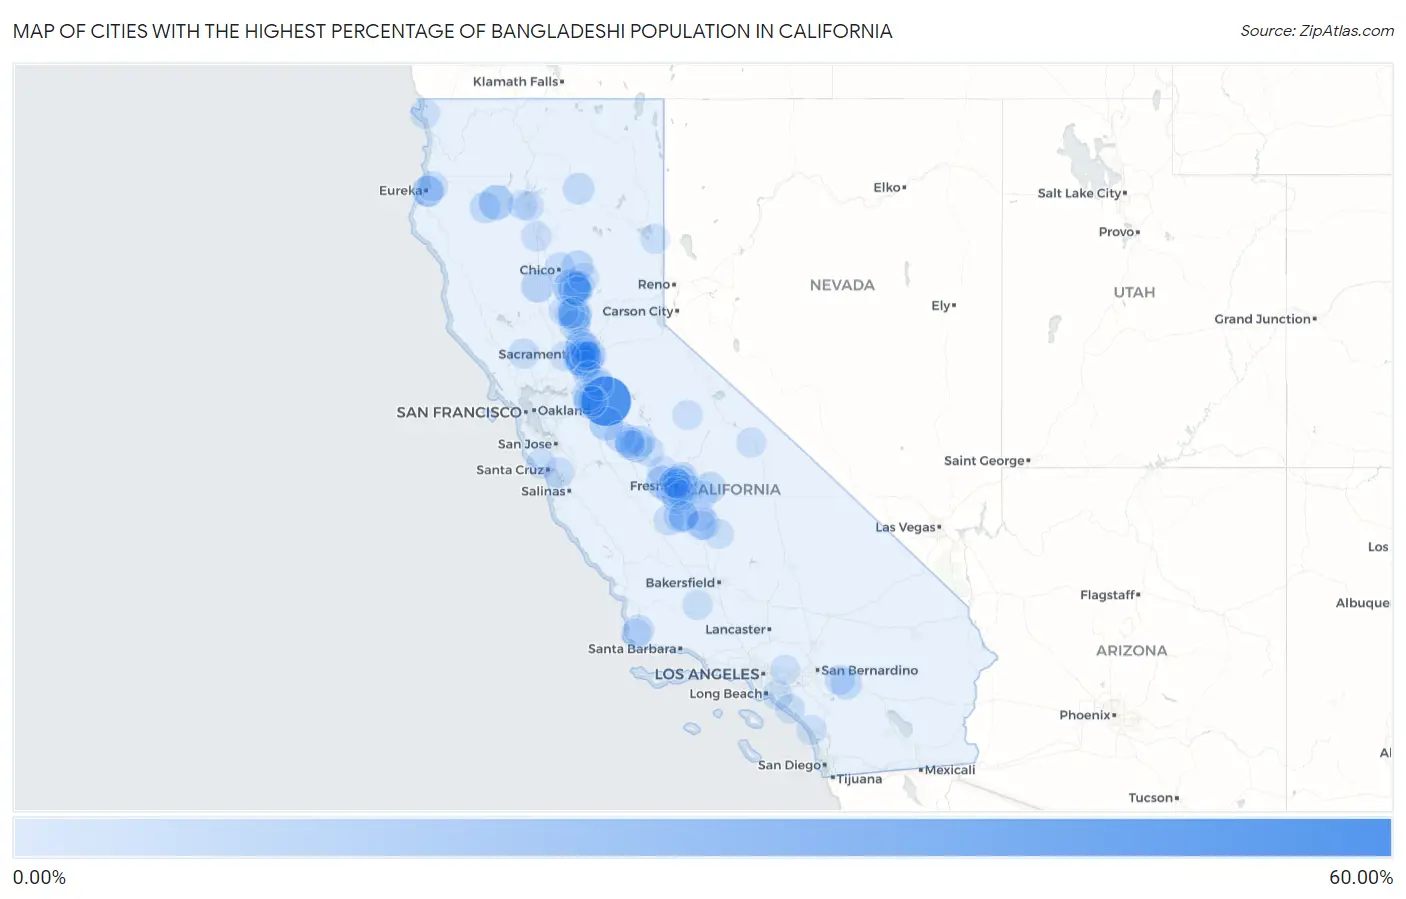
Map of Cities with the Highest Percentage of Bangladeshi Population in California
0.00%
60.00%
Cities with the Highest Percentage of Bangladeshi Population in California
| City | Bangladeshi | vs State | vs National | |
| 1. | Farmington | 53.15% | 0.28%(+52.9)#1 | 0.11%(+53.0)#3 |
| 2. | Franklin Cdp Merced County | 18.23% | 0.28%(+17.9)#2 | 0.11%(+18.1)#8 |
| 3. | Thermalito | 16.48% | 0.28%(+16.2)#3 | 0.11%(+16.4)#9 |
| 4. | Douglas City | 12.60% | 0.28%(+12.3)#4 | 0.11%(+12.5)#18 |
| 5. | Florin | 10.74% | 0.28%(+10.5)#5 | 0.11%(+10.6)#20 |
| 6. | Lemon Hill | 10.26% | 0.28%(+9.98)#6 | 0.11%(+10.2)#21 |
| 7. | Tarpey Village | 10.22% | 0.28%(+9.94)#7 | 0.11%(+10.1)#22 |
| 8. | Linda | 9.94% | 0.28%(+9.66)#8 | 0.11%(+9.84)#24 |
| 9. | Rouse | 9.77% | 0.28%(+9.49)#9 | 0.11%(+9.67)#27 |
| 10. | Biola | 8.76% | 0.28%(+8.48)#10 | 0.11%(+8.66)#32 |
| 11. | Oroville | 8.19% | 0.28%(+7.91)#11 | 0.11%(+8.09)#34 |
| 12. | West Park | 7.40% | 0.28%(+7.12)#12 | 0.11%(+7.30)#40 |
| 13. | Willows | 7.26% | 0.28%(+6.97)#13 | 0.11%(+7.15)#41 |
| 14. | South Oroville | 6.50% | 0.28%(+6.22)#14 | 0.11%(+6.40)#45 |
| 15. | Taft Mosswood | 6.38% | 0.28%(+6.10)#15 | 0.11%(+6.28)#48 |
| 16. | Olivehurst | 6.35% | 0.28%(+6.07)#16 | 0.11%(+6.25)#49 |
| 17. | Armona | 5.72% | 0.28%(+5.44)#17 | 0.11%(+5.62)#53 |
| 18. | Merced | 5.54% | 0.28%(+5.25)#18 | 0.11%(+5.43)#54 |
| 19. | East Tulare Villa | 5.34% | 0.28%(+5.05)#19 | 0.11%(+5.23)#58 |
| 20. | Concow | 5.33% | 0.28%(+5.04)#20 | 0.11%(+5.22)#59 |
| 21. | Elverta | 5.21% | 0.28%(+4.93)#21 | 0.11%(+5.11)#61 |
| 22. | Fresno | 4.97% | 0.28%(+4.68)#22 | 0.11%(+4.86)#63 |
| 23. | Bayview Cdp Humboldt County | 4.63% | 0.28%(+4.35)#23 | 0.11%(+4.53)#67 |
| 24. | Hat Creek | 4.23% | 0.28%(+3.94)#24 | 0.11%(+4.12)#72 |
| 25. | Cabazon | 4.21% | 0.28%(+3.93)#25 | 0.11%(+4.11)#73 |
| 26. | Parkway | 4.17% | 0.28%(+3.89)#26 | 0.11%(+4.07)#75 |
| 27. | Squaw Valley | 4.14% | 0.28%(+3.85)#27 | 0.11%(+4.03)#77 |
| 28. | Sunnyside | 4.12% | 0.28%(+3.83)#28 | 0.11%(+4.01)#78 |
| 29. | Hayfork | 3.90% | 0.28%(+3.62)#29 | 0.11%(+3.80)#84 |
| 30. | University Of California Merced | 3.71% | 0.28%(+3.42)#30 | 0.11%(+3.60)#90 |
| 31. | Fruitridge Pocket | 3.52% | 0.28%(+3.24)#31 | 0.11%(+3.42)#99 |
| 32. | Sacramento | 3.46% | 0.28%(+3.18)#32 | 0.11%(+3.36)#103 |
| 33. | Myrtletown | 3.30% | 0.28%(+3.01)#33 | 0.11%(+3.19)#108 |
| 34. | Eureka | 3.07% | 0.28%(+2.78)#34 | 0.11%(+2.96)#115 |
| 35. | Lincoln Village | 3.04% | 0.28%(+2.75)#35 | 0.11%(+2.93)#118 |
| 36. | Oroville East | 2.83% | 0.28%(+2.54)#36 | 0.11%(+2.72)#125 |
| 37. | Marysville | 2.77% | 0.28%(+2.48)#37 | 0.11%(+2.66)#126 |
| 38. | Rio Linda | 2.77% | 0.28%(+2.48)#38 | 0.11%(+2.66)#127 |
| 39. | Clovis | 2.65% | 0.28%(+2.36)#39 | 0.11%(+2.54)#131 |
| 40. | Vineyard | 2.57% | 0.28%(+2.29)#40 | 0.11%(+2.47)#135 |
| 41. | Plumas Lake | 2.51% | 0.28%(+2.22)#41 | 0.11%(+2.40)#138 |
| 42. | Dogtown | 2.20% | 0.28%(+1.91)#42 | 0.11%(+2.09)#160 |
| 43. | Lemoore Station | 2.19% | 0.28%(+1.90)#43 | 0.11%(+2.08)#161 |
| 44. | Delhi | 2.13% | 0.28%(+1.84)#44 | 0.11%(+2.02)#164 |
| 45. | Home Garden | 2.05% | 0.28%(+1.77)#45 | 0.11%(+1.95)#170 |
| 46. | Monmouth | 1.98% | 0.28%(+1.70)#46 | 0.11%(+1.87)#178 |
| 47. | Mission Hills | 1.97% | 0.28%(+1.68)#47 | 0.11%(+1.86)#180 |
| 48. | La Riviera | 1.94% | 0.28%(+1.65)#48 | 0.11%(+1.83)#181 |
| 49. | Angwin | 1.87% | 0.28%(+1.58)#49 | 0.11%(+1.76)#189 |
| 50. | Stockton | 1.64% | 0.28%(+1.36)#50 | 0.11%(+1.54)#205 |
| 51. | Chico | 1.64% | 0.28%(+1.35)#51 | 0.11%(+1.53)#206 |
| 52. | Bonadelle Ranchos | 1.58% | 0.28%(+1.29)#52 | 0.11%(+1.47)#213 |
| 53. | Sanger | 1.50% | 0.28%(+1.22)#53 | 0.11%(+1.40)#219 |
| 54. | Le Grand | 1.49% | 0.28%(+1.20)#54 | 0.11%(+1.38)#221 |
| 55. | Rancho Cordova | 1.46% | 0.28%(+1.17)#55 | 0.11%(+1.35)#226 |
| 56. | Winton | 1.44% | 0.28%(+1.15)#56 | 0.11%(+1.33)#229 |
| 57. | Atwater | 1.42% | 0.28%(+1.13)#57 | 0.11%(+1.31)#232 |
| 58. | Arcata | 1.41% | 0.28%(+1.12)#58 | 0.11%(+1.30)#234 |
| 59. | Elk Grove | 1.38% | 0.28%(+1.10)#59 | 0.11%(+1.28)#239 |
| 60. | Parksdale | 1.36% | 0.28%(+1.08)#60 | 0.11%(+1.25)#243 |
| 61. | Malaga | 1.33% | 0.28%(+1.04)#61 | 0.11%(+1.22)#246 |
| 62. | Madera Ranchos | 1.28% | 0.28%(+0.996)#62 | 0.11%(+1.18)#255 |
| 63. | La Selva Beach | 1.25% | 0.28%(+0.965)#63 | 0.11%(+1.14)#260 |
| 64. | Red Bluff | 1.18% | 0.28%(+0.895)#64 | 0.11%(+1.07)#272 |
| 65. | Yuba City | 1.16% | 0.28%(+0.880)#65 | 0.11%(+1.06)#274 |
| 66. | Banning | 1.14% | 0.28%(+0.855)#66 | 0.11%(+1.03)#277 |
| 67. | Berry Creek | 0.99% | 0.28%(+0.709)#67 | 0.11%(+0.889)#292 |
| 68. | Bonny Doon | 0.94% | 0.28%(+0.660)#68 | 0.11%(+0.839)#298 |
| 69. | North Highlands | 0.94% | 0.28%(+0.655)#69 | 0.11%(+0.835)#300 |
| 70. | Mather | 0.93% | 0.28%(+0.649)#70 | 0.11%(+0.829)#303 |
| 71. | Arden Arcade | 0.89% | 0.28%(+0.609)#71 | 0.11%(+0.789)#309 |
| 72. | Old Fig Garden | 0.85% | 0.28%(+0.569)#72 | 0.11%(+0.748)#317 |
| 73. | Visalia | 0.82% | 0.28%(+0.530)#73 | 0.11%(+0.710)#327 |
| 74. | Maricopa | 0.74% | 0.28%(+0.455)#74 | 0.11%(+0.634)#346 |
| 75. | Rosemont | 0.74% | 0.28%(+0.453)#75 | 0.11%(+0.633)#347 |
| 76. | Mcswain | 0.61% | 0.28%(+0.330)#76 | 0.11%(+0.510)#374 |
| 77. | Herlong | 0.55% | 0.28%(+0.262)#77 | 0.11%(+0.442)#390 |
| 78. | Galt | 0.54% | 0.28%(+0.256)#78 | 0.11%(+0.435)#392 |
| 79. | Lompoc | 0.51% | 0.28%(+0.230)#79 | 0.11%(+0.410)#400 |
| 80. | Sutter | 0.49% | 0.28%(+0.207)#80 | 0.11%(+0.386)#409 |
| 81. | Lockeford | 0.48% | 0.28%(+0.200)#81 | 0.11%(+0.380)#413 |
| 82. | Yosemite Valley | 0.46% | 0.28%(+0.176)#82 | 0.11%(+0.355)#423 |
| 83. | Orange Cove | 0.46% | 0.28%(+0.172)#83 | 0.11%(+0.351)#426 |
| 84. | Porterville | 0.45% | 0.28%(+0.163)#84 | 0.11%(+0.343)#430 |
| 85. | Fowler | 0.44% | 0.28%(+0.155)#85 | 0.11%(+0.335)#433 |
| 86. | Kennedy | 0.44% | 0.28%(+0.153)#86 | 0.11%(+0.332)#435 |
| 87. | Palermo | 0.42% | 0.28%(+0.132)#87 | 0.11%(+0.312)#446 |
| 88. | Easton | 0.41% | 0.28%(+0.123)#88 | 0.11%(+0.302)#450 |
| 89. | Tulare | 0.40% | 0.28%(+0.117)#89 | 0.11%(+0.296)#453 |
| 90. | Westminster | 0.40% | 0.28%(+0.113)#90 | 0.11%(+0.292)#454 |
| 91. | Crescent City | 0.39% | 0.28%(+0.107)#91 | 0.11%(+0.287)#461 |
| 92. | Camp Pendleton South | 0.39% | 0.28%(+0.103)#92 | 0.11%(+0.282)#467 |
| 93. | Davis | 0.37% | 0.28%(+0.083)#93 | 0.11%(+0.262)#476 |
| 94. | Shasta | 0.36% | 0.28%(+0.079)#94 | 0.11%(+0.258)#481 |
| 95. | Hanford | 0.35% | 0.28%(+0.068)#95 | 0.11%(+0.247)#490 |
| 96. | West Bishop | 0.33% | 0.28%(+0.045)#96 | 0.11%(+0.224)#506 |
| 97. | Charter Oak | 0.30% | 0.28%(+0.015)#97 | 0.11%(+0.195)#524 |
| 98. | Redding | 0.30% | 0.28%(+0.011)#98 | 0.11%(+0.191)#527 |
| 99. | Mayfair | 0.28% | 0.28%(-0.001)#99 | 0.11%(+0.178)#537 |
| 100. | Laguna Beach | 0.28% | 0.28%(-0.001)#100 | 0.11%(+0.178)#538 |
Common Questions
What are the Top 10 Cities with the Highest Percentage of Bangladeshi Population in California?
Top 10 Cities with the Highest Percentage of Bangladeshi Population in California are:
#1
53.15%
#2
16.48%
#3
12.60%
#4
10.74%
#5
10.26%
#6
10.22%
#7
9.94%
#8
9.77%
#9
8.76%
#10
8.19%
What city has the Highest Percentage of Bangladeshi Population in California?
Farmington has the Highest Percentage of Bangladeshi Population in California with 53.15%.
What is the Percentage of Bangladeshi Population in the State of California?
Percentage of Bangladeshi Population in California is 0.28%.
What is the Percentage of Bangladeshi Population in the United States?
Percentage of Bangladeshi Population in the United States is 0.11%.