Cities with the Largest Honduran Community in California
RELATED REPORTS & OPTIONS
Honduran
California
Compare Cities
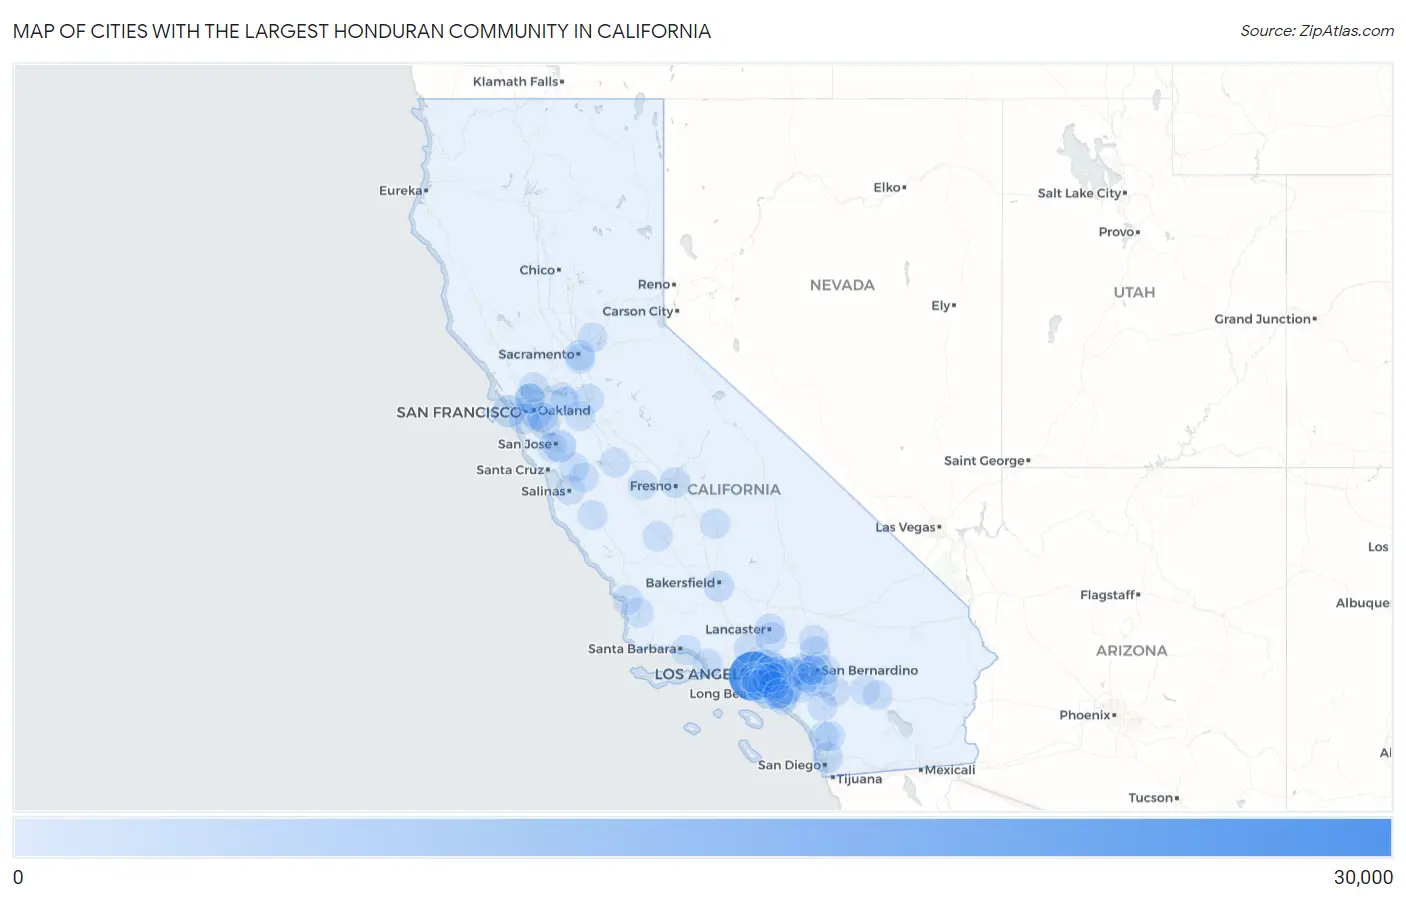
Map of Cities with the Largest Honduran Community in California
0
30,000
Cities with the Largest Honduran Community in California
| City | Honduran | vs State | vs National | |
| 1. | Los Angeles | 29,091 | 101,421(28.68%)#1 | 1,068,265(2.72%)#4 |
| 2. | Long Beach | 4,474 | 101,421(4.41%)#2 | 1,068,265(0.42%)#16 |
| 3. | San Jose | 3,301 | 101,421(3.25%)#3 | 1,068,265(0.31%)#30 |
| 4. | San Francisco | 3,132 | 101,421(3.09%)#4 | 1,068,265(0.29%)#32 |
| 5. | Oakland | 2,243 | 101,421(2.21%)#5 | 1,068,265(0.21%)#52 |
| 6. | Palmdale | 1,361 | 101,421(1.34%)#6 | 1,068,265(0.13%)#99 |
| 7. | Fontana | 1,327 | 101,421(1.31%)#7 | 1,068,265(0.12%)#103 |
| 8. | Pasadena | 1,298 | 101,421(1.28%)#8 | 1,068,265(0.12%)#107 |
| 9. | Bakersfield | 1,269 | 101,421(1.25%)#9 | 1,068,265(0.12%)#112 |
| 10. | South Gate | 1,210 | 101,421(1.19%)#10 | 1,068,265(0.11%)#118 |
| 11. | Ontario | 1,190 | 101,421(1.17%)#11 | 1,068,265(0.11%)#120 |
| 12. | San Bernardino | 1,042 | 101,421(1.03%)#12 | 1,068,265(0.10%)#141 |
| 13. | San Diego | 992 | 101,421(0.98%)#13 | 1,068,265(0.09%)#148 |
| 14. | Lynwood | 964 | 101,421(0.95%)#14 | 1,068,265(0.09%)#153 |
| 15. | Riverside | 946 | 101,421(0.93%)#15 | 1,068,265(0.09%)#157 |
| 16. | Florence Graham | 929 | 101,421(0.92%)#16 | 1,068,265(0.09%)#161 |
| 17. | Fresno | 911 | 101,421(0.90%)#17 | 1,068,265(0.09%)#164 |
| 18. | Richmond | 908 | 101,421(0.90%)#18 | 1,068,265(0.08%)#166 |
| 19. | Huntington Park | 895 | 101,421(0.88%)#19 | 1,068,265(0.08%)#167 |
| 20. | Westmont | 886 | 101,421(0.87%)#20 | 1,068,265(0.08%)#171 |
| 21. | Daly City | 809 | 101,421(0.80%)#21 | 1,068,265(0.08%)#187 |
| 22. | Anaheim | 760 | 101,421(0.75%)#22 | 1,068,265(0.07%)#203 |
| 23. | Santa Ana | 738 | 101,421(0.73%)#23 | 1,068,265(0.07%)#208 |
| 24. | Compton | 735 | 101,421(0.72%)#24 | 1,068,265(0.07%)#209 |
| 25. | Montclair | 694 | 101,421(0.68%)#25 | 1,068,265(0.06%)#220 |
| 26. | Pomona | 689 | 101,421(0.68%)#26 | 1,068,265(0.06%)#223 |
| 27. | Lancaster | 626 | 101,421(0.62%)#27 | 1,068,265(0.06%)#255 |
| 28. | Inglewood | 625 | 101,421(0.62%)#28 | 1,068,265(0.06%)#256 |
| 29. | Bell | 612 | 101,421(0.60%)#29 | 1,068,265(0.06%)#260 |
| 30. | Sacramento | 579 | 101,421(0.57%)#30 | 1,068,265(0.05%)#270 |
| 31. | El Monte | 550 | 101,421(0.54%)#31 | 1,068,265(0.05%)#283 |
| 32. | East Los Angeles | 495 | 101,421(0.49%)#32 | 1,068,265(0.05%)#312 |
| 33. | Rancho Cucamonga | 480 | 101,421(0.47%)#33 | 1,068,265(0.04%)#325 |
| 34. | Norwalk | 469 | 101,421(0.46%)#34 | 1,068,265(0.04%)#335 |
| 35. | Santa Clarita | 463 | 101,421(0.46%)#35 | 1,068,265(0.04%)#340 |
| 36. | Hayward | 456 | 101,421(0.45%)#36 | 1,068,265(0.04%)#346 |
| 37. | San Jacinto | 452 | 101,421(0.45%)#37 | 1,068,265(0.04%)#351 |
| 38. | Stockton | 429 | 101,421(0.42%)#38 | 1,068,265(0.04%)#379 |
| 39. | Hesperia | 423 | 101,421(0.42%)#39 | 1,068,265(0.04%)#381 |
| 40. | Lennox | 404 | 101,421(0.40%)#40 | 1,068,265(0.04%)#407 |
| 41. | Lakewood | 394 | 101,421(0.39%)#41 | 1,068,265(0.04%)#418 |
| 42. | Bell Gardens | 392 | 101,421(0.39%)#42 | 1,068,265(0.04%)#420 |
| 43. | West Covina | 380 | 101,421(0.37%)#43 | 1,068,265(0.04%)#432 |
| 44. | Victorville | 368 | 101,421(0.36%)#44 | 1,068,265(0.03%)#443 |
| 45. | Moreno Valley | 366 | 101,421(0.36%)#45 | 1,068,265(0.03%)#446 |
| 46. | Salinas | 358 | 101,421(0.35%)#46 | 1,068,265(0.03%)#456 |
| 47. | Carson | 356 | 101,421(0.35%)#47 | 1,068,265(0.03%)#458 |
| 48. | Downey | 345 | 101,421(0.34%)#48 | 1,068,265(0.03%)#467 |
| 49. | Antioch | 335 | 101,421(0.33%)#49 | 1,068,265(0.03%)#480 |
| 50. | Orange | 331 | 101,421(0.33%)#50 | 1,068,265(0.03%)#486 |
| 51. | La Mirada | 330 | 101,421(0.33%)#51 | 1,068,265(0.03%)#488 |
| 52. | Montebello | 328 | 101,421(0.32%)#52 | 1,068,265(0.03%)#491 |
| 53. | Lindsay | 319 | 101,421(0.31%)#53 | 1,068,265(0.03%)#500 |
| 54. | San Marcos | 317 | 101,421(0.31%)#54 | 1,068,265(0.03%)#503 |
| 55. | West Rancho Dominguez | 317 | 101,421(0.31%)#55 | 1,068,265(0.03%)#505 |
| 56. | Avenal | 316 | 101,421(0.31%)#56 | 1,068,265(0.03%)#507 |
| 57. | Highland | 312 | 101,421(0.31%)#57 | 1,068,265(0.03%)#513 |
| 58. | Mendota | 306 | 101,421(0.30%)#58 | 1,068,265(0.03%)#517 |
| 59. | Santa Maria | 299 | 101,421(0.29%)#59 | 1,068,265(0.03%)#528 |
| 60. | Cathedral City | 296 | 101,421(0.29%)#60 | 1,068,265(0.03%)#535 |
| 61. | Glendale | 294 | 101,421(0.29%)#61 | 1,068,265(0.03%)#536 |
| 62. | Bellflower | 293 | 101,421(0.29%)#62 | 1,068,265(0.03%)#538 |
| 63. | Whittier | 287 | 101,421(0.28%)#63 | 1,068,265(0.03%)#544 |
| 64. | Ashland | 282 | 101,421(0.28%)#64 | 1,068,265(0.03%)#548 |
| 65. | Corona | 267 | 101,421(0.26%)#65 | 1,068,265(0.02%)#569 |
| 66. | Hawthorne | 266 | 101,421(0.26%)#66 | 1,068,265(0.02%)#572 |
| 67. | San Pablo | 263 | 101,421(0.26%)#67 | 1,068,265(0.02%)#576 |
| 68. | Lawndale | 253 | 101,421(0.25%)#68 | 1,068,265(0.02%)#603 |
| 69. | Willowbrook | 253 | 101,421(0.25%)#69 | 1,068,265(0.02%)#604 |
| 70. | Paramount | 252 | 101,421(0.25%)#70 | 1,068,265(0.02%)#607 |
| 71. | Escondido | 247 | 101,421(0.24%)#71 | 1,068,265(0.02%)#616 |
| 72. | La Puente | 244 | 101,421(0.24%)#72 | 1,068,265(0.02%)#621 |
| 73. | Tracy | 243 | 101,421(0.24%)#73 | 1,068,265(0.02%)#622 |
| 74. | Los Banos | 243 | 101,421(0.24%)#74 | 1,068,265(0.02%)#623 |
| 75. | Baldwin Park | 235 | 101,421(0.23%)#75 | 1,068,265(0.02%)#635 |
| 76. | Gilroy | 235 | 101,421(0.23%)#76 | 1,068,265(0.02%)#636 |
| 77. | Jurupa Valley | 231 | 101,421(0.23%)#77 | 1,068,265(0.02%)#644 |
| 78. | Indio | 226 | 101,421(0.22%)#78 | 1,068,265(0.02%)#651 |
| 79. | Westminster | 221 | 101,421(0.22%)#79 | 1,068,265(0.02%)#664 |
| 80. | Greenfield | 221 | 101,421(0.22%)#80 | 1,068,265(0.02%)#666 |
| 81. | Gardena | 207 | 101,421(0.20%)#81 | 1,068,265(0.02%)#702 |
| 82. | East Pasadena | 206 | 101,421(0.20%)#82 | 1,068,265(0.02%)#710 |
| 83. | Alhambra | 205 | 101,421(0.20%)#83 | 1,068,265(0.02%)#711 |
| 84. | Rialto | 201 | 101,421(0.20%)#84 | 1,068,265(0.02%)#716 |
| 85. | Vallejo | 199 | 101,421(0.20%)#85 | 1,068,265(0.02%)#722 |
| 86. | Culver City | 195 | 101,421(0.19%)#86 | 1,068,265(0.02%)#736 |
| 87. | Pico Rivera | 192 | 101,421(0.19%)#87 | 1,068,265(0.02%)#743 |
| 88. | Cerritos | 191 | 101,421(0.19%)#88 | 1,068,265(0.02%)#746 |
| 89. | Murrieta | 187 | 101,421(0.18%)#89 | 1,068,265(0.02%)#759 |
| 90. | Campbell | 187 | 101,421(0.18%)#90 | 1,068,265(0.02%)#761 |
| 91. | Costa Mesa | 185 | 101,421(0.18%)#91 | 1,068,265(0.02%)#768 |
| 92. | Grover Beach | 185 | 101,421(0.18%)#92 | 1,068,265(0.02%)#771 |
| 93. | Brentwood | 182 | 101,421(0.18%)#93 | 1,068,265(0.02%)#778 |
| 94. | Hollister | 180 | 101,421(0.18%)#94 | 1,068,265(0.02%)#787 |
| 95. | Maywood | 180 | 101,421(0.18%)#95 | 1,068,265(0.02%)#789 |
| 96. | Lemon Hill | 180 | 101,421(0.18%)#96 | 1,068,265(0.02%)#792 |
| 97. | Rocklin | 179 | 101,421(0.18%)#97 | 1,068,265(0.02%)#796 |
| 98. | Summerland | 174 | 101,421(0.17%)#98 | 1,068,265(0.02%)#825 |
| 99. | Oxnard | 173 | 101,421(0.17%)#99 | 1,068,265(0.02%)#826 |
| 100. | Garden Grove | 168 | 101,421(0.17%)#100 | 1,068,265(0.02%)#841 |
Common Questions
What are the Top 10 Cities with the Largest Honduran Community in California?
Top 10 Cities with the Largest Honduran Community in California are:
#1
29,091
#2
4,474
#3
3,301
#4
3,132
#5
2,243
#6
1,361
#7
1,327
#8
1,298
#9
1,269
#10
1,210
What city has the Largest Honduran Community in California?
Los Angeles has the Largest Honduran Community in California with 29,091.
What is the Total Honduran Population in the State of California?
Total Honduran Population in California is 101,421.
What is the Total Honduran Population in the United States?
Total Honduran Population in the United States is 1,068,265.