Cities with the Highest Percentage of Federal Government Employees in California
RELATED REPORTS & OPTIONS
Federal Government Employees
California
Compare Cities
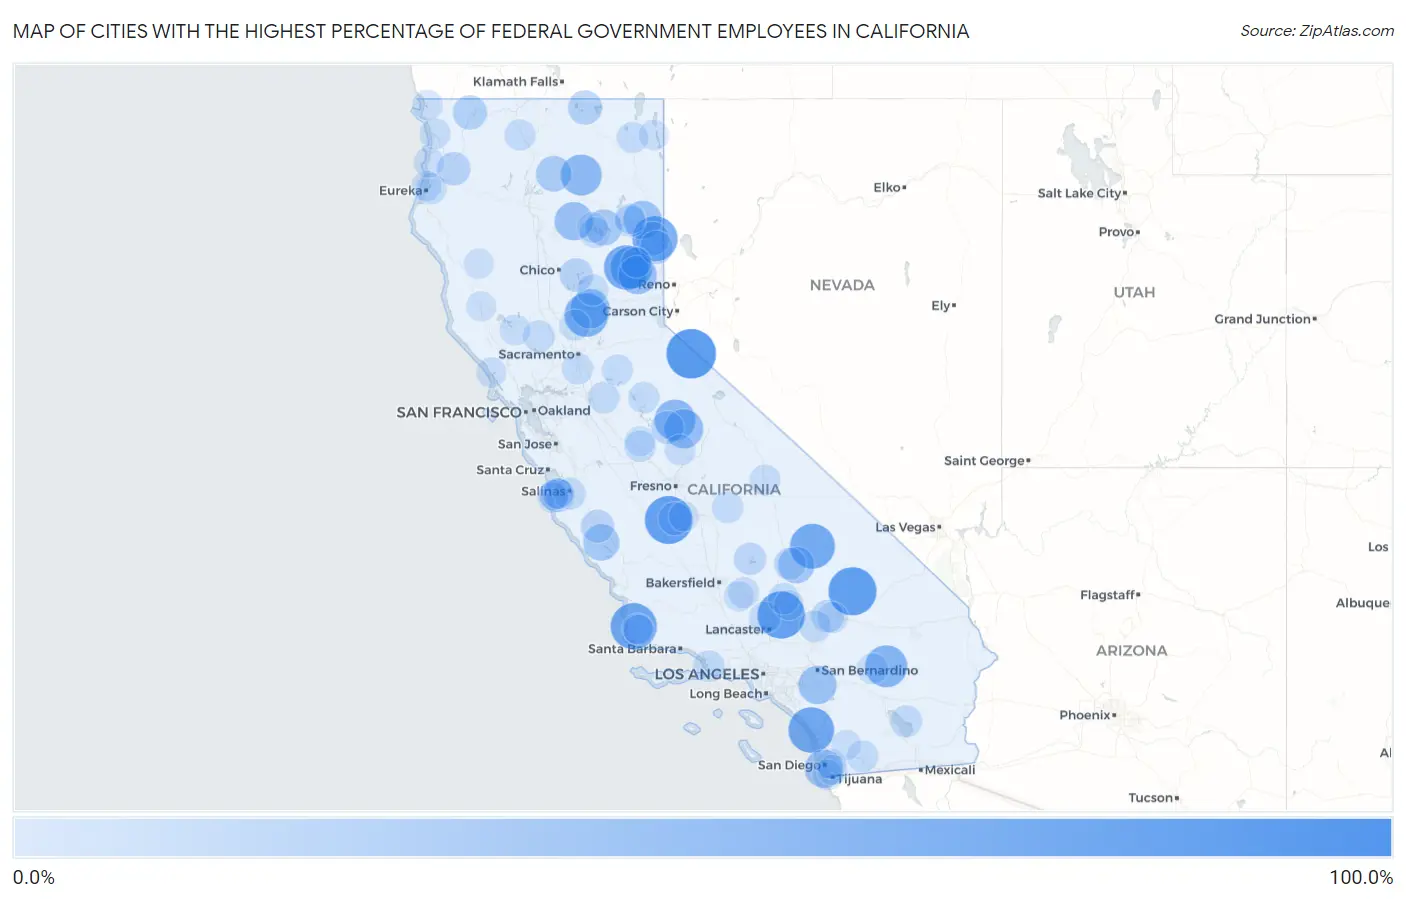
Map of Cities with the Highest Percentage of Federal Government Employees in California
0.0%
100.0%
Cities with the Highest Percentage of Federal Government Employees in California
| City | % Federal Government Employees | vs State | vs National | |
| 1. | Tancred | 100.0% | 2.8%(+97.2)#1 | 3.4%(+96.6)#12 |
| 2. | Franklin Cdp Sacramento County | 100.0% | 2.8%(+97.2)#2 | 3.4%(+96.6)#15 |
| 3. | Fort Hunter Liggett | 99.5% | 2.8%(+96.7)#3 | 3.4%(+96.2)#21 |
| 4. | Camp Pendleton Mainside | 93.8% | 2.8%(+90.9)#4 | 3.4%(+90.4)#26 |
| 5. | Coleville | 90.9% | 2.8%(+88.1)#5 | 3.4%(+87.5)#28 |
| 6. | El Centro Naval Air Facility | 90.8% | 2.8%(+88.0)#6 | 3.4%(+87.4)#30 |
| 7. | Fort Irwin | 84.5% | 2.8%(+81.7)#7 | 3.4%(+81.1)#50 |
| 8. | Lemoore Station | 83.7% | 2.8%(+80.9)#8 | 3.4%(+80.4)#55 |
| 9. | Edwards Afb | 81.7% | 2.8%(+78.9)#9 | 3.4%(+78.3)#62 |
| 10. | Petaluma Center | 80.9% | 2.8%(+78.1)#10 | 3.4%(+77.6)#65 |
| 11. | Vandenberg Afb | 76.7% | 2.8%(+73.8)#11 | 3.4%(+73.3)#82 |
| 12. | Camp Pendleton South | 74.7% | 2.8%(+71.9)#12 | 3.4%(+71.3)#87 |
| 13. | Herlong | 71.8% | 2.8%(+69.0)#13 | 3.4%(+68.5)#102 |
| 14. | Homewood Canyon | 71.0% | 2.8%(+68.2)#14 | 3.4%(+67.6)#105 |
| 15. | Graeagle | 69.9% | 2.8%(+67.1)#15 | 3.4%(+66.5)#108 |
| 16. | Beale Afb | 65.6% | 2.8%(+62.8)#16 | 3.4%(+62.2)#116 |
| 17. | C Road | 60.0% | 2.8%(+57.2)#17 | 3.4%(+56.6)#128 |
| 18. | Twentynine Palms | 58.9% | 2.8%(+56.1)#18 | 3.4%(+55.6)#133 |
| 19. | Fall River Mills | 54.2% | 2.8%(+51.4)#19 | 3.4%(+50.8)#153 |
| 20. | El Portal | 53.8% | 2.8%(+51.0)#20 | 3.4%(+50.5)#155 |
| 21. | Smartsville | 47.9% | 2.8%(+45.1)#21 | 3.4%(+44.5)#192 |
| 22. | Wawona | 47.0% | 2.8%(+44.2)#22 | 3.4%(+43.6)#195 |
| 23. | Calpine | 43.8% | 2.8%(+40.9)#23 | 3.4%(+40.4)#218 |
| 24. | Mineral | 43.8% | 2.8%(+40.9)#24 | 3.4%(+40.4)#219 |
| 25. | Litchfield | 43.3% | 2.8%(+40.5)#25 | 3.4%(+39.9)#220 |
| 26. | Coronado | 43.0% | 2.8%(+40.2)#26 | 3.4%(+39.7)#222 |
| 27. | March Arb | 42.9% | 2.8%(+40.0)#27 | 3.4%(+39.5)#223 |
| 28. | Mountain Meadows | 40.8% | 2.8%(+38.0)#28 | 3.4%(+37.4)#243 |
| 29. | Ridgecrest | 36.8% | 2.8%(+34.0)#29 | 3.4%(+33.4)#278 |
| 30. | Lockwood | 35.1% | 2.8%(+32.3)#30 | 3.4%(+31.7)#294 |
| 31. | Clear Creek | 34.6% | 2.8%(+31.8)#31 | 3.4%(+31.2)#304 |
| 32. | Big Bend | 31.8% | 2.8%(+29.0)#32 | 3.4%(+28.4)#368 |
| 33. | Monterey | 27.7% | 2.8%(+24.8)#33 | 3.4%(+24.3)#462 |
| 34. | Happy Camp | 27.0% | 2.8%(+24.2)#34 | 3.4%(+23.6)#486 |
| 35. | Newell | 26.4% | 2.8%(+23.6)#35 | 3.4%(+23.0)#507 |
| 36. | Patton Village | 25.1% | 2.8%(+22.3)#36 | 3.4%(+21.8)#556 |
| 37. | Doyle | 23.5% | 2.8%(+20.7)#37 | 3.4%(+20.1)#633 |
| 38. | Hoopa | 23.3% | 2.8%(+20.5)#38 | 3.4%(+19.9)#644 |
| 39. | Cherokee | 23.3% | 2.8%(+20.4)#39 | 3.4%(+19.9)#650 |
| 40. | Ridgecrest Heights | 22.7% | 2.8%(+19.9)#40 | 3.4%(+19.3)#673 |
| 41. | Lemoore | 22.5% | 2.8%(+19.7)#41 | 3.4%(+19.1)#693 |
| 42. | Pine Canyon | 22.2% | 2.8%(+19.4)#42 | 3.4%(+18.8)#714 |
| 43. | Midpines | 21.3% | 2.8%(+18.5)#43 | 3.4%(+17.9)#766 |
| 44. | Lenwood | 19.4% | 2.8%(+16.6)#44 | 3.4%(+16.0)#879 |
| 45. | Wofford Heights | 18.4% | 2.8%(+15.6)#45 | 3.4%(+15.1)#959 |
| 46. | China Lake Acres | 17.3% | 2.8%(+14.5)#46 | 3.4%(+13.9)#1,048 |
| 47. | Bombay Beach | 16.7% | 2.8%(+13.9)#47 | 3.4%(+13.3)#1,098 |
| 48. | Weitchpec | 16.7% | 2.8%(+13.9)#48 | 3.4%(+13.3)#1,103 |
| 49. | Silver Lakes | 16.6% | 2.8%(+13.7)#49 | 3.4%(+13.2)#1,117 |
| 50. | Rosamond | 16.5% | 2.8%(+13.7)#50 | 3.4%(+13.1)#1,121 |
| 51. | Port Hueneme | 16.1% | 2.8%(+13.3)#51 | 3.4%(+12.7)#1,160 |
| 52. | Guinda | 16.0% | 2.8%(+13.2)#52 | 3.4%(+12.6)#1,182 |
| 53. | Peters | 15.9% | 2.8%(+13.1)#53 | 3.4%(+12.6)#1,188 |
| 54. | Pine Valley | 15.9% | 2.8%(+13.1)#54 | 3.4%(+12.5)#1,195 |
| 55. | Spreckels | 15.9% | 2.8%(+13.1)#55 | 3.4%(+12.5)#1,196 |
| 56. | Bear Creek | 15.3% | 2.8%(+12.5)#56 | 3.4%(+11.9)#1,263 |
| 57. | California City | 15.3% | 2.8%(+12.4)#57 | 3.4%(+11.9)#1,266 |
| 58. | Three Rivers | 15.0% | 2.8%(+12.2)#58 | 3.4%(+11.7)#1,289 |
| 59. | Johnstonville | 15.0% | 2.8%(+12.2)#59 | 3.4%(+11.6)#1,292 |
| 60. | East Sonora | 14.8% | 2.8%(+12.0)#60 | 3.4%(+11.4)#1,323 |
| 61. | Hood | 14.7% | 2.8%(+11.9)#61 | 3.4%(+11.3)#1,336 |
| 62. | Challenge Brownsville | 14.6% | 2.8%(+11.8)#62 | 3.4%(+11.3)#1,341 |
| 63. | Alturas | 14.5% | 2.8%(+11.7)#63 | 3.4%(+11.1)#1,360 |
| 64. | Gazelle | 14.3% | 2.8%(+11.5)#64 | 3.4%(+10.9)#1,383 |
| 65. | Martell | 14.2% | 2.8%(+11.4)#65 | 3.4%(+10.8)#1,407 |
| 66. | Indianola | 13.8% | 2.8%(+11.0)#66 | 3.4%(+10.4)#1,462 |
| 67. | Joshua Tree | 13.7% | 2.8%(+10.9)#67 | 3.4%(+10.3)#1,477 |
| 68. | Barstow | 13.5% | 2.8%(+10.7)#68 | 3.4%(+10.2)#1,499 |
| 69. | Independence | 13.2% | 2.8%(+10.4)#69 | 3.4%(+9.85)#1,545 |
| 70. | Lake Almanor West | 13.2% | 2.8%(+10.3)#70 | 3.4%(+9.78)#1,556 |
| 71. | Klamath | 13.1% | 2.8%(+10.3)#71 | 3.4%(+9.70)#1,571 |
| 72. | Lower Lake | 12.8% | 2.8%(+9.96)#72 | 3.4%(+9.39)#1,615 |
| 73. | Coarsegold | 12.7% | 2.8%(+9.92)#73 | 3.4%(+9.36)#1,621 |
| 74. | Plumas Lake | 12.6% | 2.8%(+9.79)#74 | 3.4%(+9.22)#1,641 |
| 75. | Keene | 12.6% | 2.8%(+9.75)#75 | 3.4%(+9.19)#1,646 |
| 76. | Chester | 12.2% | 2.8%(+9.36)#76 | 3.4%(+8.79)#1,726 |
| 77. | Del Monte Forest | 11.9% | 2.8%(+9.12)#77 | 3.4%(+8.55)#1,767 |
| 78. | Seaside | 11.7% | 2.8%(+8.85)#78 | 3.4%(+8.29)#1,826 |
| 79. | Spring Valley Cdp Lake County | 11.6% | 2.8%(+8.74)#79 | 3.4%(+8.18)#1,848 |
| 80. | Smith River | 11.2% | 2.8%(+8.44)#80 | 3.4%(+7.87)#1,913 |
| 81. | Vandenberg Village | 11.2% | 2.8%(+8.43)#81 | 3.4%(+7.86)#1,915 |
| 82. | Susanville | 11.2% | 2.8%(+8.36)#82 | 3.4%(+7.79)#1,923 |
| 83. | Manila | 11.1% | 2.8%(+8.30)#83 | 3.4%(+7.73)#1,934 |
| 84. | Imperial Beach | 11.1% | 2.8%(+8.30)#84 | 3.4%(+7.73)#1,954 |
| 85. | Bodega Bay | 10.8% | 2.8%(+8.02)#85 | 3.4%(+7.45)#2,002 |
| 86. | Big Lagoon | 10.8% | 2.8%(+8.00)#86 | 3.4%(+7.43)#2,007 |
| 87. | Bear Valley Springs | 10.8% | 2.8%(+7.97)#87 | 3.4%(+7.40)#2,016 |
| 88. | Portola | 10.7% | 2.8%(+7.92)#88 | 3.4%(+7.35)#2,029 |
| 89. | Sand City | 10.7% | 2.8%(+7.88)#89 | 3.4%(+7.32)#2,038 |
| 90. | San Diego Country Estates | 10.7% | 2.8%(+7.85)#90 | 3.4%(+7.29)#2,041 |
| 91. | Mission Hills | 10.6% | 2.8%(+7.84)#91 | 3.4%(+7.27)#2,047 |
| 92. | Cedarville | 10.5% | 2.8%(+7.70)#92 | 3.4%(+7.13)#2,082 |
| 93. | Pacific Grove | 10.4% | 2.8%(+7.64)#93 | 3.4%(+7.07)#2,090 |
| 94. | Covelo | 10.4% | 2.8%(+7.57)#94 | 3.4%(+7.00)#2,108 |
| 95. | Chula Vista | 10.3% | 2.8%(+7.54)#95 | 3.4%(+6.97)#2,116 |
| 96. | North Edwards | 10.3% | 2.8%(+7.48)#96 | 3.4%(+6.91)#2,131 |
| 97. | University Of California Merced | 10.2% | 2.8%(+7.41)#97 | 3.4%(+6.84)#2,152 |
| 98. | Calpella | 10.1% | 2.8%(+7.32)#98 | 3.4%(+6.75)#2,173 |
| 99. | Lemon Grove | 10.1% | 2.8%(+7.32)#99 | 3.4%(+6.75)#2,174 |
| 100. | Hanford | 10.0% | 2.8%(+7.18)#100 | 3.4%(+6.61)#2,215 |
Common Questions
What are the Top 10 Cities with the Highest Percentage of Federal Government Employees in California?
Top 10 Cities with the Highest Percentage of Federal Government Employees in California are:
#1
90.9%
#2
84.5%
#3
83.7%
#4
81.7%
#5
76.7%
#6
74.7%
#7
71.8%
#8
71.0%
#9
69.9%
#10
65.6%
What city has the Highest Percentage of Federal Government Employees in California?
Coleville has the Highest Percentage of Federal Government Employees in California with 90.9%.
What is the Percentage of Federal Government Employees in the State of California?
Percentage of Federal Government Employees in California is 2.8%.
What is the Percentage of Federal Government Employees in the United States?
Percentage of Federal Government Employees in the United States is 3.4%.