Twain Harte, CA Map & Demographics
Twain Harte Map
Twain Harte Overview
$75,244
PER CAPITA INCOME
$84,185
AVG FAMILY INCOME
$83,538
AVG HOUSEHOLD INCOME
0.62
INEQUALITY / GINI INDEX
2,154
TOTAL POPULATION
1,309
MALE POPULATION
845
FEMALE POPULATION
154.91
MALES / 100 FEMALES
64.55
FEMALES / 100 MALES
47.4
MEDIAN AGE
2.6
AVG FAMILY SIZE
2.1
AVG HOUSEHOLD SIZE
973
LABOR FORCE [ PEOPLE ]
51.6%
PERCENT IN LABOR FORCE
8.3%
UNEMPLOYMENT RATE
Twain Harte Zip Codes
Twain Harte Area Codes
Income in Twain Harte
Income Overview in Twain Harte
Per Capita Income in Twain Harte is $75,244, while median incomes of families and households are $84,185 and $83,538 respectively.
| Characteristic | Number | Measure |
| Per Capita Income | 2,154 | $75,244 |
| Median Family Income | 631 | $84,185 |
| Mean Family Income | 631 | $143,791 |
| Median Household Income | 1,010 | $83,538 |
| Mean Household Income | 1,010 | $168,118 |
| Income Deficit | 631 | $0 |
| Wage / Income Gap (%) | 2,154 | 0.00% |
| Wage / Income Gap ($) | 2,154 | 100.00¢ per $1 |
| Gini / Inequality Index | 2,154 | 0.62 |
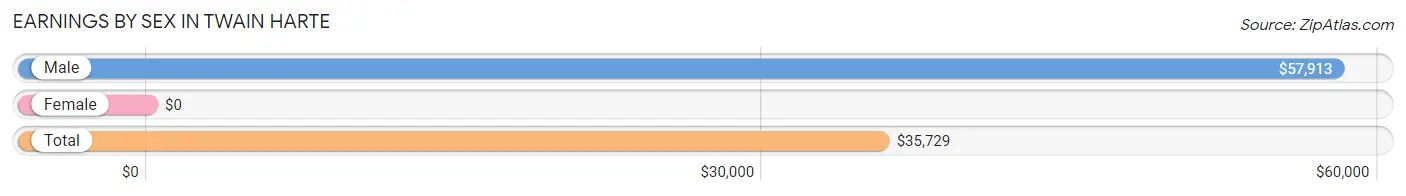
Earnings by Sex in Twain Harte
| Sex | Number | Average Earnings |
| Male | 594 (59.5%) | $57,913 |
| Female | 405 (40.5%) | $0 |
| Total | 999 (100.0%) | $35,729 |
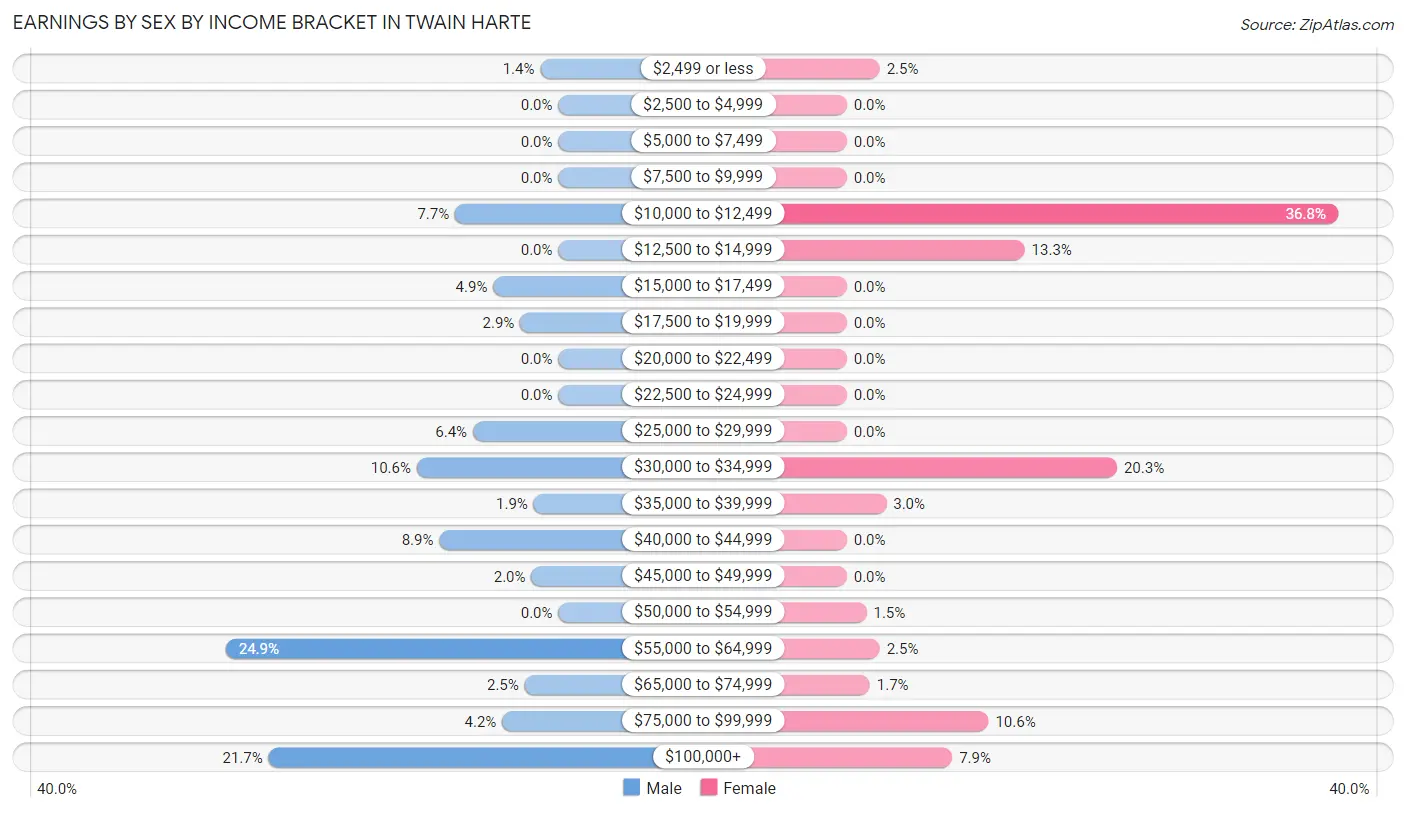
Earnings by Sex by Income Bracket in Twain Harte
The most common earnings brackets in Twain Harte are $55,000 to $64,999 for men (148 | 24.9%) and $10,000 to $12,499 for women (149 | 36.8%).
| Income | Male | Female |
| $2,499 or less | 8 (1.3%) | 10 (2.5%) |
| $2,500 to $4,999 | 0 (0.0%) | 0 (0.0%) |
| $5,000 to $7,499 | 0 (0.0%) | 0 (0.0%) |
| $7,500 to $9,999 | 0 (0.0%) | 0 (0.0%) |
| $10,000 to $12,499 | 46 (7.7%) | 149 (36.8%) |
| $12,500 to $14,999 | 0 (0.0%) | 54 (13.3%) |
| $15,000 to $17,499 | 29 (4.9%) | 0 (0.0%) |
| $17,500 to $19,999 | 17 (2.9%) | 0 (0.0%) |
| $20,000 to $22,499 | 0 (0.0%) | 0 (0.0%) |
| $22,500 to $24,999 | 0 (0.0%) | 0 (0.0%) |
| $25,000 to $29,999 | 38 (6.4%) | 0 (0.0%) |
| $30,000 to $34,999 | 63 (10.6%) | 82 (20.3%) |
| $35,000 to $39,999 | 11 (1.8%) | 12 (3.0%) |
| $40,000 to $44,999 | 53 (8.9%) | 0 (0.0%) |
| $45,000 to $49,999 | 12 (2.0%) | 0 (0.0%) |
| $50,000 to $54,999 | 0 (0.0%) | 6 (1.5%) |
| $55,000 to $64,999 | 148 (24.9%) | 10 (2.5%) |
| $65,000 to $74,999 | 15 (2.5%) | 7 (1.7%) |
| $75,000 to $99,999 | 25 (4.2%) | 43 (10.6%) |
| $100,000+ | 129 (21.7%) | 32 (7.9%) |
| Total | 594 (100.0%) | 405 (100.0%) |
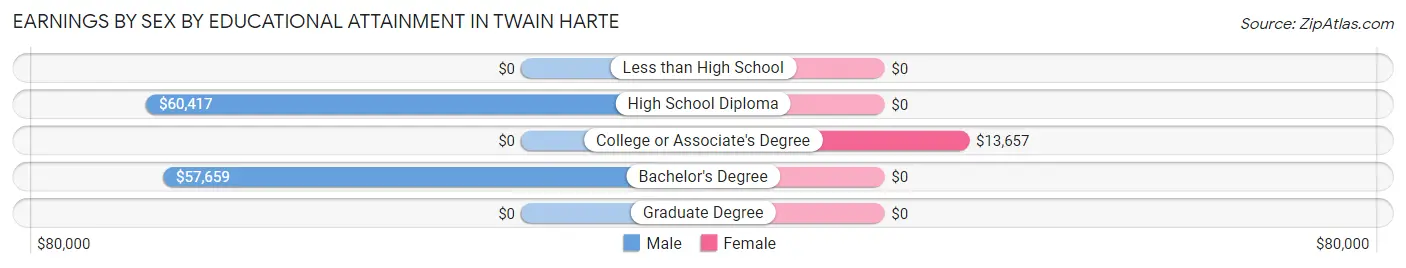
Earnings by Sex by Educational Attainment in Twain Harte
Average earnings in Twain Harte are $58,089 for men and $32,865 for women, a difference of 43.4%. Men with an educational attainment of high school diploma enjoy the highest average annual earnings of $60,417, while those with bachelor's degree education earn the least with $57,659. Women with an educational attainment of college or associate's degree earn the most with the average annual earnings of $13,657, while those with college or associate's degree education have the smallest earnings of $13,657.
| Educational Attainment | Male Income | Female Income |
| Less than High School | - | - |
| High School Diploma | $60,417 | $0 |
| College or Associate's Degree | - | - |
| Bachelor's Degree | $57,659 | $0 |
| Graduate Degree | - | - |
| Total | $58,089 | $32,865 |
Family Income in Twain Harte
Family Income Brackets in Twain Harte
According to the Twain Harte family income data, there are 320 families falling into the $75,000 to $99,999 income range, which is the most common income bracket and makes up 50.7% of all families.
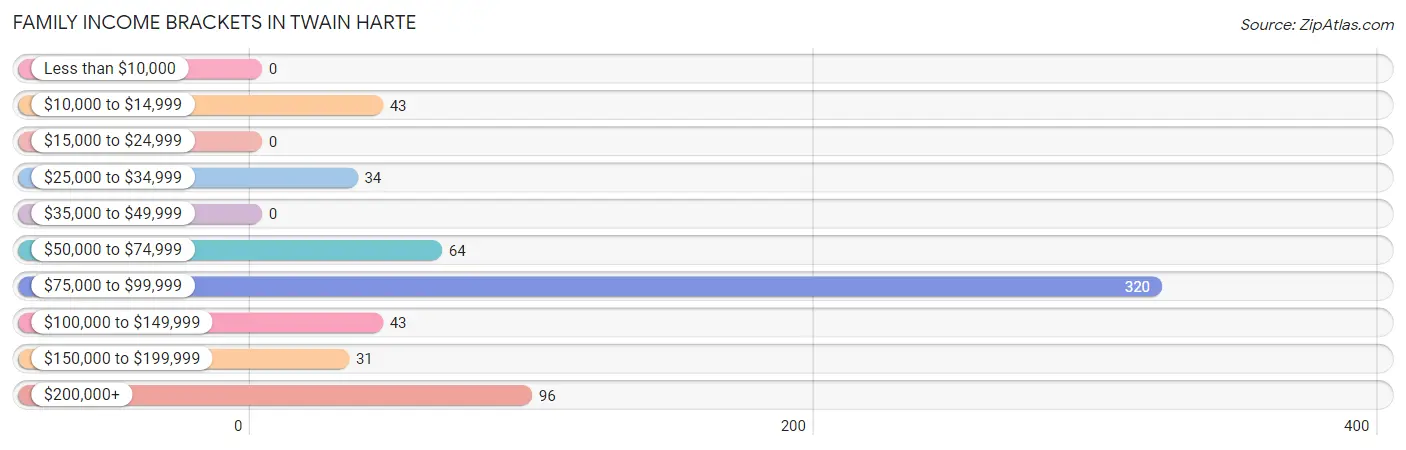
| Income Bracket | # Families | % Families |
| Less than $10,000 | 0 | 0.0% |
| $10,000 to $14,999 | 43 | 6.8% |
| $15,000 to $24,999 | 0 | 0.0% |
| $25,000 to $34,999 | 34 | 5.4% |
| $35,000 to $49,999 | 0 | 0.0% |
| $50,000 to $74,999 | 64 | 10.1% |
| $75,000 to $99,999 | 320 | 50.7% |
| $100,000 to $149,999 | 43 | 6.8% |
| $150,000 to $199,999 | 31 | 4.9% |
| $200,000+ | 96 | 15.2% |
Family Income by Famaliy Size in Twain Harte
2-person families (389 | 61.7%) account for the highest median family income in Twain Harte with $84,453 per family, while 2-person families (389 | 61.7%) have the highest median income of $42,226 per family member.
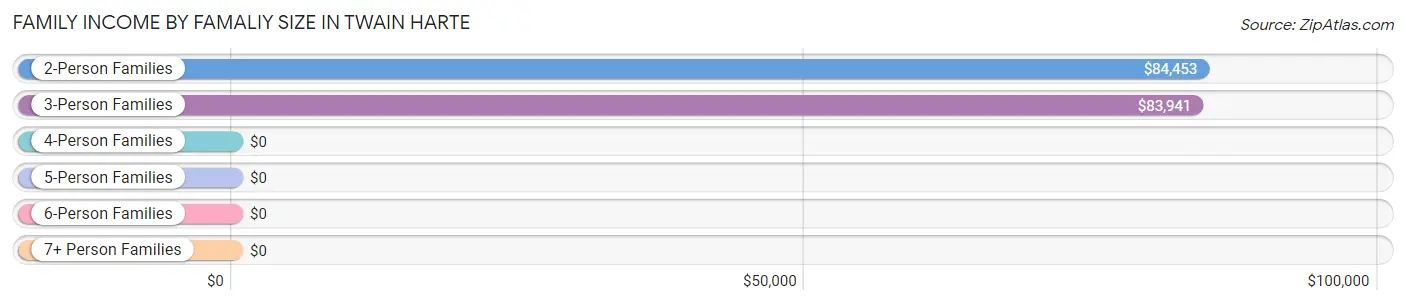
| Income Bracket | # Families | Median Income |
| 2-Person Families | 389 (61.7%) | $84,453 |
| 3-Person Families | 136 (21.5%) | $83,941 |
| 4-Person Families | 81 (12.8%) | $0 |
| 5-Person Families | 25 (4.0%) | $0 |
| 6-Person Families | 0 (0.0%) | $0 |
| 7+ Person Families | 0 (0.0%) | $0 |
| Total | 631 (100.0%) | $84,185 |
Family Income by Number of Earners in Twain Harte
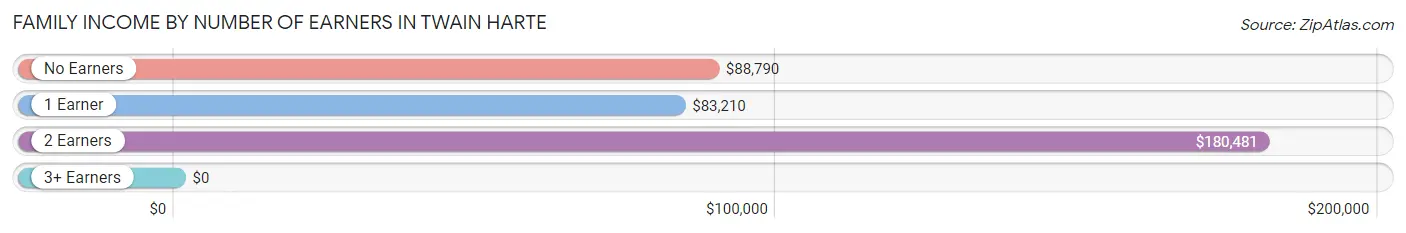
| Number of Earners | # Families | Median Income |
| No Earners | 208 (33.0%) | $88,790 |
| 1 Earner | 205 (32.5%) | $83,210 |
| 2 Earners | 173 (27.4%) | $180,481 |
| 3+ Earners | 45 (7.1%) | $0 |
| Total | 631 (100.0%) | $84,185 |
Household Income in Twain Harte
Household Income Brackets in Twain Harte
With 336 households falling in the category, the $75,000 to $99,999 income range is the most frequent in Twain Harte, accounting for 33.3% of all households.
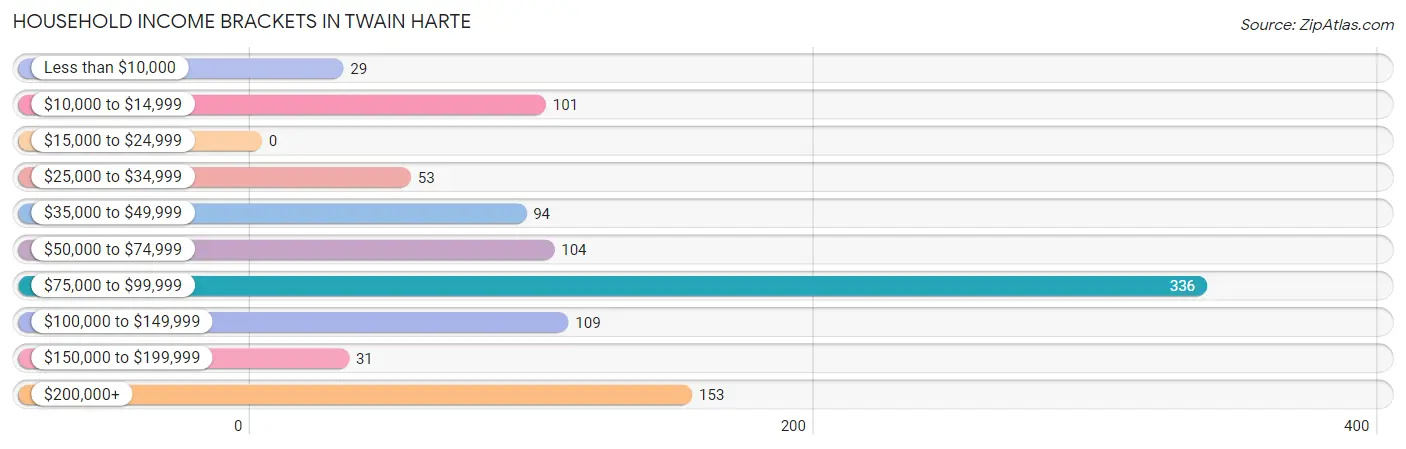
| Income Bracket | # Households | % Households |
| Less than $10,000 | 29 | 2.9% |
| $10,000 to $14,999 | 101 | 10.0% |
| $15,000 to $24,999 | 0 | 0.0% |
| $25,000 to $34,999 | 53 | 5.2% |
| $35,000 to $49,999 | 94 | 9.3% |
| $50,000 to $74,999 | 104 | 10.3% |
| $75,000 to $99,999 | 336 | 33.3% |
| $100,000 to $149,999 | 109 | 10.8% |
| $150,000 to $199,999 | 31 | 3.1% |
| $200,000+ | 153 | 15.1% |
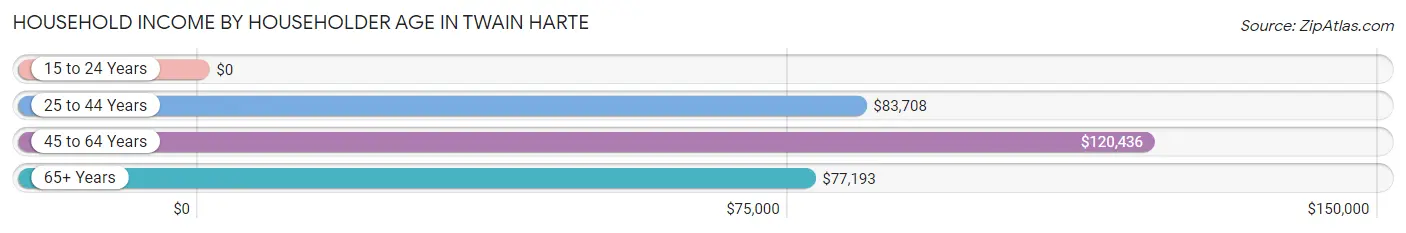
Household Income by Householder Age in Twain Harte
The median household income in Twain Harte is $83,538, with the highest median household income of $120,436 found in the 45 to 64 years age bracket for the primary householder. A total of 279 households (27.6%) fall into this category. Meanwhile, the 15 to 24 years age bracket for the primary householder has the lowest median household income of $0, with 58 households (5.7%) in this group.
| Income Bracket | # Households | Median Income |
| 15 to 24 Years | 58 (5.7%) | $0 |
| 25 to 44 Years | 238 (23.6%) | $83,708 |
| 45 to 64 Years | 279 (27.6%) | $120,436 |
| 65+ Years | 435 (43.1%) | $77,193 |
| Total | 1,010 (100.0%) | $83,538 |
Poverty in Twain Harte
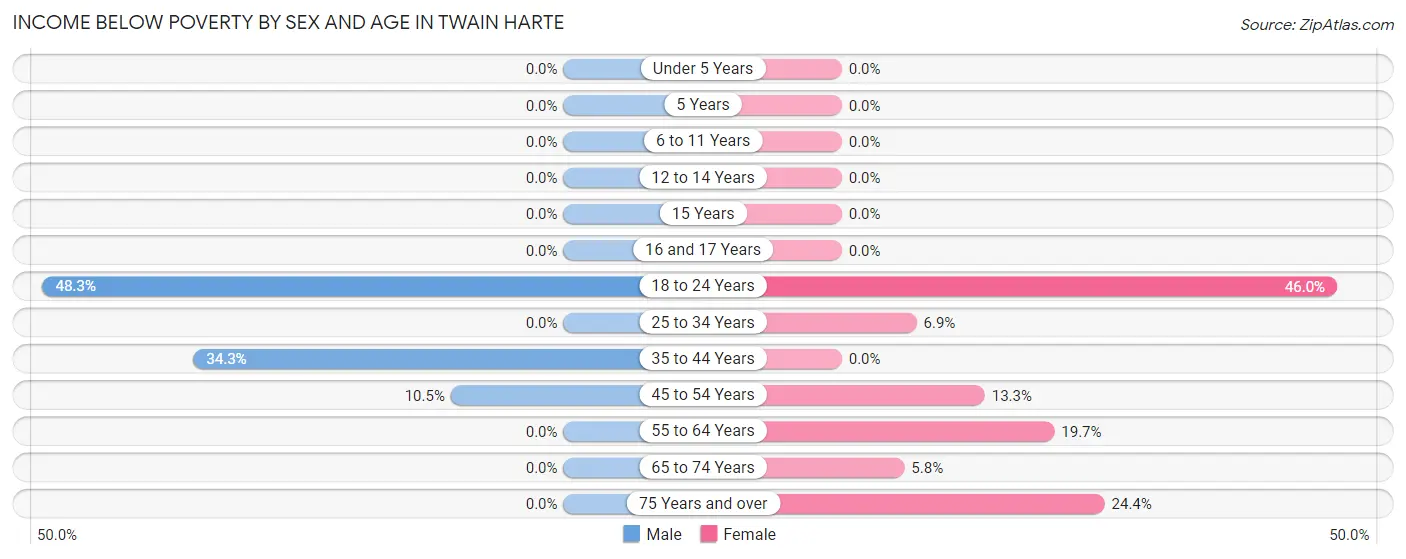
Income Below Poverty by Sex and Age in Twain Harte
With 9.0% poverty level for males and 13.9% for females among the residents of Twain Harte, 18 to 24 year old males and 18 to 24 year old females are the most vulnerable to poverty, with 58 males (48.3%) and 34 females (46.0%) in their respective age groups living below the poverty level.
| Age Bracket | Male | Female |
| Under 5 Years | 0 (0.0%) | 0 (0.0%) |
| 5 Years | 0 (0.0%) | 0 (0.0%) |
| 6 to 11 Years | 0 (0.0%) | 0 (0.0%) |
| 12 to 14 Years | 0 (0.0%) | 0 (0.0%) |
| 15 Years | 0 (0.0%) | 0 (0.0%) |
| 16 and 17 Years | 0 (0.0%) | 0 (0.0%) |
| 18 to 24 Years | 58 (48.3%) | 34 (46.0%) |
| 25 to 34 Years | 0 (0.0%) | 12 (6.9%) |
| 35 to 44 Years | 46 (34.3%) | 0 (0.0%) |
| 45 to 54 Years | 14 (10.4%) | 13 (13.3%) |
| 55 to 64 Years | 0 (0.0%) | 29 (19.7%) |
| 65 to 74 Years | 0 (0.0%) | 9 (5.8%) |
| 75 Years and over | 0 (0.0%) | 20 (24.4%) |
| Total | 118 (9.0%) | 117 (13.9%) |
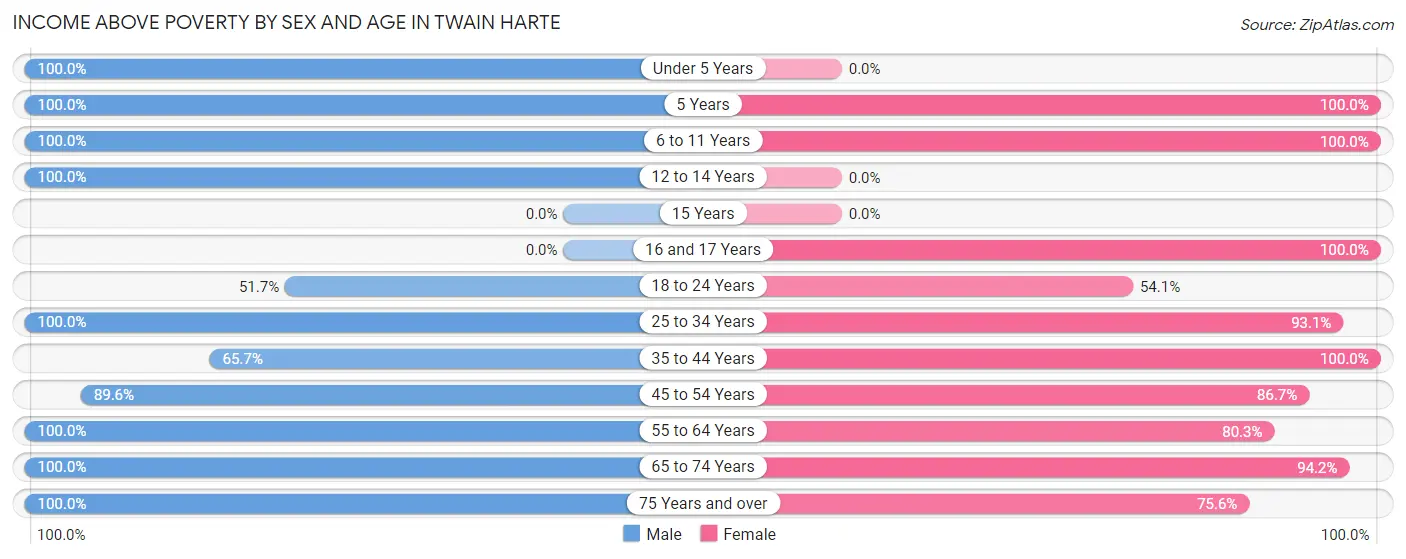
Income Above Poverty by Sex and Age in Twain Harte
According to the poverty statistics in Twain Harte, males aged under 5 years and females aged 5 years are the age groups that are most secure financially, with 100.0% of males and 100.0% of females in these age groups living above the poverty line.
| Age Bracket | Male | Female |
| Under 5 Years | 179 (100.0%) | 0 (0.0%) |
| 5 Years | 34 (100.0%) | 13 (100.0%) |
| 6 to 11 Years | 13 (100.0%) | 20 (100.0%) |
| 12 to 14 Years | 10 (100.0%) | 0 (0.0%) |
| 15 Years | 0 (0.0%) | 0 (0.0%) |
| 16 and 17 Years | 0 (0.0%) | 27 (100.0%) |
| 18 to 24 Years | 62 (51.7%) | 40 (54.0%) |
| 25 to 34 Years | 217 (100.0%) | 161 (93.1%) |
| 35 to 44 Years | 88 (65.7%) | 56 (100.0%) |
| 45 to 54 Years | 120 (89.5%) | 85 (86.7%) |
| 55 to 64 Years | 78 (100.0%) | 118 (80.3%) |
| 65 to 74 Years | 275 (100.0%) | 146 (94.2%) |
| 75 Years and over | 115 (100.0%) | 62 (75.6%) |
| Total | 1,191 (91.0%) | 728 (86.2%) |
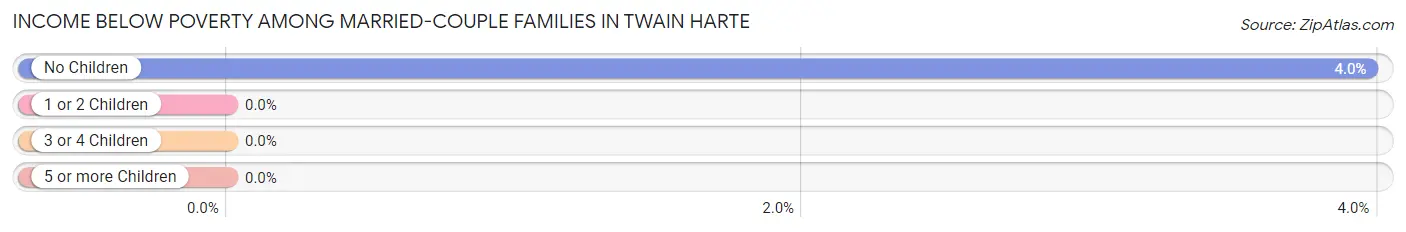
Income Below Poverty Among Married-Couple Families in Twain Harte
The poverty statistics for married-couple families in Twain Harte show that 2.6% or 14 of the total 546 families live below the poverty line. Families with no children have the highest poverty rate of 4.0%, comprising of 14 families. On the other hand, families with 1 or 2 children have the lowest poverty rate of 0.0%, which includes 0 families.
| Children | Above Poverty | Below Poverty |
| No Children | 339 (96.0%) | 14 (4.0%) |
| 1 or 2 Children | 168 (100.0%) | 0 (0.0%) |
| 3 or 4 Children | 25 (100.0%) | 0 (0.0%) |
| 5 or more Children | 0 (0.0%) | 0 (0.0%) |
| Total | 532 (97.4%) | 14 (2.6%) |
Income Below Poverty Among Single-Parent Households in Twain Harte
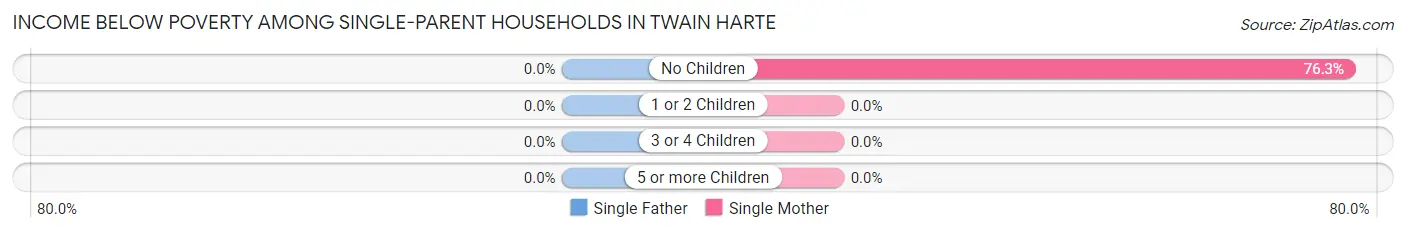
| Children | Single Father | Single Mother |
| No Children | 0 (0.0%) | 29 (76.3%) |
| 1 or 2 Children | 0 (0.0%) | 0 (0.0%) |
| 3 or 4 Children | 0 (0.0%) | 0 (0.0%) |
| 5 or more Children | 0 (0.0%) | 0 (0.0%) |
| Total | 0 (0.0%) | 29 (76.3%) |
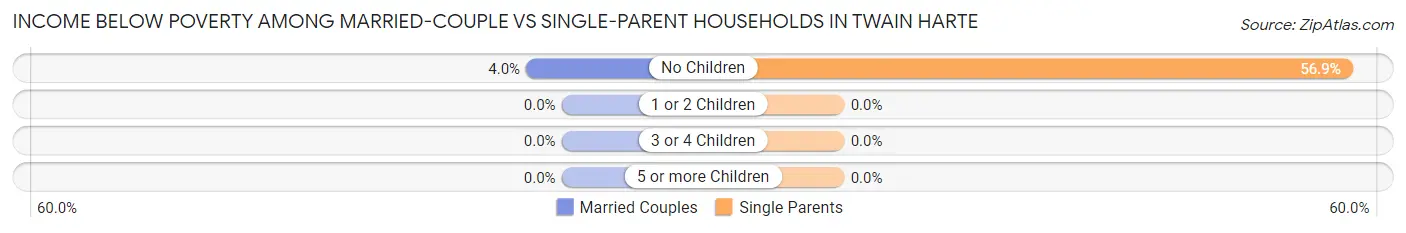
Income Below Poverty Among Married-Couple vs Single-Parent Households in Twain Harte
The poverty data for Twain Harte shows that 14 of the married-couple family households (2.6%) and 29 of the single-parent households (34.1%) are living below the poverty level. Within the married-couple family households, those with no children have the highest poverty rate, with 14 households (4.0%) falling below the poverty line. Among the single-parent households, those with no children have the highest poverty rate, with 29 household (56.9%) living below poverty.
| Children | Married-Couple Families | Single-Parent Households |
| No Children | 14 (4.0%) | 29 (56.9%) |
| 1 or 2 Children | 0 (0.0%) | 0 (0.0%) |
| 3 or 4 Children | 0 (0.0%) | 0 (0.0%) |
| 5 or more Children | 0 (0.0%) | 0 (0.0%) |
| Total | 14 (2.6%) | 29 (34.1%) |
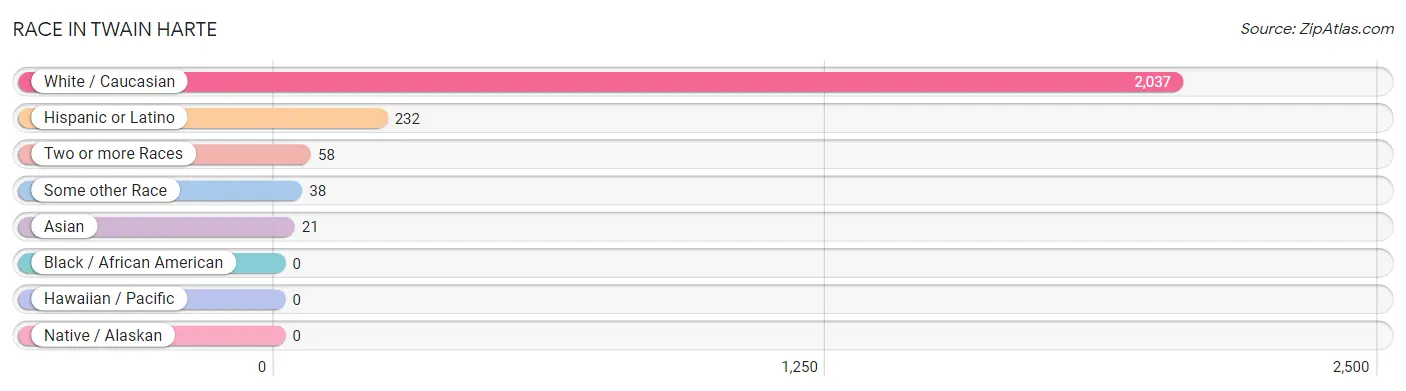
Race in Twain Harte
The most populous races in Twain Harte are White / Caucasian (2,037 | 94.6%), Hispanic or Latino (232 | 10.8%), and Two or more Races (58 | 2.7%).
| Race | # Population | % Population |
| Asian | 21 | 1.0% |
| Black / African American | 0 | 0.0% |
| Hawaiian / Pacific | 0 | 0.0% |
| Hispanic or Latino | 232 | 10.8% |
| Native / Alaskan | 0 | 0.0% |
| White / Caucasian | 2,037 | 94.6% |
| Two or more Races | 58 | 2.7% |
| Some other Race | 38 | 1.8% |
| Total | 2,154 | 100.0% |
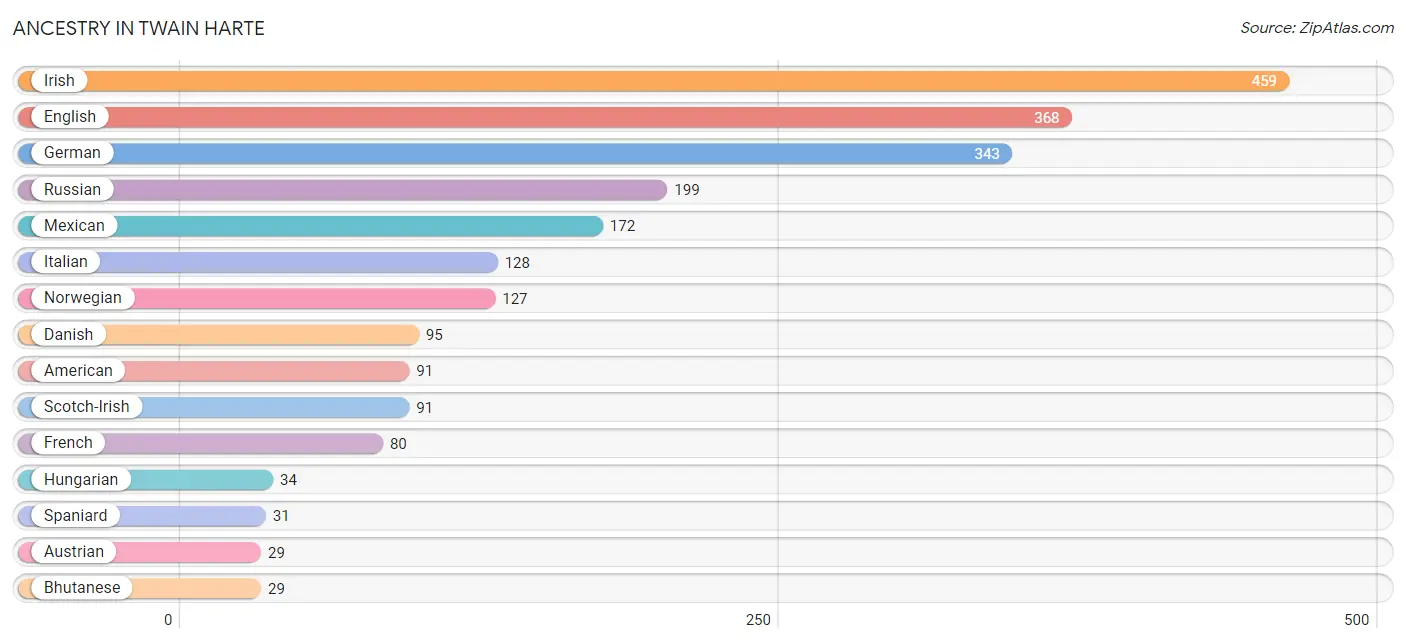
Ancestry in Twain Harte
The most populous ancestries reported in Twain Harte are Irish (459 | 21.3%), English (368 | 17.1%), German (343 | 15.9%), Russian (199 | 9.2%), and Mexican (172 | 8.0%), together accounting for 71.5% of all Twain Harte residents.
| Ancestry | # Population | % Population |
| American | 91 | 4.2% |
| Armenian | 7 | 0.3% |
| Austrian | 29 | 1.3% |
| Bhutanese | 29 | 1.3% |
| British | 16 | 0.7% |
| Cherokee | 17 | 0.8% |
| Danish | 95 | 4.4% |
| English | 368 | 17.1% |
| French | 80 | 3.7% |
| German | 343 | 15.9% |
| Hungarian | 34 | 1.6% |
| Irish | 459 | 21.3% |
| Italian | 128 | 5.9% |
| Laotian | 11 | 0.5% |
| Mexican | 172 | 8.0% |
| Norwegian | 127 | 5.9% |
| Polish | 12 | 0.6% |
| Portuguese | 8 | 0.4% |
| Russian | 199 | 9.2% |
| Scotch-Irish | 91 | 4.2% |
| Scottish | 11 | 0.5% |
| Spaniard | 31 | 1.4% |
| Spanish | 29 | 1.3% |
| Swedish | 28 | 1.3% |
| Swiss | 10 | 0.5% |
| Thai | 10 | 0.5% |
| Ukrainian | 10 | 0.5% |
| Welsh | 11 | 0.5% | View All 28 Rows |
Immigrants in Twain Harte
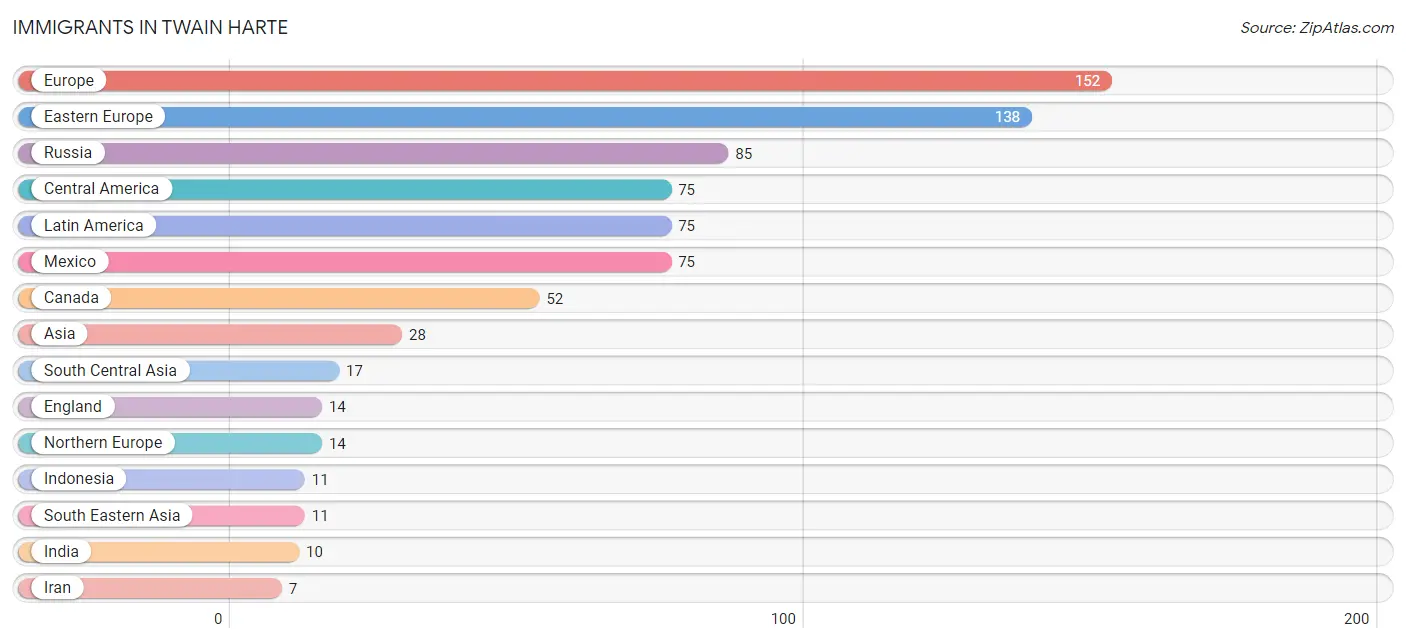
The most numerous immigrant groups reported in Twain Harte came from Europe (152 | 7.1%), Eastern Europe (138 | 6.4%), Russia (85 | 4.0%), Central America (75 | 3.5%), and Latin America (75 | 3.5%), together accounting for 24.4% of all Twain Harte residents.
| Immigration Origin | # Population | % Population |
| Asia | 28 | 1.3% |
| Canada | 52 | 2.4% |
| Central America | 75 | 3.5% |
| Eastern Europe | 138 | 6.4% |
| England | 14 | 0.6% |
| Europe | 152 | 7.1% |
| India | 10 | 0.5% |
| Indonesia | 11 | 0.5% |
| Iran | 7 | 0.3% |
| Latin America | 75 | 3.5% |
| Mexico | 75 | 3.5% |
| Northern Europe | 14 | 0.6% |
| Russia | 85 | 4.0% |
| South Central Asia | 17 | 0.8% |
| South Eastern Asia | 11 | 0.5% | View All 15 Rows |
Sex and Age in Twain Harte
Sex and Age in Twain Harte
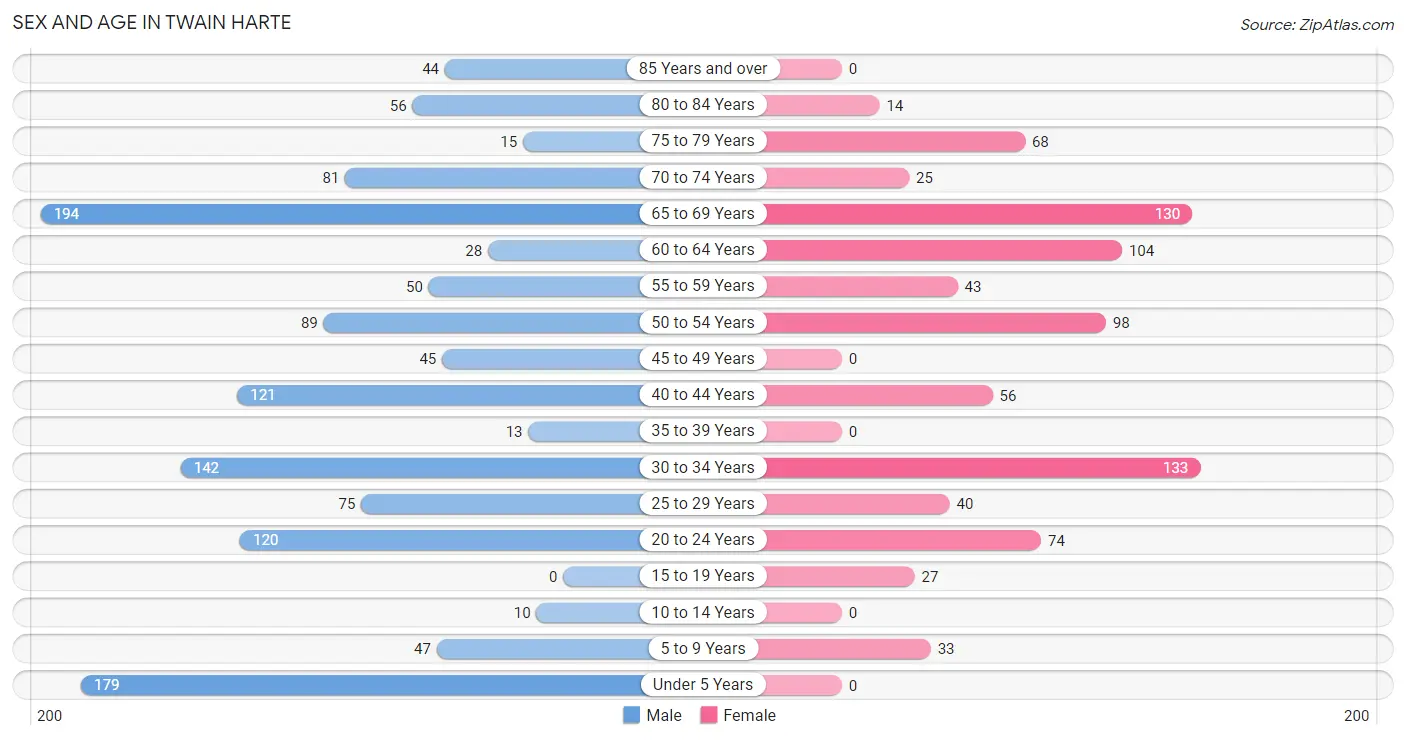
The most populous age groups in Twain Harte are 65 to 69 Years (194 | 14.8%) for men and 30 to 34 Years (133 | 15.7%) for women.
| Age Bracket | Male | Female |
| Under 5 Years | 179 (13.7%) | 0 (0.0%) |
| 5 to 9 Years | 47 (3.6%) | 33 (3.9%) |
| 10 to 14 Years | 10 (0.8%) | 0 (0.0%) |
| 15 to 19 Years | 0 (0.0%) | 27 (3.2%) |
| 20 to 24 Years | 120 (9.2%) | 74 (8.8%) |
| 25 to 29 Years | 75 (5.7%) | 40 (4.7%) |
| 30 to 34 Years | 142 (10.8%) | 133 (15.7%) |
| 35 to 39 Years | 13 (1.0%) | 0 (0.0%) |
| 40 to 44 Years | 121 (9.2%) | 56 (6.6%) |
| 45 to 49 Years | 45 (3.4%) | 0 (0.0%) |
| 50 to 54 Years | 89 (6.8%) | 98 (11.6%) |
| 55 to 59 Years | 50 (3.8%) | 43 (5.1%) |
| 60 to 64 Years | 28 (2.1%) | 104 (12.3%) |
| 65 to 69 Years | 194 (14.8%) | 130 (15.4%) |
| 70 to 74 Years | 81 (6.2%) | 25 (3.0%) |
| 75 to 79 Years | 15 (1.1%) | 68 (8.1%) |
| 80 to 84 Years | 56 (4.3%) | 14 (1.7%) |
| 85 Years and over | 44 (3.4%) | 0 (0.0%) |
| Total | 1,309 (100.0%) | 845 (100.0%) |
Families and Households in Twain Harte
Median Family Size in Twain Harte
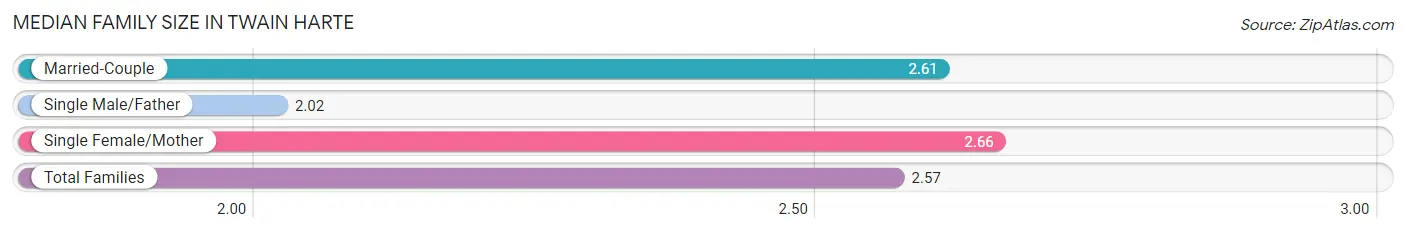
The median family size in Twain Harte is 2.57 persons per family, with single female/mother families (38 | 6.0%) accounting for the largest median family size of 2.66 persons per family. On the other hand, single male/father families (47 | 7.4%) represent the smallest median family size with 2.02 persons per family.
| Family Type | # Families | Family Size |
| Married-Couple | 546 (86.5%) | 2.61 |
| Single Male/Father | 47 (7.4%) | 2.02 |
| Single Female/Mother | 38 (6.0%) | 2.66 |
| Total Families | 631 (100.0%) | 2.57 |
Median Household Size in Twain Harte
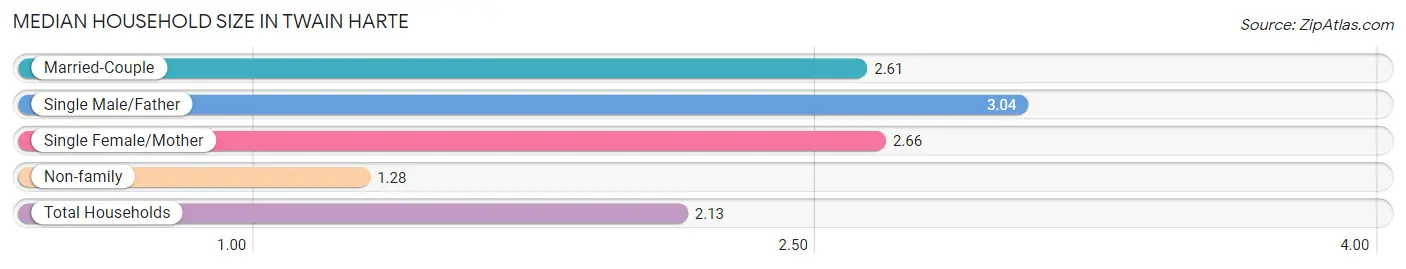
The median household size in Twain Harte is 2.13 persons per household, with single male/father households (47 | 4.6%) accounting for the largest median household size of 3.04 persons per household. non-family households (379 | 37.5%) represent the smallest median household size with 1.28 persons per household.
| Household Type | # Households | Household Size |
| Married-Couple | 546 (54.1%) | 2.61 |
| Single Male/Father | 47 (4.6%) | 3.04 |
| Single Female/Mother | 38 (3.8%) | 2.66 |
| Non-family | 379 (37.5%) | 1.28 |
| Total Households | 1,010 (100.0%) | 2.13 |
Household Size by Marriage Status in Twain Harte
Out of a total of 1,010 households in Twain Harte, 631 (62.5%) are family households, while 379 (37.5%) are nonfamily households. The most numerous type of family households are 2-person households, comprising 342, and the most common type of nonfamily households are 1-person households, comprising 309.
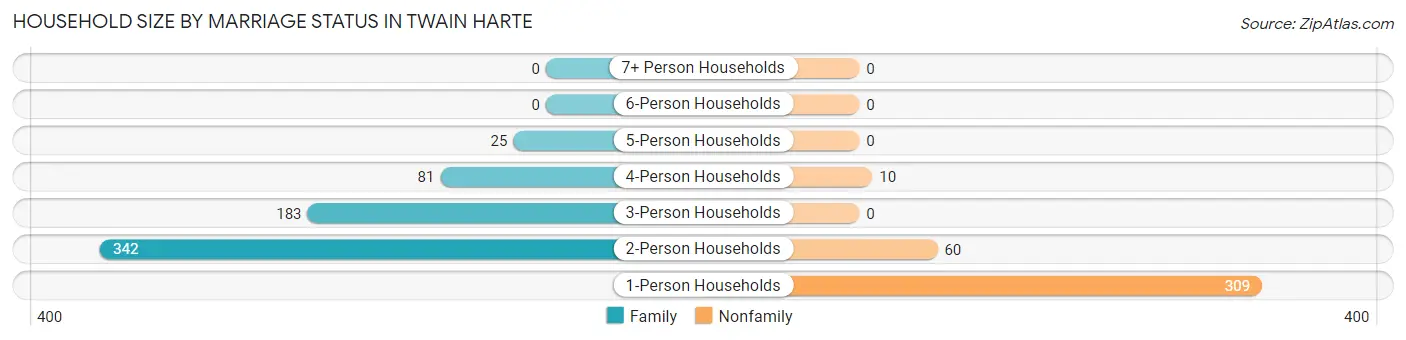
| Household Size | Family Households | Nonfamily Households |
| 1-Person Households | - | 309 (30.6%) |
| 2-Person Households | 342 (33.9%) | 60 (5.9%) |
| 3-Person Households | 183 (18.1%) | 0 (0.0%) |
| 4-Person Households | 81 (8.0%) | 10 (1.0%) |
| 5-Person Households | 25 (2.5%) | 0 (0.0%) |
| 6-Person Households | 0 (0.0%) | 0 (0.0%) |
| 7+ Person Households | 0 (0.0%) | 0 (0.0%) |
| Total | 631 (62.5%) | 379 (37.5%) |
Female Fertility in Twain Harte
Fertility by Age in Twain Harte
| Age Bracket | Women with Births | Births / 1,000 Women |
| 15 to 19 years | 0 (0.0%) | 0.0 |
| 20 to 34 years | 0 (0.0%) | 0.0 |
| 35 to 50 years | 0 (0.0%) | 0.0 |
| Total | 0 (0.0%) | 0.0 |
Fertility by Age by Marriage Status in Twain Harte
| Age Bracket | Married | Unmarried |
| 15 to 19 years | 0 (0.0%) | 0 (0.0%) |
| 20 to 34 years | 0 (0.0%) | 0 (0.0%) |
| 35 to 50 years | 0 (0.0%) | 0 (0.0%) |
| Total | 0 (0.0%) | 0 (0.0%) |
Fertility by Education in Twain Harte
| Educational Attainment | Women with Births | Births / 1,000 Women |
| Less than High School | 0 (0.0%) | 0.0 |
| High School Diploma | 0 (0.0%) | 0.0 |
| College or Associate's Degree | 0 (0.0%) | 0.0 |
| Bachelor's Degree | 0 (0.0%) | 0.0 |
| Graduate Degree | 0 (0.0%) | 0.0 |
| Total | 0 (0.0%) | 0.0 |
Fertility by Education by Marriage Status in Twain Harte
| Educational Attainment | Married | Unmarried |
| Less than High School | 0 (0.0%) | 0 (0.0%) |
| High School Diploma | 0 (0.0%) | 0 (0.0%) |
| College or Associate's Degree | 0 (0.0%) | 0 (0.0%) |
| Bachelor's Degree | 0 (0.0%) | 0 (0.0%) |
| Graduate Degree | 0 (0.0%) | 0 (0.0%) |
| Total | 0 (0.0%) | 0 (0.0%) |
Employment Characteristics in Twain Harte
Employment by Class of Employer in Twain Harte
Among the 891 employed individuals in Twain Harte, private company employees (550 | 61.7%), state government employees (140 | 15.7%), and self-employed (not incorporated) (135 | 15.1%) make up the most common classes of employment.
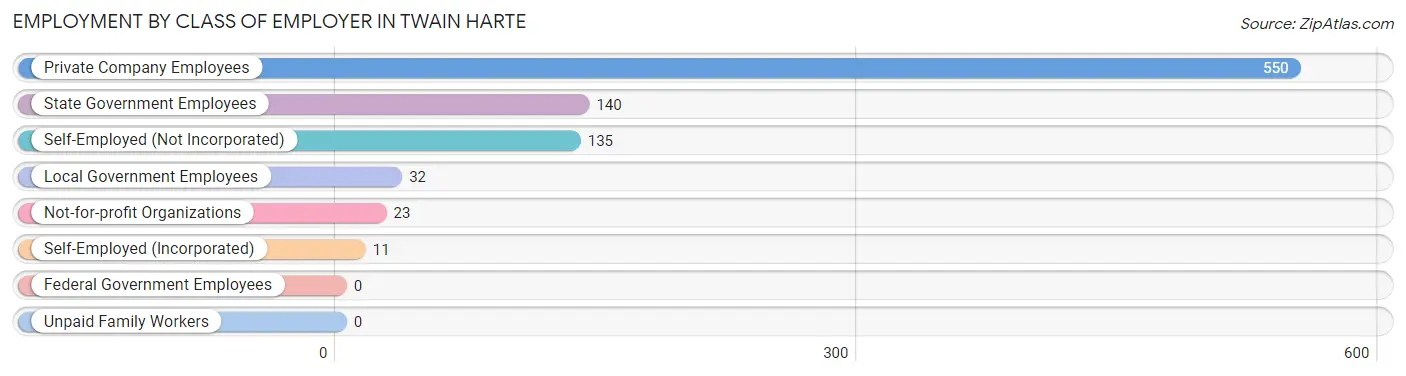
| Employer Class | # Employees | % Employees |
| Private Company Employees | 550 | 61.7% |
| Self-Employed (Incorporated) | 11 | 1.2% |
| Self-Employed (Not Incorporated) | 135 | 15.1% |
| Not-for-profit Organizations | 23 | 2.6% |
| Local Government Employees | 32 | 3.6% |
| State Government Employees | 140 | 15.7% |
| Federal Government Employees | 0 | 0.0% |
| Unpaid Family Workers | 0 | 0.0% |
| Total | 891 | 100.0% |
Employment Status by Age in Twain Harte
According to the labor force statistics for Twain Harte, out of the total population over 16 years of age (1,885), 51.6% or 973 individuals are in the labor force, with 8.3% or 81 of them unemployed. The age group with the highest labor force participation rate is 25 to 29 years, with 100.0% or 115 individuals in the labor force. Within the labor force, the 20 to 24 years age range has the highest percentage of unemployed individuals, with 53.2% or 58 of them being unemployed.
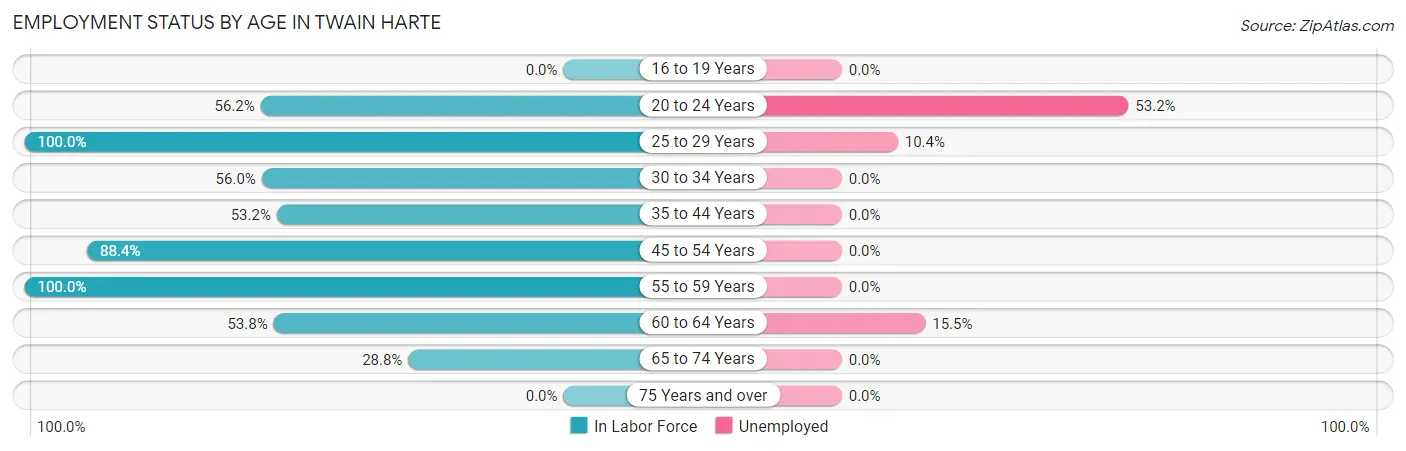
| Age Bracket | In Labor Force | Unemployed |
| 16 to 19 Years | 0 (0.0%) | 0 (0.0%) |
| 20 to 24 Years | 109 (56.2%) | 58 (53.2%) |
| 25 to 29 Years | 115 (100.0%) | 12 (10.4%) |
| 30 to 34 Years | 154 (56.0%) | 0 (0.0%) |
| 35 to 44 Years | 101 (53.2%) | 0 (0.0%) |
| 45 to 54 Years | 205 (88.4%) | 0 (0.0%) |
| 55 to 59 Years | 93 (100.0%) | 0 (0.0%) |
| 60 to 64 Years | 71 (53.8%) | 11 (15.5%) |
| 65 to 74 Years | 124 (28.8%) | 0 (0.0%) |
| 75 Years and over | 0 (0.0%) | 0 (0.0%) |
| Total | 973 (51.6%) | 81 (8.3%) |
Employment Status by Educational Attainment in Twain Harte
According to labor force statistics for Twain Harte, 71.3% of individuals (739) out of the total population between 25 and 64 years of age (1,037) are in the labor force, with 3.1% or 23 of them being unemployed. The group with the highest labor force participation rate are those with the educational attainment of high school diploma, with 100.0% or 152 individuals in the labor force. Within the labor force, individuals with college / associate degree education have the highest percentage of unemployment, with 10.4% or 12 of them being unemployed.
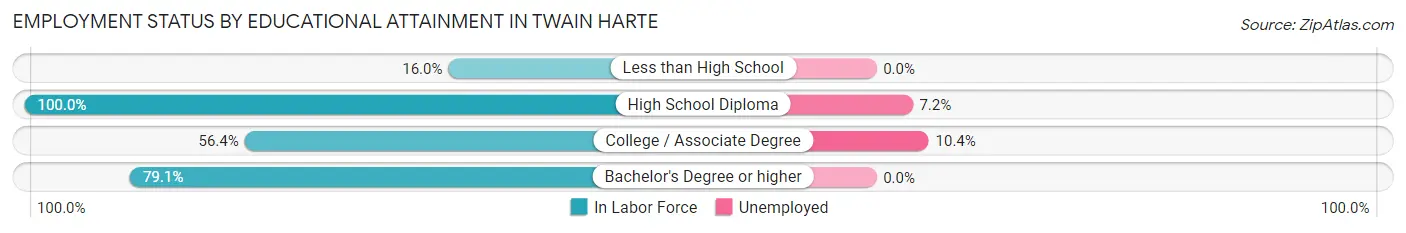
| Educational Attainment | In Labor Force | Unemployed |
| Less than High School | 17 (16.0%) | 0 (0.0%) |
| High School Diploma | 152 (100.0%) | 11 (7.2%) |
| College / Associate Degree | 115 (56.4%) | 21 (10.4%) |
| Bachelor's Degree or higher | 455 (79.1%) | 0 (0.0%) |
| Total | 739 (71.3%) | 32 (3.1%) |
Employment Occupations by Sex in Twain Harte
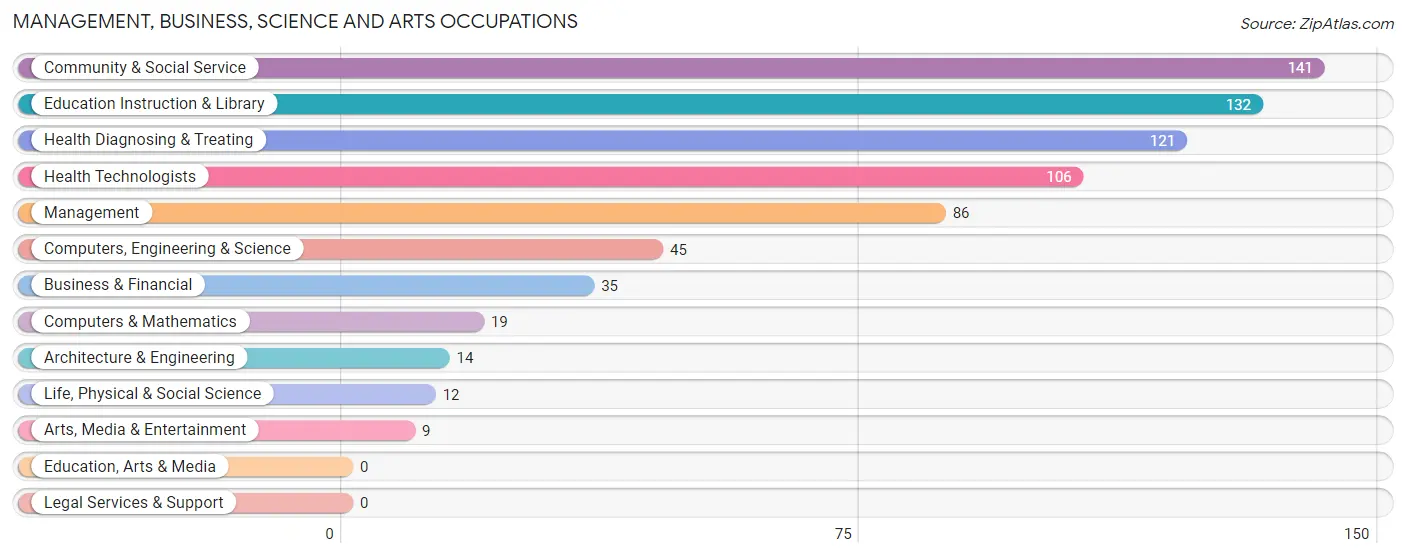
Management, Business, Science and Arts Occupations
The most common Management, Business, Science and Arts occupations in Twain Harte are Community & Social Service (141 | 15.8%), Education Instruction & Library (132 | 14.8%), Health Diagnosing & Treating (121 | 13.6%), Health Technologists (106 | 11.9%), and Management (86 | 9.7%).
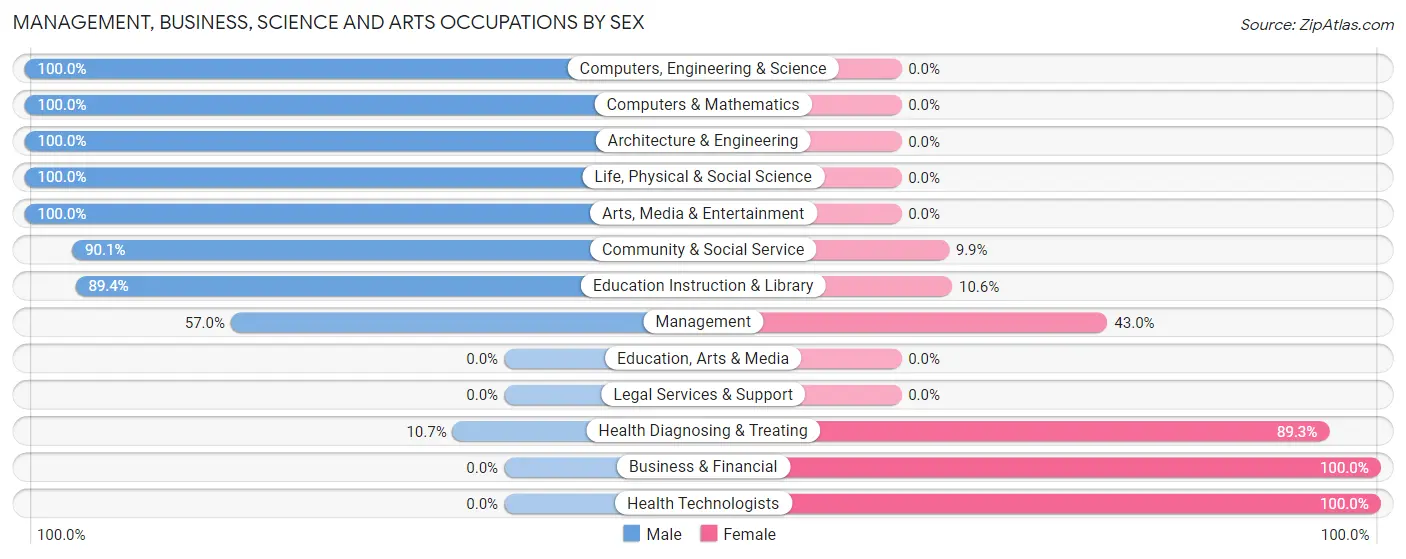
Management, Business, Science and Arts Occupations by Sex
Within the Management, Business, Science and Arts occupations in Twain Harte, the most male-oriented occupations are Computers, Engineering & Science (100.0%), Computers & Mathematics (100.0%), and Architecture & Engineering (100.0%), while the most female-oriented occupations are Business & Financial (100.0%), Health Technologists (100.0%), and Health Diagnosing & Treating (89.3%).
| Occupation | Male | Female |
| Management | 49 (57.0%) | 37 (43.0%) |
| Business & Financial | 0 (0.0%) | 35 (100.0%) |
| Computers, Engineering & Science | 45 (100.0%) | 0 (0.0%) |
| Computers & Mathematics | 19 (100.0%) | 0 (0.0%) |
| Architecture & Engineering | 14 (100.0%) | 0 (0.0%) |
| Life, Physical & Social Science | 12 (100.0%) | 0 (0.0%) |
| Community & Social Service | 127 (90.1%) | 14 (9.9%) |
| Education, Arts & Media | 0 (0.0%) | 0 (0.0%) |
| Legal Services & Support | 0 (0.0%) | 0 (0.0%) |
| Education Instruction & Library | 118 (89.4%) | 14 (10.6%) |
| Arts, Media & Entertainment | 9 (100.0%) | 0 (0.0%) |
| Health Diagnosing & Treating | 13 (10.7%) | 108 (89.3%) |
| Health Technologists | 0 (0.0%) | 106 (100.0%) |
| Total (Category) | 234 (54.7%) | 194 (45.3%) |
| Total (Overall) | 548 (61.5%) | 343 (38.5%) |
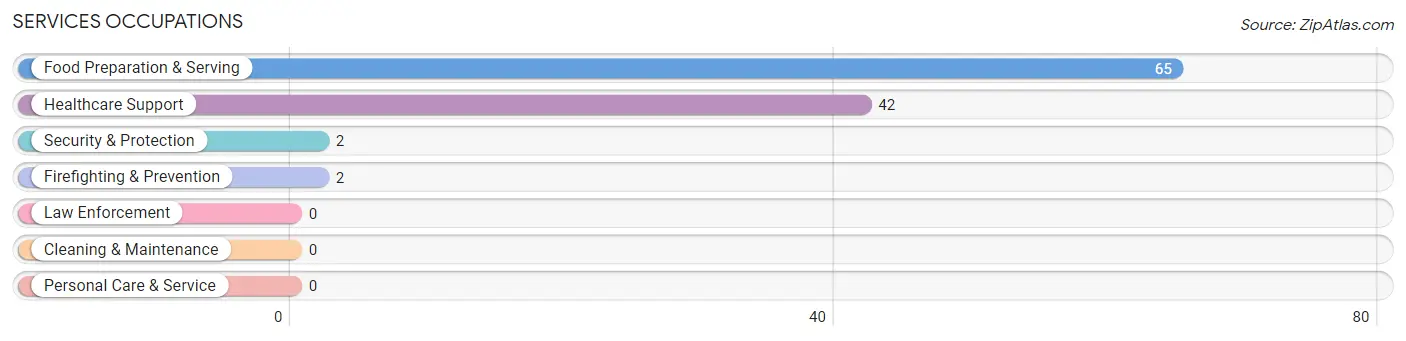
Services Occupations
The most common Services occupations in Twain Harte are Food Preparation & Serving (65 | 7.3%), Healthcare Support (42 | 4.7%), Security & Protection (2 | 0.2%), and Firefighting & Prevention (2 | 0.2%).
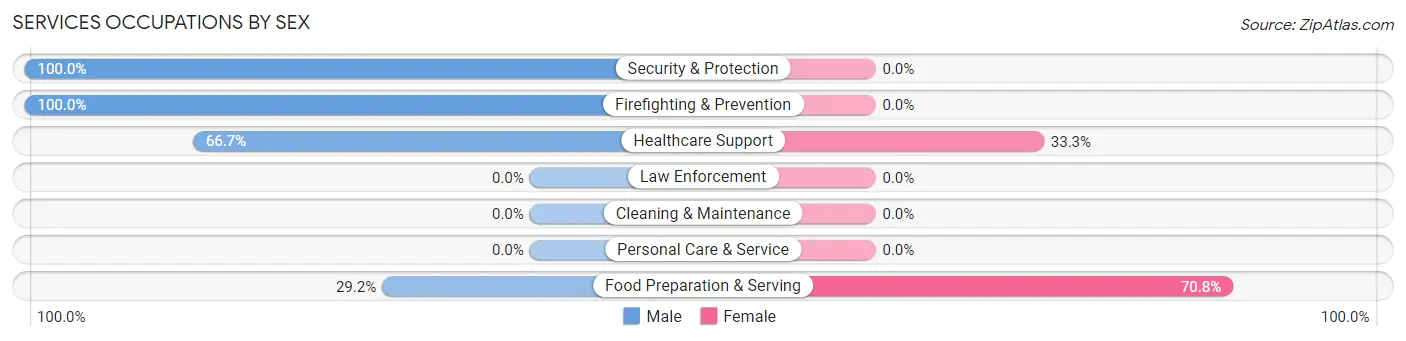
Services Occupations by Sex
Within the Services occupations in Twain Harte, the most male-oriented occupations are Security & Protection (100.0%), Firefighting & Prevention (100.0%), and Healthcare Support (66.7%), while the most female-oriented occupations are Food Preparation & Serving (70.8%), and Healthcare Support (33.3%).
| Occupation | Male | Female |
| Healthcare Support | 28 (66.7%) | 14 (33.3%) |
| Security & Protection | 2 (100.0%) | 0 (0.0%) |
| Firefighting & Prevention | 2 (100.0%) | 0 (0.0%) |
| Law Enforcement | 0 (0.0%) | 0 (0.0%) |
| Food Preparation & Serving | 19 (29.2%) | 46 (70.8%) |
| Cleaning & Maintenance | 0 (0.0%) | 0 (0.0%) |
| Personal Care & Service | 0 (0.0%) | 0 (0.0%) |
| Total (Category) | 49 (45.0%) | 60 (55.0%) |
| Total (Overall) | 548 (61.5%) | 343 (38.5%) |
Sales and Office Occupations
The most common Sales and Office occupations in Twain Harte are Sales & Related (82 | 9.2%), and Office & Administration (46 | 5.2%).
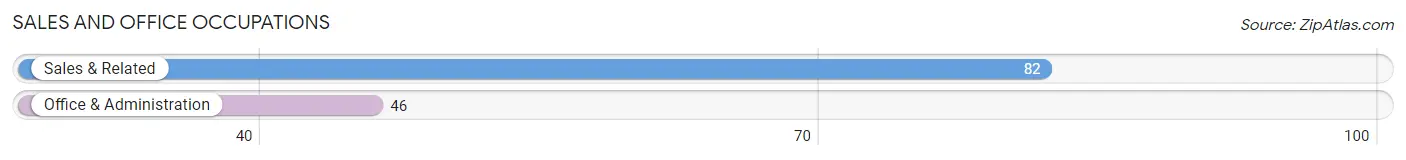
Sales and Office Occupations by Sex
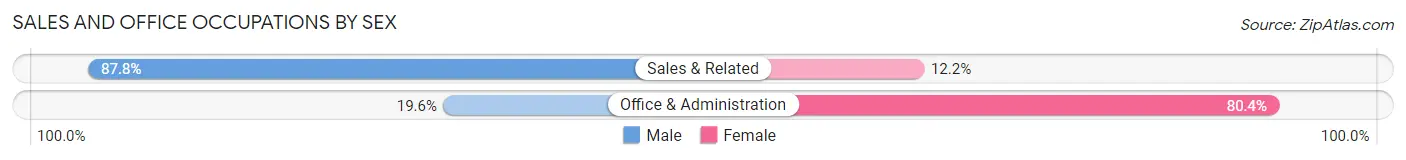
| Occupation | Male | Female |
| Sales & Related | 72 (87.8%) | 10 (12.2%) |
| Office & Administration | 9 (19.6%) | 37 (80.4%) |
| Total (Category) | 81 (63.3%) | 47 (36.7%) |
| Total (Overall) | 548 (61.5%) | 343 (38.5%) |
Natural Resources, Construction and Maintenance Occupations
The most common Natural Resources, Construction and Maintenance occupations in Twain Harte are Installation, Maintenance & Repair (95 | 10.7%), and Construction & Extraction (57 | 6.4%).
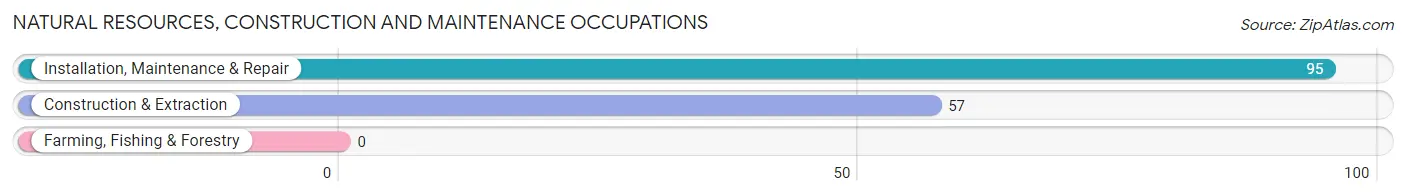
Natural Resources, Construction and Maintenance Occupations by Sex
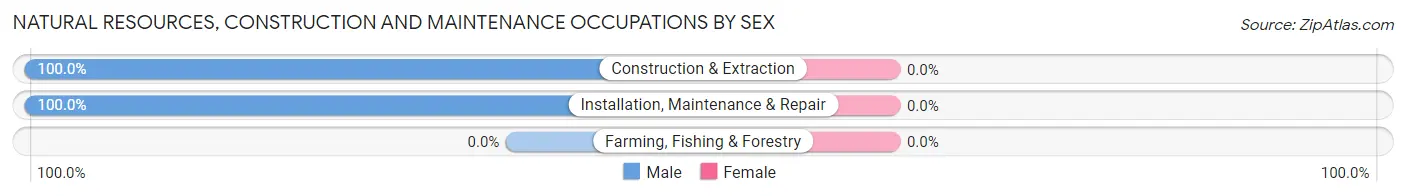
| Occupation | Male | Female |
| Farming, Fishing & Forestry | 0 (0.0%) | 0 (0.0%) |
| Construction & Extraction | 57 (100.0%) | 0 (0.0%) |
| Installation, Maintenance & Repair | 95 (100.0%) | 0 (0.0%) |
| Total (Category) | 152 (100.0%) | 0 (0.0%) |
| Total (Overall) | 548 (61.5%) | 343 (38.5%) |
Production, Transportation and Moving Occupations
The most common Production, Transportation and Moving occupations in Twain Harte are Production (55 | 6.2%), and Transportation (19 | 2.1%).
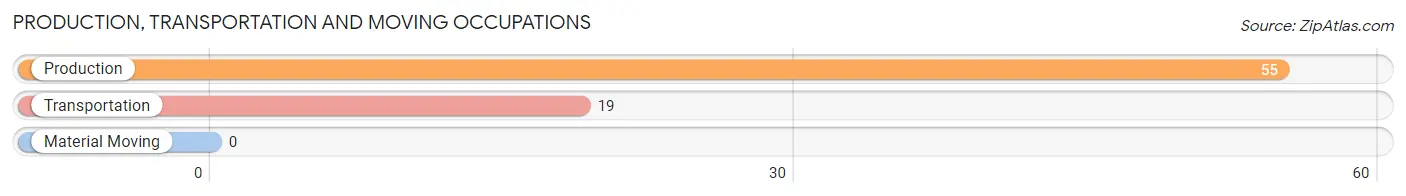
Production, Transportation and Moving Occupations by Sex
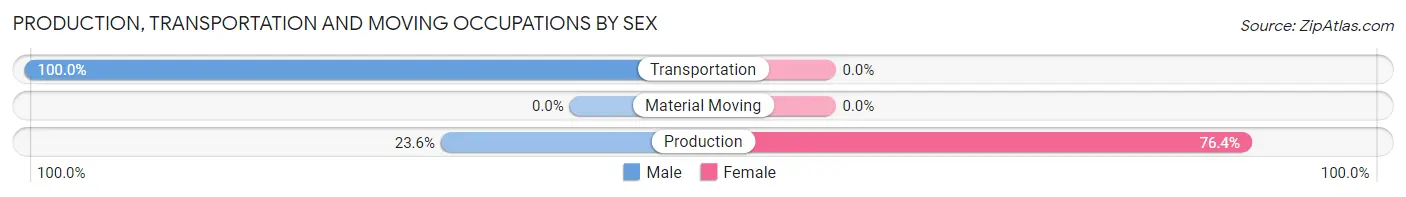
| Occupation | Male | Female |
| Production | 13 (23.6%) | 42 (76.4%) |
| Transportation | 19 (100.0%) | 0 (0.0%) |
| Material Moving | 0 (0.0%) | 0 (0.0%) |
| Total (Category) | 32 (43.2%) | 42 (56.8%) |
| Total (Overall) | 548 (61.5%) | 343 (38.5%) |
Employment Industries by Sex in Twain Harte
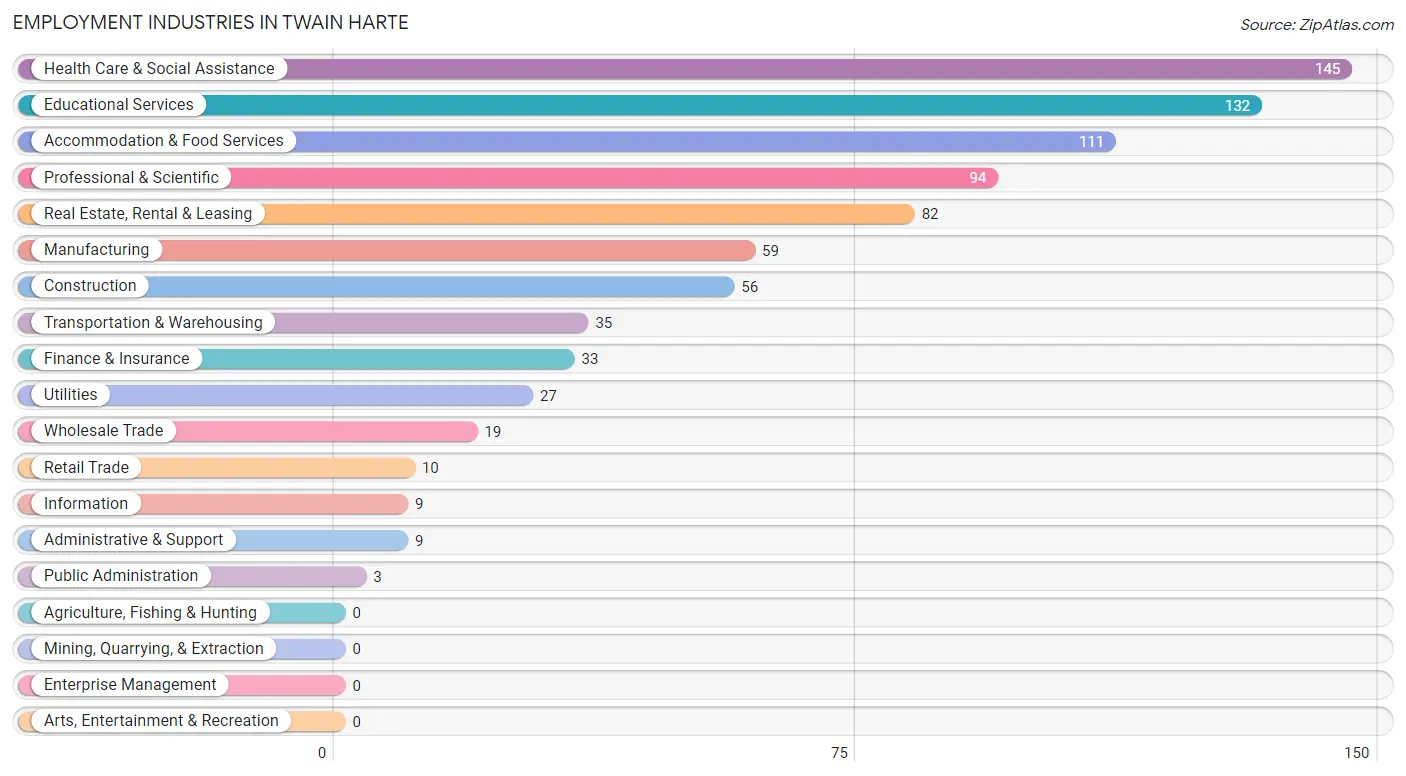
Employment Industries in Twain Harte
The major employment industries in Twain Harte include Health Care & Social Assistance (145 | 16.3%), Educational Services (132 | 14.8%), Accommodation & Food Services (111 | 12.5%), Professional & Scientific (94 | 10.5%), and Real Estate, Rental & Leasing (82 | 9.2%).
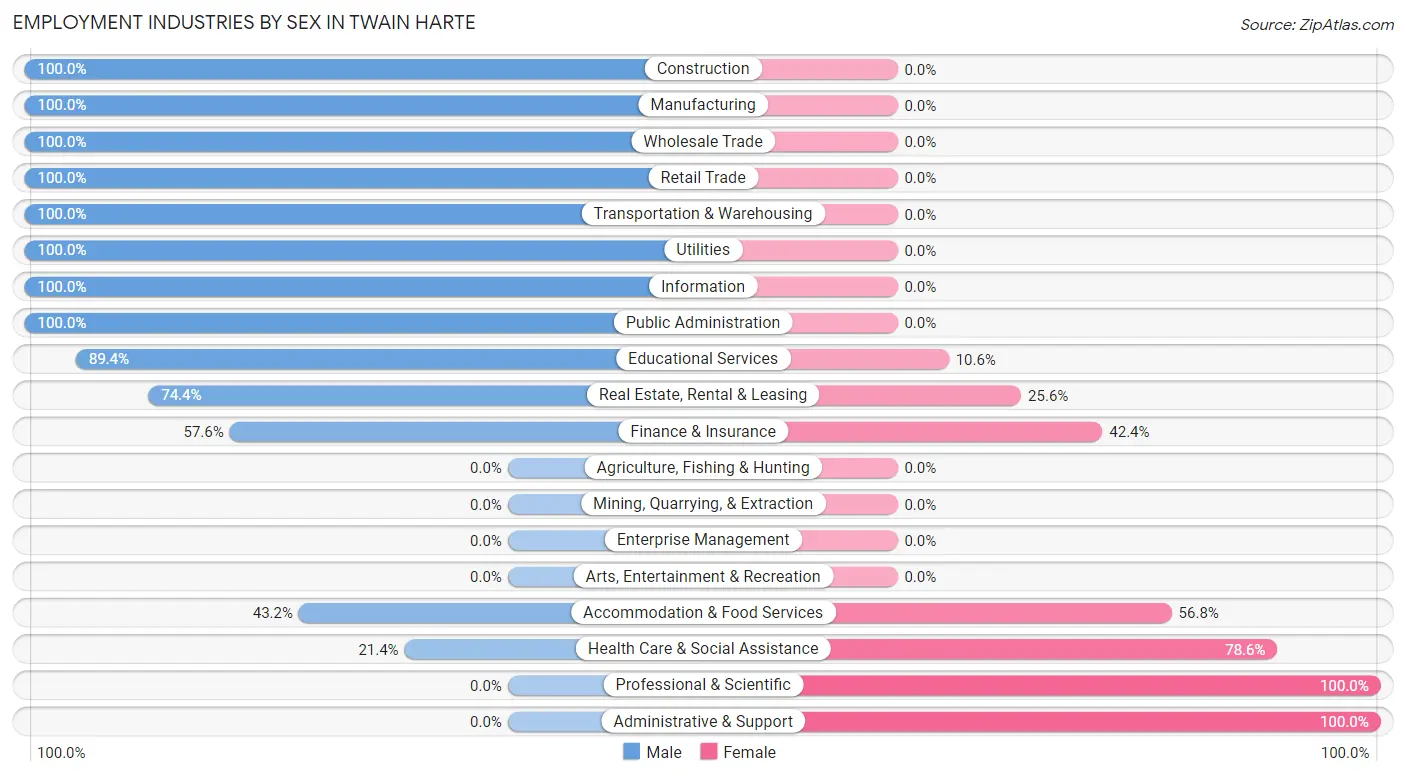
Employment Industries by Sex in Twain Harte
The Twain Harte industries that see more men than women are Construction (100.0%), Manufacturing (100.0%), and Wholesale Trade (100.0%), whereas the industries that tend to have a higher number of women are Professional & Scientific (100.0%), Administrative & Support (100.0%), and Health Care & Social Assistance (78.6%).
| Industry | Male | Female |
| Agriculture, Fishing & Hunting | 0 (0.0%) | 0 (0.0%) |
| Mining, Quarrying, & Extraction | 0 (0.0%) | 0 (0.0%) |
| Construction | 56 (100.0%) | 0 (0.0%) |
| Manufacturing | 59 (100.0%) | 0 (0.0%) |
| Wholesale Trade | 19 (100.0%) | 0 (0.0%) |
| Retail Trade | 10 (100.0%) | 0 (0.0%) |
| Transportation & Warehousing | 35 (100.0%) | 0 (0.0%) |
| Utilities | 27 (100.0%) | 0 (0.0%) |
| Information | 9 (100.0%) | 0 (0.0%) |
| Finance & Insurance | 19 (57.6%) | 14 (42.4%) |
| Real Estate, Rental & Leasing | 61 (74.4%) | 21 (25.6%) |
| Professional & Scientific | 0 (0.0%) | 94 (100.0%) |
| Enterprise Management | 0 (0.0%) | 0 (0.0%) |
| Administrative & Support | 0 (0.0%) | 9 (100.0%) |
| Educational Services | 118 (89.4%) | 14 (10.6%) |
| Health Care & Social Assistance | 31 (21.4%) | 114 (78.6%) |
| Arts, Entertainment & Recreation | 0 (0.0%) | 0 (0.0%) |
| Accommodation & Food Services | 48 (43.2%) | 63 (56.8%) |
| Public Administration | 3 (100.0%) | 0 (0.0%) |
| Total | 548 (61.5%) | 343 (38.5%) |
Education in Twain Harte
School Enrollment in Twain Harte
The most common levels of schooling among the 238 students in Twain Harte are college / undergraduate (104 | 43.7%), kindergarten (41 | 17.2%), and high school (27 | 11.3%).
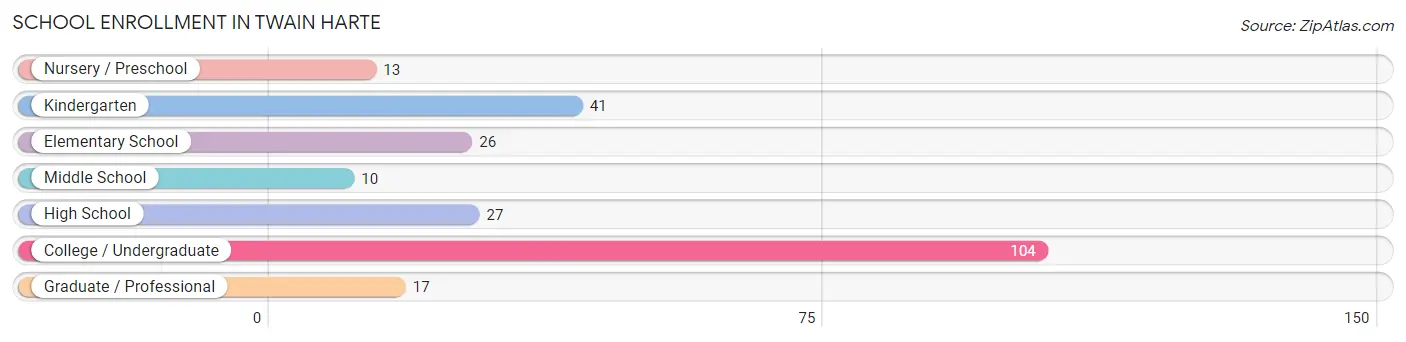
| School Level | # Students | % Students |
| Nursery / Preschool | 13 | 5.5% |
| Kindergarten | 41 | 17.2% |
| Elementary School | 26 | 10.9% |
| Middle School | 10 | 4.2% |
| High School | 27 | 11.3% |
| College / Undergraduate | 104 | 43.7% |
| Graduate / Professional | 17 | 7.1% |
| Total | 238 | 100.0% |
School Enrollment by Age by Funding Source in Twain Harte
Out of a total of 238 students who are enrolled in schools in Twain Harte, 52 (21.8%) attend a private institution, while the remaining 186 (78.2%) are enrolled in public schools. The age group of 15 to 17 year olds has the highest likelihood of being enrolled in private schools, with 27 (100.0% in the age bracket) enrolled. Conversely, the age group of 10 to 14 year olds has the lowest likelihood of being enrolled in a private school, with 10 (100.0% in the age bracket) attending a public institution.
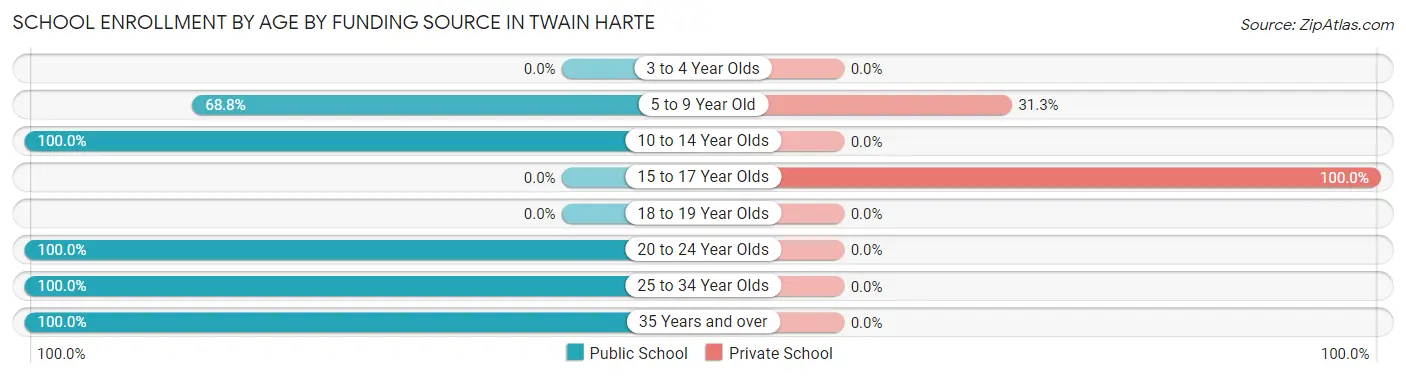
| Age Bracket | Public School | Private School |
| 3 to 4 Year Olds | 0 (0.0%) | 0 (0.0%) |
| 5 to 9 Year Old | 55 (68.8%) | 25 (31.2%) |
| 10 to 14 Year Olds | 10 (100.0%) | 0 (0.0%) |
| 15 to 17 Year Olds | 0 (0.0%) | 27 (100.0%) |
| 18 to 19 Year Olds | 0 (0.0%) | 0 (0.0%) |
| 20 to 24 Year Olds | 74 (100.0%) | 0 (0.0%) |
| 25 to 34 Year Olds | 14 (100.0%) | 0 (0.0%) |
| 35 Years and over | 33 (100.0%) | 0 (0.0%) |
| Total | 186 (78.2%) | 52 (21.8%) |
Educational Attainment by Field of Study in Twain Harte
Business (195 | 19.3%), education (137 | 13.6%), bio, nature & agricultural (106 | 10.5%), visual & performing arts (105 | 10.4%), and arts & humanities (77 | 7.6%) are the most common fields of study among 1,011 individuals in Twain Harte who have obtained a bachelor's degree or higher.
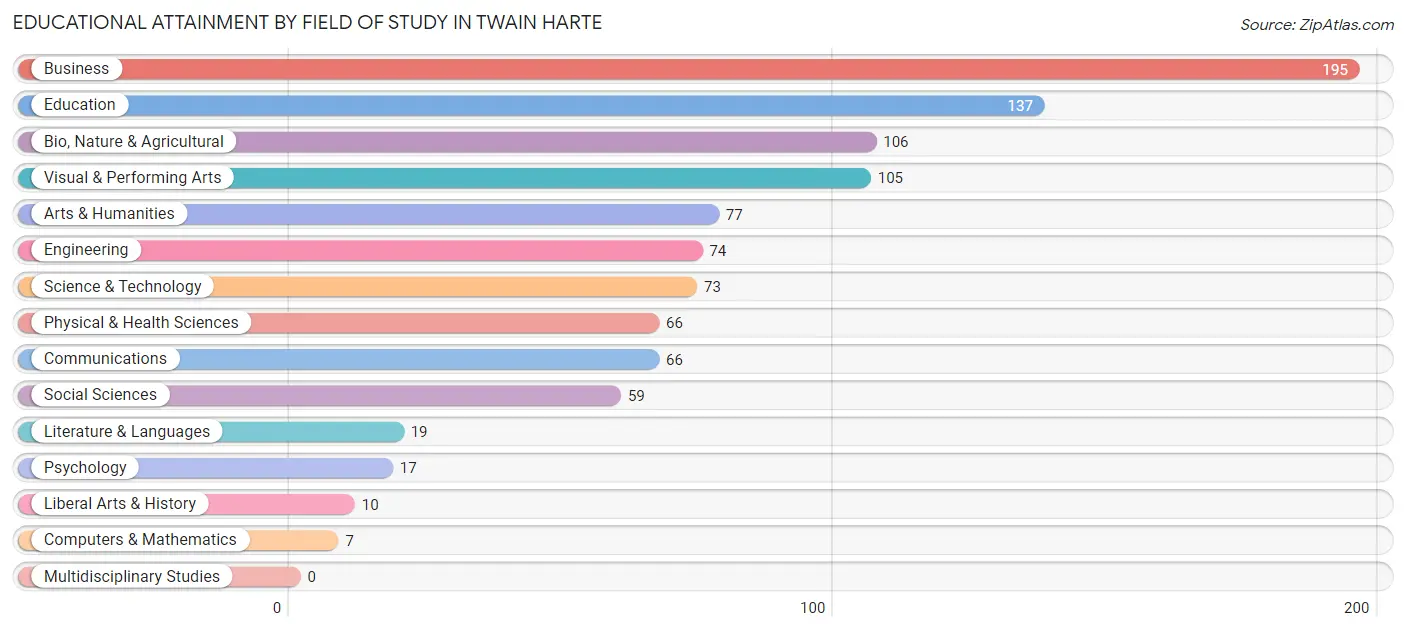
| Field of Study | # Graduates | % Graduates |
| Computers & Mathematics | 7 | 0.7% |
| Bio, Nature & Agricultural | 106 | 10.5% |
| Physical & Health Sciences | 66 | 6.5% |
| Psychology | 17 | 1.7% |
| Social Sciences | 59 | 5.8% |
| Engineering | 74 | 7.3% |
| Multidisciplinary Studies | 0 | 0.0% |
| Science & Technology | 73 | 7.2% |
| Business | 195 | 19.3% |
| Education | 137 | 13.6% |
| Literature & Languages | 19 | 1.9% |
| Liberal Arts & History | 10 | 1.0% |
| Visual & Performing Arts | 105 | 10.4% |
| Communications | 66 | 6.5% |
| Arts & Humanities | 77 | 7.6% |
| Total | 1,011 | 100.0% |
Transportation & Commute in Twain Harte
Vehicle Availability by Sex in Twain Harte
The most prevalent vehicle ownership categories in Twain Harte are males with 2 vehicles (355, accounting for 64.8%) and females with 2 vehicles (220, making up 103.5%).
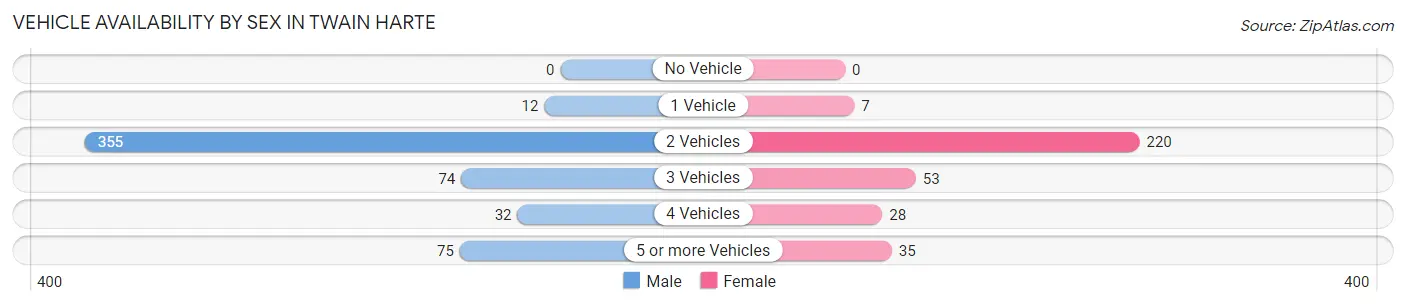
| Vehicles Available | Male | Female |
| No Vehicle | 0 (0.0%) | 0 (0.0%) |
| 1 Vehicle | 12 (2.2%) | 7 (2.0%) |
| 2 Vehicles | 355 (64.8%) | 220 (64.1%) |
| 3 Vehicles | 74 (13.5%) | 53 (15.4%) |
| 4 Vehicles | 32 (5.8%) | 28 (8.2%) |
| 5 or more Vehicles | 75 (13.7%) | 35 (10.2%) |
| Total | 548 (100.0%) | 343 (100.0%) |
Commute Time in Twain Harte
The most frequently occuring commute durations in Twain Harte are 15 to 19 minutes (222 commuters, 29.2%), 90 or more minutes (152 commuters, 20.0%), and 20 to 24 minutes (135 commuters, 17.7%).
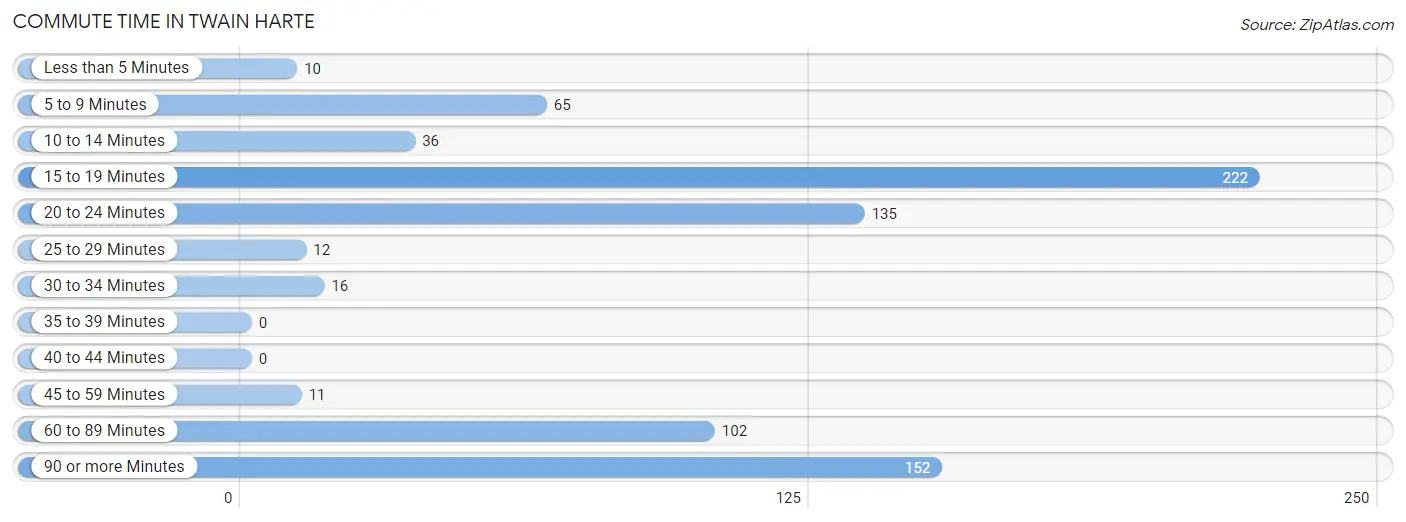
| Commute Time | # Commuters | % Commuters |
| Less than 5 Minutes | 10 | 1.3% |
| 5 to 9 Minutes | 65 | 8.5% |
| 10 to 14 Minutes | 36 | 4.7% |
| 15 to 19 Minutes | 222 | 29.2% |
| 20 to 24 Minutes | 135 | 17.7% |
| 25 to 29 Minutes | 12 | 1.6% |
| 30 to 34 Minutes | 16 | 2.1% |
| 35 to 39 Minutes | 0 | 0.0% |
| 40 to 44 Minutes | 0 | 0.0% |
| 45 to 59 Minutes | 11 | 1.5% |
| 60 to 89 Minutes | 102 | 13.4% |
| 90 or more Minutes | 152 | 20.0% |
Commute Time by Sex in Twain Harte
The most common commute times in Twain Harte are 15 to 19 minutes (171 commuters, 39.9%) for males and 90 or more minutes (114 commuters, 34.3%) for females.
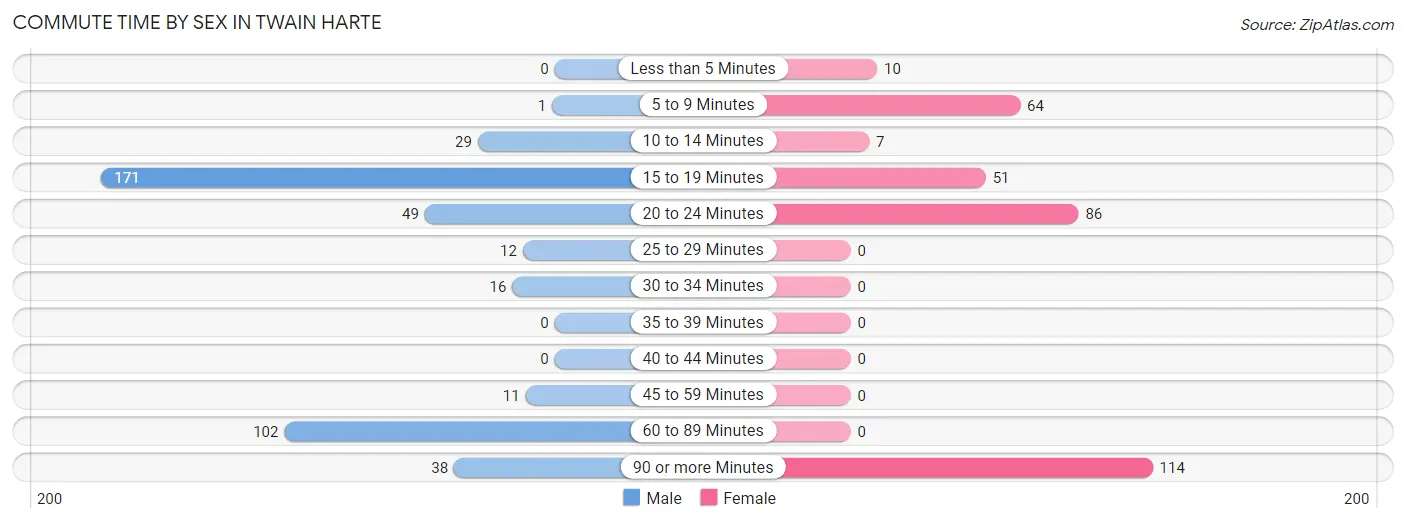
| Commute Time | Male | Female |
| Less than 5 Minutes | 0 (0.0%) | 10 (3.0%) |
| 5 to 9 Minutes | 1 (0.2%) | 64 (19.3%) |
| 10 to 14 Minutes | 29 (6.8%) | 7 (2.1%) |
| 15 to 19 Minutes | 171 (39.9%) | 51 (15.4%) |
| 20 to 24 Minutes | 49 (11.4%) | 86 (25.9%) |
| 25 to 29 Minutes | 12 (2.8%) | 0 (0.0%) |
| 30 to 34 Minutes | 16 (3.7%) | 0 (0.0%) |
| 35 to 39 Minutes | 0 (0.0%) | 0 (0.0%) |
| 40 to 44 Minutes | 0 (0.0%) | 0 (0.0%) |
| 45 to 59 Minutes | 11 (2.6%) | 0 (0.0%) |
| 60 to 89 Minutes | 102 (23.8%) | 0 (0.0%) |
| 90 or more Minutes | 38 (8.9%) | 114 (34.3%) |
Time of Departure to Work by Sex in Twain Harte
The most frequent times of departure to work in Twain Harte are 7:00 AM to 7:29 AM (169, 39.4%) for males and 7:00 AM to 7:29 AM (90, 27.1%) for females.
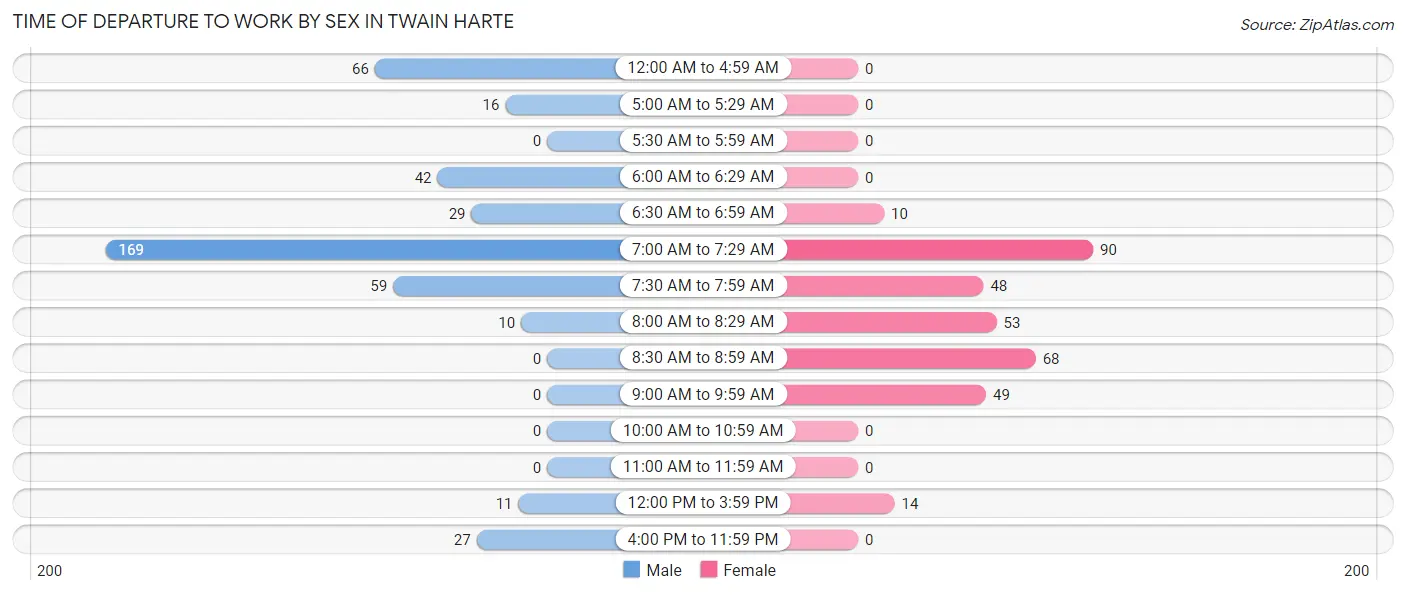
| Time of Departure | Male | Female |
| 12:00 AM to 4:59 AM | 66 (15.4%) | 0 (0.0%) |
| 5:00 AM to 5:29 AM | 16 (3.7%) | 0 (0.0%) |
| 5:30 AM to 5:59 AM | 0 (0.0%) | 0 (0.0%) |
| 6:00 AM to 6:29 AM | 42 (9.8%) | 0 (0.0%) |
| 6:30 AM to 6:59 AM | 29 (6.8%) | 10 (3.0%) |
| 7:00 AM to 7:29 AM | 169 (39.4%) | 90 (27.1%) |
| 7:30 AM to 7:59 AM | 59 (13.8%) | 48 (14.5%) |
| 8:00 AM to 8:29 AM | 10 (2.3%) | 53 (16.0%) |
| 8:30 AM to 8:59 AM | 0 (0.0%) | 68 (20.5%) |
| 9:00 AM to 9:59 AM | 0 (0.0%) | 49 (14.8%) |
| 10:00 AM to 10:59 AM | 0 (0.0%) | 0 (0.0%) |
| 11:00 AM to 11:59 AM | 0 (0.0%) | 0 (0.0%) |
| 12:00 PM to 3:59 PM | 11 (2.6%) | 14 (4.2%) |
| 4:00 PM to 11:59 PM | 27 (6.3%) | 0 (0.0%) |
| Total | 429 (100.0%) | 332 (100.0%) |
Housing Occupancy in Twain Harte
Occupancy by Ownership in Twain Harte
Of the total 1,010 dwellings in Twain Harte, owner-occupied units account for 775 (76.7%), while renter-occupied units make up 235 (23.3%).
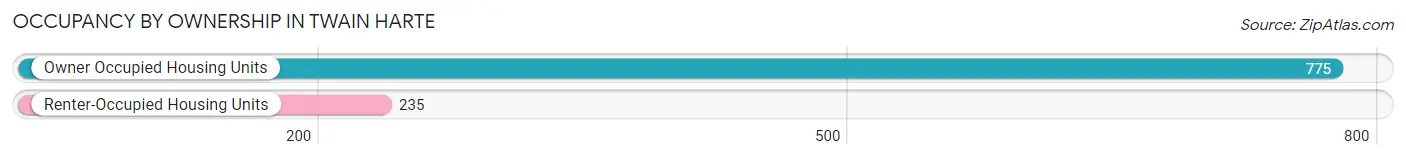
| Occupancy | # Housing Units | % Housing Units |
| Owner Occupied Housing Units | 775 | 76.7% |
| Renter-Occupied Housing Units | 235 | 23.3% |
| Total Occupied Housing Units | 1,010 | 100.0% |
Occupancy by Household Size in Twain Harte
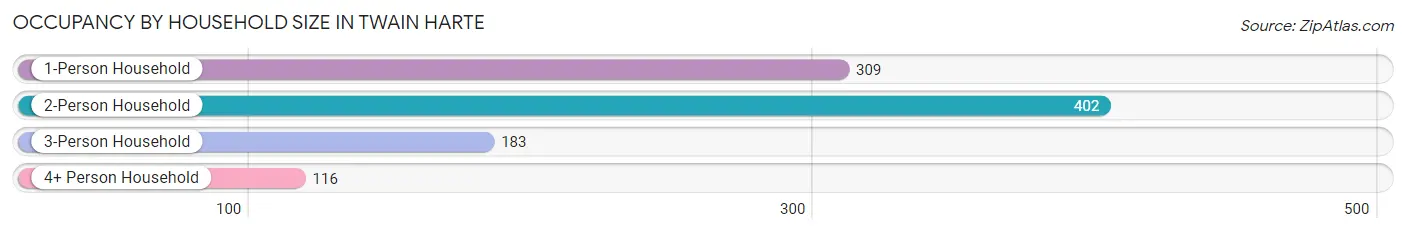
| Household Size | # Housing Units | % Housing Units |
| 1-Person Household | 309 | 30.6% |
| 2-Person Household | 402 | 39.8% |
| 3-Person Household | 183 | 18.1% |
| 4+ Person Household | 116 | 11.5% |
| Total Housing Units | 1,010 | 100.0% |
Occupancy by Ownership by Household Size in Twain Harte
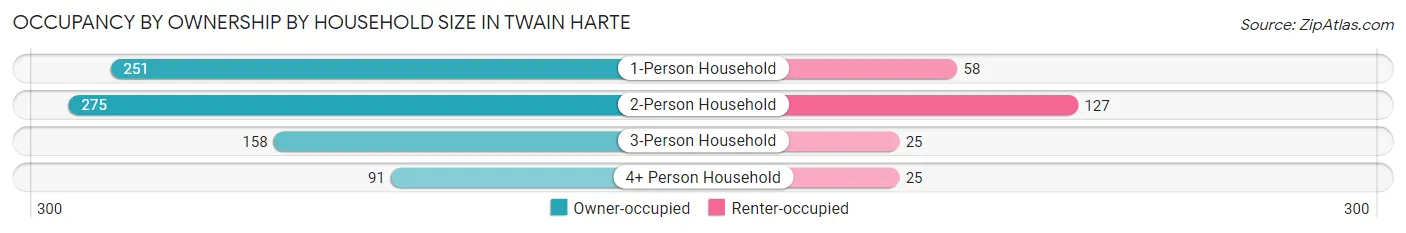
| Household Size | Owner-occupied | Renter-occupied |
| 1-Person Household | 251 (81.2%) | 58 (18.8%) |
| 2-Person Household | 275 (68.4%) | 127 (31.6%) |
| 3-Person Household | 158 (86.3%) | 25 (13.7%) |
| 4+ Person Household | 91 (78.4%) | 25 (21.5%) |
| Total Housing Units | 775 (76.7%) | 235 (23.3%) |
Occupancy by Educational Attainment in Twain Harte
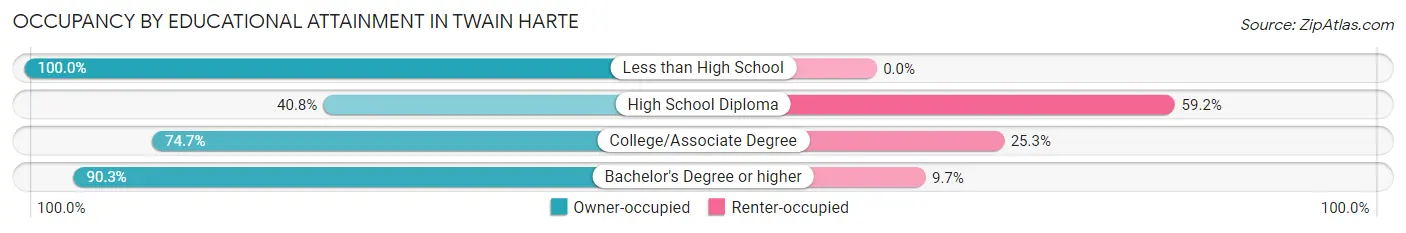
| Household Size | Owner-occupied | Renter-occupied |
| Less than High School | 6 (100.0%) | 0 (0.0%) |
| High School Diploma | 80 (40.8%) | 116 (59.2%) |
| College/Associate Degree | 195 (74.7%) | 66 (25.3%) |
| Bachelor's Degree or higher | 494 (90.3%) | 53 (9.7%) |
Occupancy by Age of Householder in Twain Harte
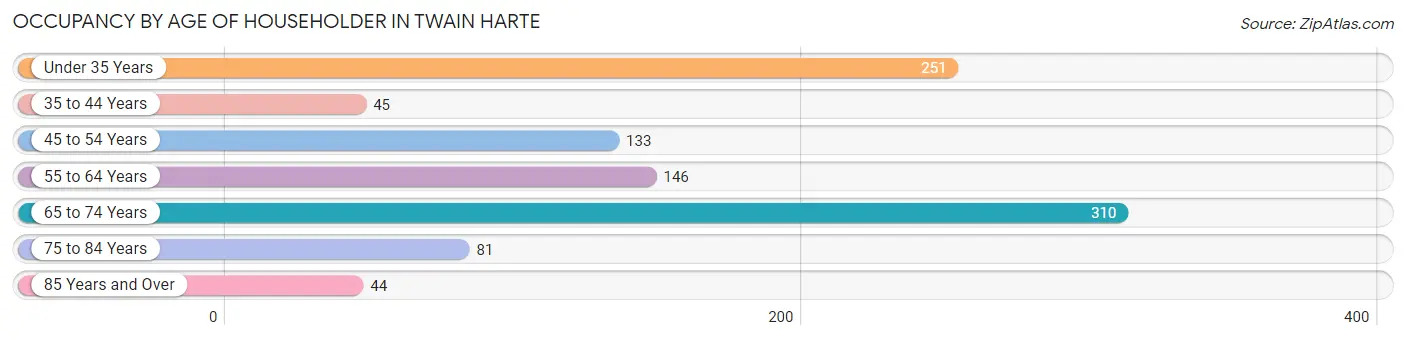
| Age Bracket | # Households | % Households |
| Under 35 Years | 251 | 24.8% |
| 35 to 44 Years | 45 | 4.5% |
| 45 to 54 Years | 133 | 13.2% |
| 55 to 64 Years | 146 | 14.5% |
| 65 to 74 Years | 310 | 30.7% |
| 75 to 84 Years | 81 | 8.0% |
| 85 Years and Over | 44 | 4.4% |
| Total | 1,010 | 100.0% |
Housing Finances in Twain Harte
Median Income by Occupancy in Twain Harte
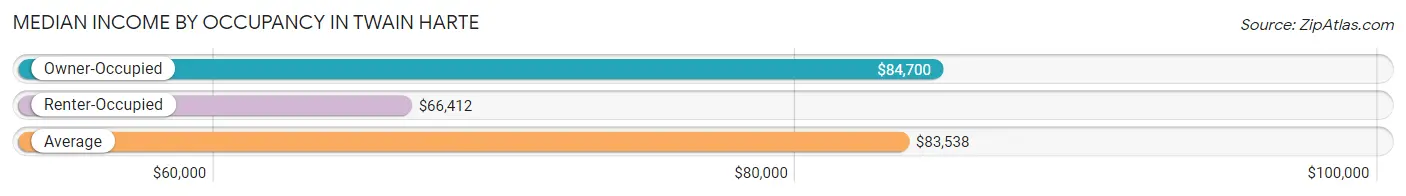
| Occupancy Type | # Households | Median Income |
| Owner-Occupied | 775 (76.7%) | $84,700 |
| Renter-Occupied | 235 (23.3%) | $66,412 |
| Average | 1,010 (100.0%) | $83,538 |
Occupancy by Householder Income Bracket in Twain Harte
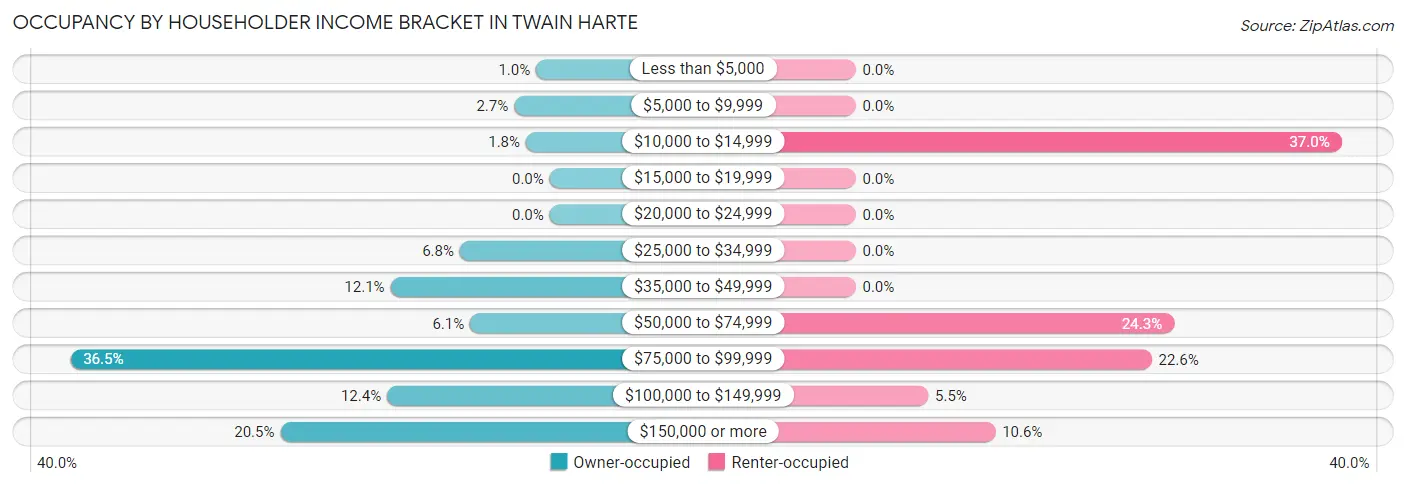
| Income Bracket | Owner-occupied | Renter-occupied |
| Less than $5,000 | 8 (1.0%) | 0 (0.0%) |
| $5,000 to $9,999 | 21 (2.7%) | 0 (0.0%) |
| $10,000 to $14,999 | 14 (1.8%) | 87 (37.0%) |
| $15,000 to $19,999 | 0 (0.0%) | 0 (0.0%) |
| $20,000 to $24,999 | 0 (0.0%) | 0 (0.0%) |
| $25,000 to $34,999 | 53 (6.8%) | 0 (0.0%) |
| $35,000 to $49,999 | 94 (12.1%) | 0 (0.0%) |
| $50,000 to $74,999 | 47 (6.1%) | 57 (24.3%) |
| $75,000 to $99,999 | 283 (36.5%) | 53 (22.6%) |
| $100,000 to $149,999 | 96 (12.4%) | 13 (5.5%) |
| $150,000 or more | 159 (20.5%) | 25 (10.6%) |
| Total | 775 (100.0%) | 235 (100.0%) |
Monthly Housing Cost Tiers in Twain Harte
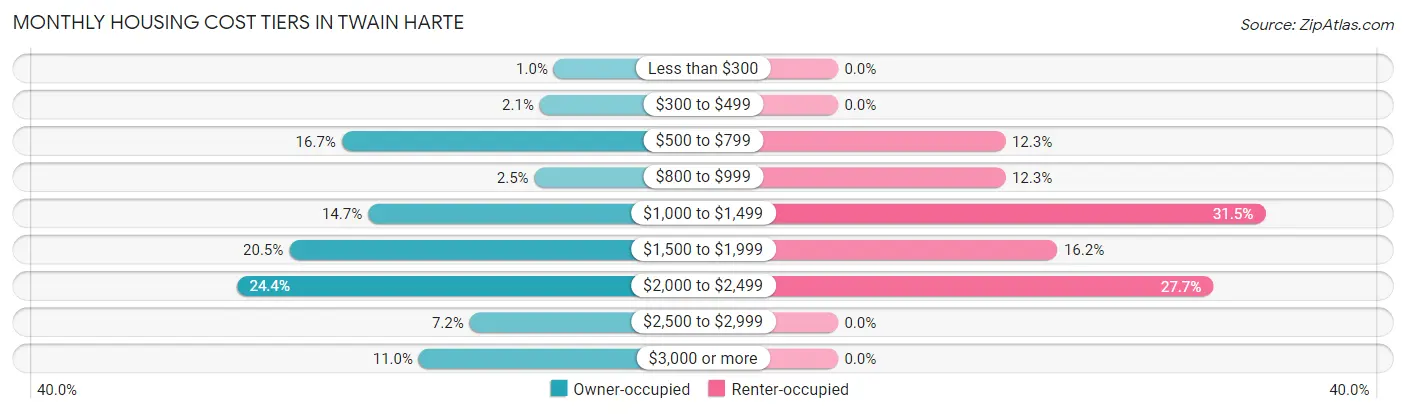
| Monthly Cost | Owner-occupied | Renter-occupied |
| Less than $300 | 8 (1.0%) | 0 (0.0%) |
| $300 to $499 | 16 (2.1%) | 0 (0.0%) |
| $500 to $799 | 129 (16.7%) | 29 (12.3%) |
| $800 to $999 | 19 (2.5%) | 29 (12.3%) |
| $1,000 to $1,499 | 114 (14.7%) | 74 (31.5%) |
| $1,500 to $1,999 | 159 (20.5%) | 38 (16.2%) |
| $2,000 to $2,499 | 189 (24.4%) | 65 (27.7%) |
| $2,500 to $2,999 | 56 (7.2%) | 0 (0.0%) |
| $3,000 or more | 85 (11.0%) | 0 (0.0%) |
| Total | 775 (100.0%) | 235 (100.0%) |
Physical Housing Characteristics in Twain Harte
Housing Structures in Twain Harte
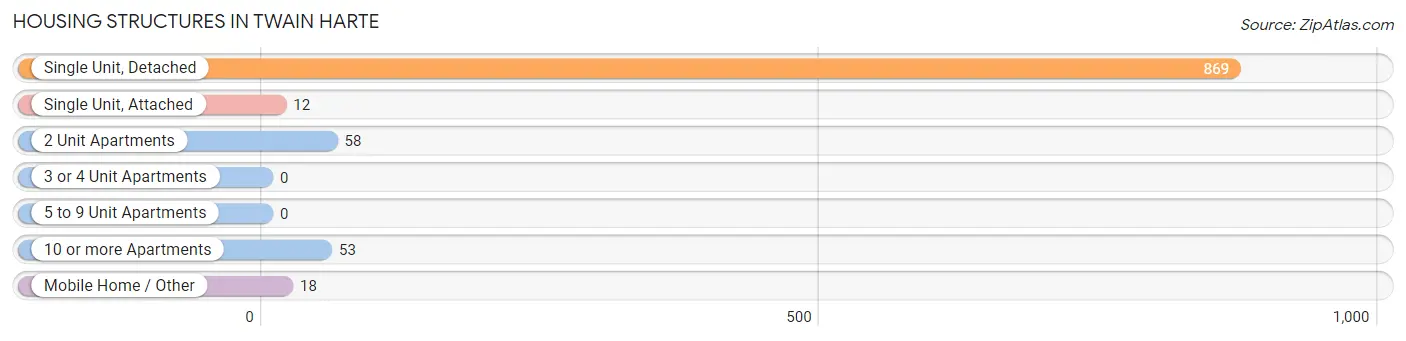
| Structure Type | # Housing Units | % Housing Units |
| Single Unit, Detached | 869 | 86.0% |
| Single Unit, Attached | 12 | 1.2% |
| 2 Unit Apartments | 58 | 5.7% |
| 3 or 4 Unit Apartments | 0 | 0.0% |
| 5 to 9 Unit Apartments | 0 | 0.0% |
| 10 or more Apartments | 53 | 5.2% |
| Mobile Home / Other | 18 | 1.8% |
| Total | 1,010 | 100.0% |
Housing Structures by Occupancy in Twain Harte
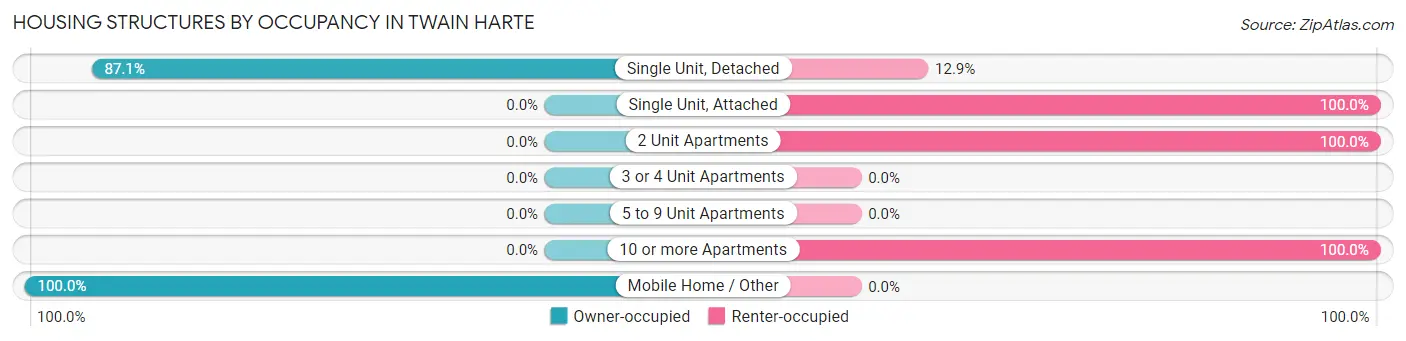
| Structure Type | Owner-occupied | Renter-occupied |
| Single Unit, Detached | 757 (87.1%) | 112 (12.9%) |
| Single Unit, Attached | 0 (0.0%) | 12 (100.0%) |
| 2 Unit Apartments | 0 (0.0%) | 58 (100.0%) |
| 3 or 4 Unit Apartments | 0 (0.0%) | 0 (0.0%) |
| 5 to 9 Unit Apartments | 0 (0.0%) | 0 (0.0%) |
| 10 or more Apartments | 0 (0.0%) | 53 (100.0%) |
| Mobile Home / Other | 18 (100.0%) | 0 (0.0%) |
| Total | 775 (76.7%) | 235 (23.3%) |
Housing Structures by Number of Rooms in Twain Harte
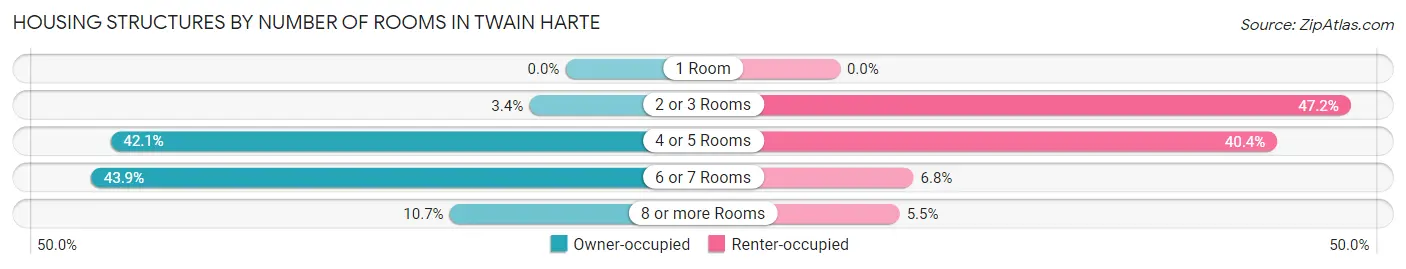
| Number of Rooms | Owner-occupied | Renter-occupied |
| 1 Room | 0 (0.0%) | 0 (0.0%) |
| 2 or 3 Rooms | 26 (3.4%) | 111 (47.2%) |
| 4 or 5 Rooms | 326 (42.1%) | 95 (40.4%) |
| 6 or 7 Rooms | 340 (43.9%) | 16 (6.8%) |
| 8 or more Rooms | 83 (10.7%) | 13 (5.5%) |
| Total | 775 (100.0%) | 235 (100.0%) |
Housing Structure by Heating Type in Twain Harte
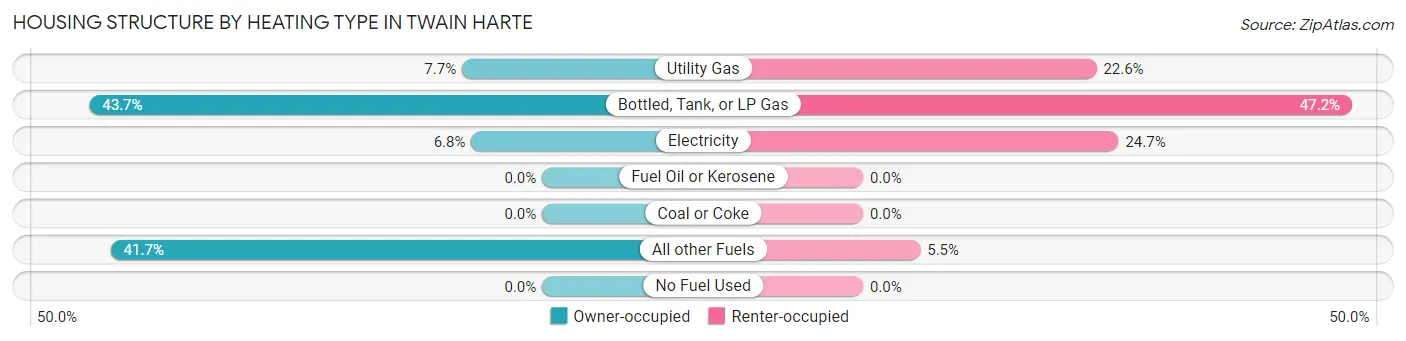
| Heating Type | Owner-occupied | Renter-occupied |
| Utility Gas | 60 (7.7%) | 53 (22.6%) |
| Bottled, Tank, or LP Gas | 339 (43.7%) | 111 (47.2%) |
| Electricity | 53 (6.8%) | 58 (24.7%) |
| Fuel Oil or Kerosene | 0 (0.0%) | 0 (0.0%) |
| Coal or Coke | 0 (0.0%) | 0 (0.0%) |
| All other Fuels | 323 (41.7%) | 13 (5.5%) |
| No Fuel Used | 0 (0.0%) | 0 (0.0%) |
| Total | 775 (100.0%) | 235 (100.0%) |
Household Vehicle Usage in Twain Harte
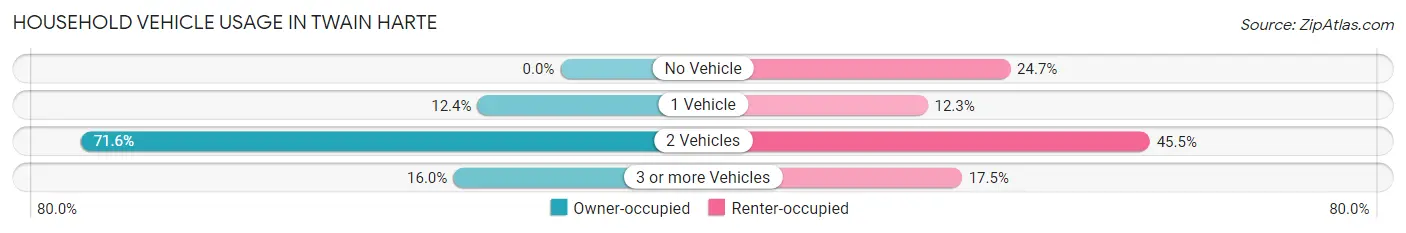
| Vehicles per Household | Owner-occupied | Renter-occupied |
| No Vehicle | 0 (0.0%) | 58 (24.7%) |
| 1 Vehicle | 96 (12.4%) | 29 (12.3%) |
| 2 Vehicles | 555 (71.6%) | 107 (45.5%) |
| 3 or more Vehicles | 124 (16.0%) | 41 (17.4%) |
| Total | 775 (100.0%) | 235 (100.0%) |
Real Estate & Mortgages in Twain Harte
Real Estate and Mortgage Overview in Twain Harte
| Characteristic | Without Mortgage | With Mortgage |
| Housing Units | 258 | 517 |
| Median Property Value | $497,700 | $393,500 |
| Median Household Income | - | - |
| Monthly Housing Costs | $773 | $85 |
| Real Estate Taxes | $2,656 | $55 |
Property Value by Mortgage Status in Twain Harte
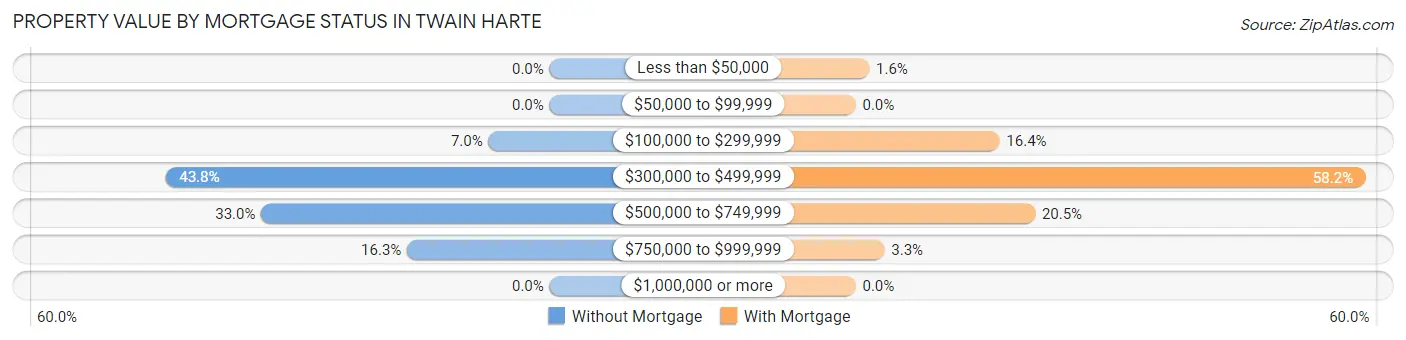
| Property Value | Without Mortgage | With Mortgage |
| Less than $50,000 | 0 (0.0%) | 8 (1.5%) |
| $50,000 to $99,999 | 0 (0.0%) | 0 (0.0%) |
| $100,000 to $299,999 | 18 (7.0%) | 85 (16.4%) |
| $300,000 to $499,999 | 113 (43.8%) | 301 (58.2%) |
| $500,000 to $749,999 | 85 (33.0%) | 106 (20.5%) |
| $750,000 to $999,999 | 42 (16.3%) | 17 (3.3%) |
| $1,000,000 or more | 0 (0.0%) | 0 (0.0%) |
| Total | 258 (100.0%) | 517 (100.0%) |
Household Income by Mortgage Status in Twain Harte
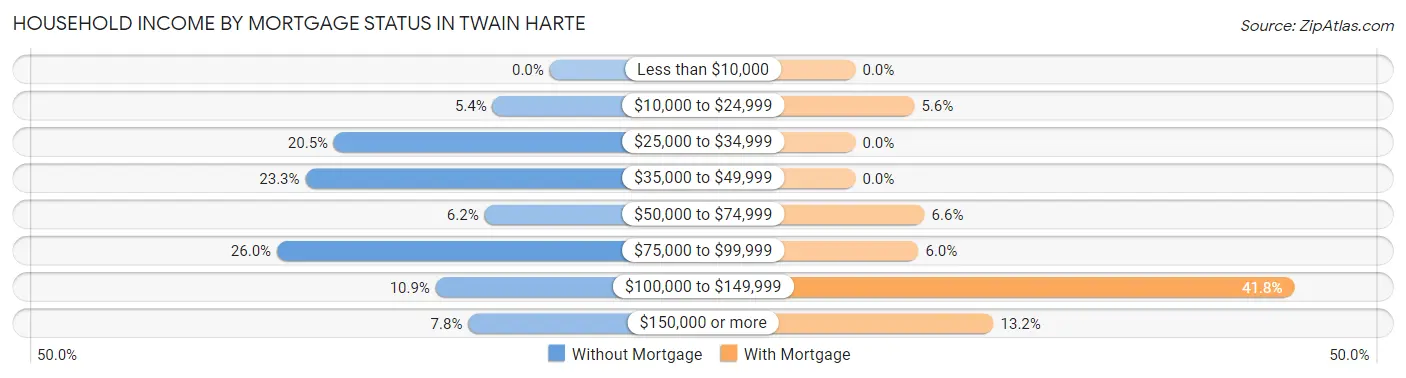
| Household Income | Without Mortgage | With Mortgage |
| Less than $10,000 | 0 (0.0%) | 0 (0.0%) |
| $10,000 to $24,999 | 14 (5.4%) | 29 (5.6%) |
| $25,000 to $34,999 | 53 (20.5%) | 0 (0.0%) |
| $35,000 to $49,999 | 60 (23.3%) | 0 (0.0%) |
| $50,000 to $74,999 | 16 (6.2%) | 34 (6.6%) |
| $75,000 to $99,999 | 67 (26.0%) | 31 (6.0%) |
| $100,000 to $149,999 | 28 (10.8%) | 216 (41.8%) |
| $150,000 or more | 20 (7.7%) | 68 (13.2%) |
| Total | 258 (100.0%) | 517 (100.0%) |
Property Value to Household Income Ratio in Twain Harte
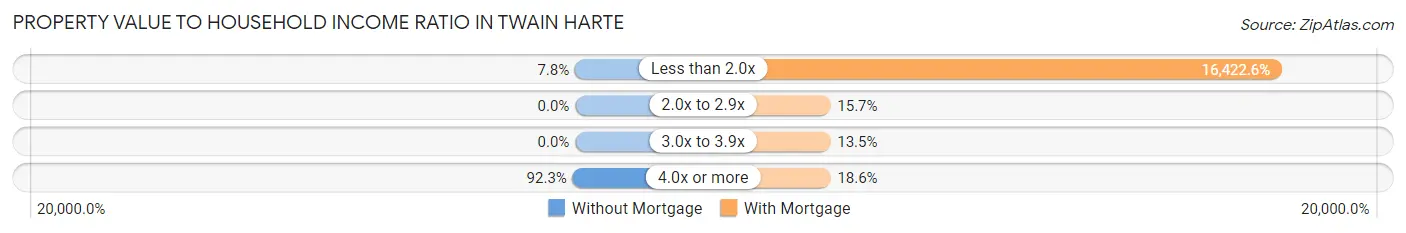
| Value-to-Income Ratio | Without Mortgage | With Mortgage |
| Less than 2.0x | 20 (7.7%) | 84,905 (16,422.6%) |
| 2.0x to 2.9x | 0 (0.0%) | 81 (15.7%) |
| 3.0x to 3.9x | 0 (0.0%) | 70 (13.5%) |
| 4.0x or more | 238 (92.2%) | 96 (18.6%) |
| Total | 258 (100.0%) | 517 (100.0%) |
Real Estate Taxes by Mortgage Status in Twain Harte
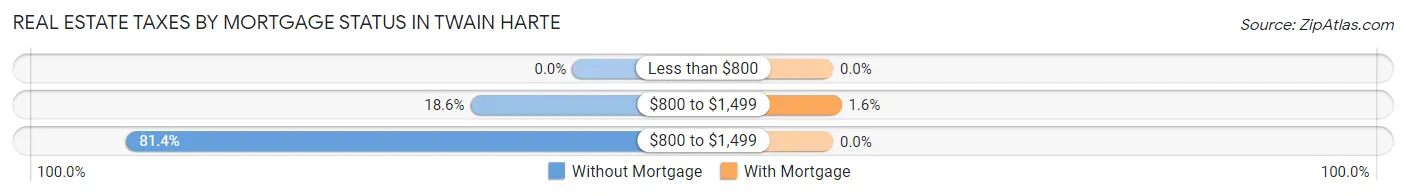
| Property Taxes | Without Mortgage | With Mortgage |
| Less than $800 | 0 (0.0%) | 0 (0.0%) |
| $800 to $1,499 | 48 (18.6%) | 8 (1.5%) |
| $800 to $1,499 | 210 (81.4%) | 0 (0.0%) |
| Total | 258 (100.0%) | 517 (100.0%) |
Health & Disability in Twain Harte
Health Insurance Coverage by Age in Twain Harte
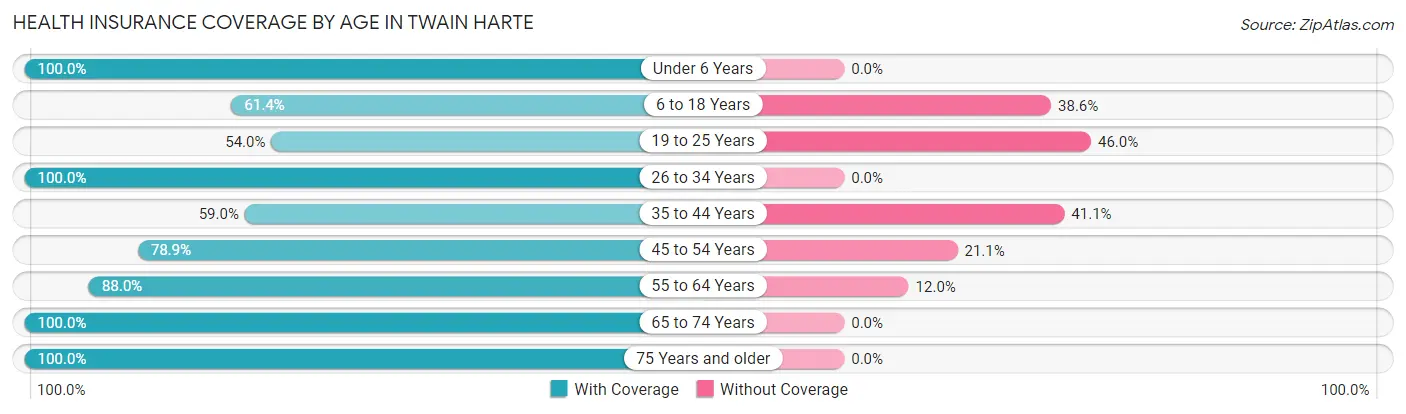
| Age Bracket | With Coverage | Without Coverage |
| Under 6 Years | 226 (100.0%) | 0 (0.0%) |
| 6 to 18 Years | 43 (61.4%) | 27 (38.6%) |
| 19 to 25 Years | 115 (54.0%) | 98 (46.0%) |
| 26 to 34 Years | 371 (100.0%) | 0 (0.0%) |
| 35 to 44 Years | 112 (59.0%) | 78 (41.0%) |
| 45 to 54 Years | 183 (78.9%) | 49 (21.1%) |
| 55 to 64 Years | 198 (88.0%) | 27 (12.0%) |
| 65 to 74 Years | 430 (100.0%) | 0 (0.0%) |
| 75 Years and older | 197 (100.0%) | 0 (0.0%) |
| Total | 1,875 (87.1%) | 279 (13.0%) |
Health Insurance Coverage by Citizenship Status in Twain Harte
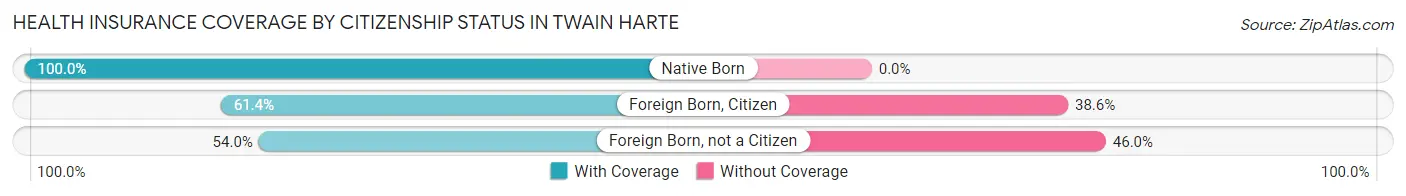
| Citizenship Status | With Coverage | Without Coverage |
| Native Born | 226 (100.0%) | 0 (0.0%) |
| Foreign Born, Citizen | 43 (61.4%) | 27 (38.6%) |
| Foreign Born, not a Citizen | 115 (54.0%) | 98 (46.0%) |
Health Insurance Coverage by Household Income in Twain Harte
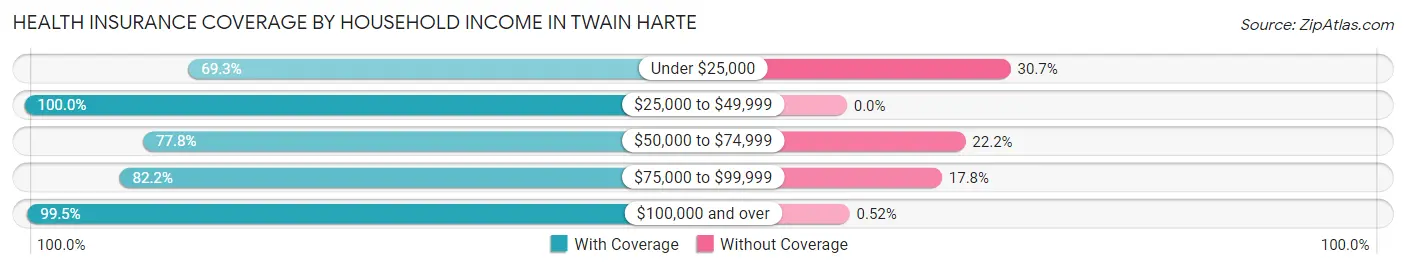
| Household Income | With Coverage | Without Coverage |
| Under $25,000 | 131 (69.3%) | 58 (30.7%) |
| $25,000 to $49,999 | 215 (100.0%) | 0 (0.0%) |
| $50,000 to $74,999 | 161 (77.8%) | 46 (22.2%) |
| $75,000 to $99,999 | 794 (82.2%) | 172 (17.8%) |
| $100,000 and over | 574 (99.5%) | 3 (0.5%) |
Public vs Private Health Insurance Coverage by Age in Twain Harte
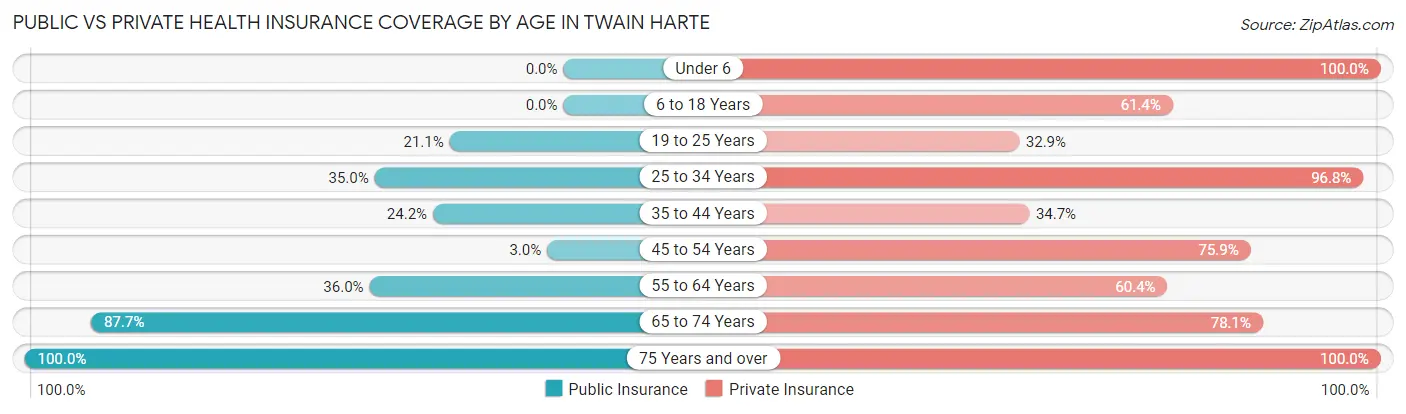
| Age Bracket | Public Insurance | Private Insurance |
| Under 6 | 0 (0.0%) | 226 (100.0%) |
| 6 to 18 Years | 0 (0.0%) | 43 (61.4%) |
| 19 to 25 Years | 45 (21.1%) | 70 (32.9%) |
| 25 to 34 Years | 130 (35.0%) | 359 (96.8%) |
| 35 to 44 Years | 46 (24.2%) | 66 (34.7%) |
| 45 to 54 Years | 7 (3.0%) | 176 (75.9%) |
| 55 to 64 Years | 81 (36.0%) | 136 (60.4%) |
| 65 to 74 Years | 377 (87.7%) | 336 (78.1%) |
| 75 Years and over | 197 (100.0%) | 197 (100.0%) |
| Total | 883 (41.0%) | 1,609 (74.7%) |
Disability Status by Sex by Age in Twain Harte
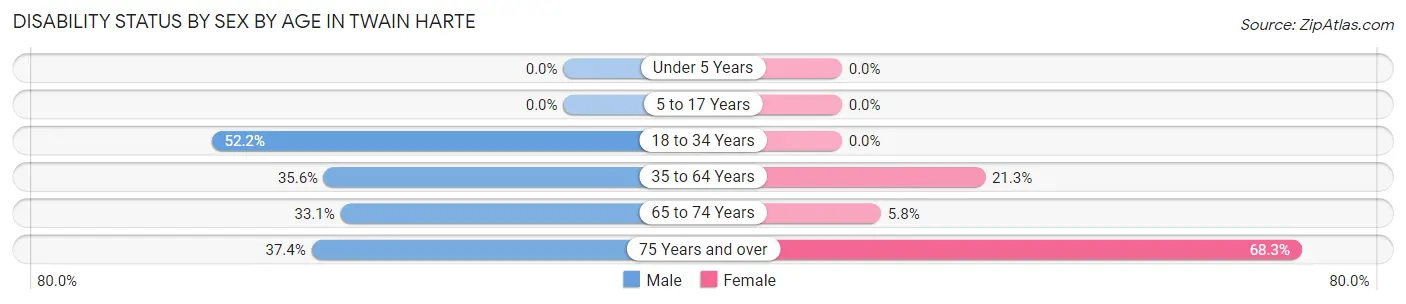
| Age Bracket | Male | Female |
| Under 5 Years | 0 (0.0%) | 0 (0.0%) |
| 5 to 17 Years | 0 (0.0%) | 0 (0.0%) |
| 18 to 34 Years | 176 (52.2%) | 0 (0.0%) |
| 35 to 64 Years | 123 (35.5%) | 64 (21.3%) |
| 65 to 74 Years | 91 (33.1%) | 9 (5.8%) |
| 75 Years and over | 43 (37.4%) | 56 (68.3%) |
Disability Class by Sex by Age in Twain Harte
Disability Class: Hearing Difficulty
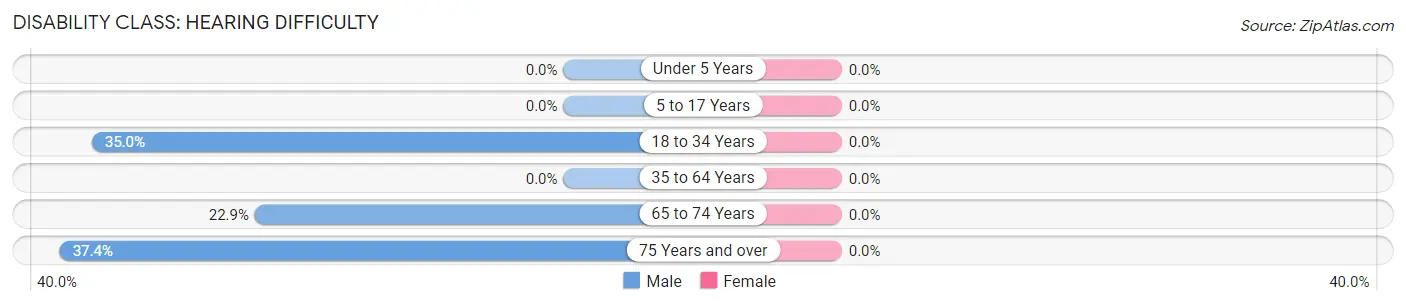
| Age Bracket | Male | Female |
| Under 5 Years | 0 (0.0%) | 0 (0.0%) |
| 5 to 17 Years | 0 (0.0%) | 0 (0.0%) |
| 18 to 34 Years | 118 (35.0%) | 0 (0.0%) |
| 35 to 64 Years | 0 (0.0%) | 0 (0.0%) |
| 65 to 74 Years | 63 (22.9%) | 0 (0.0%) |
| 75 Years and over | 43 (37.4%) | 0 (0.0%) |
Disability Class: Vision Difficulty
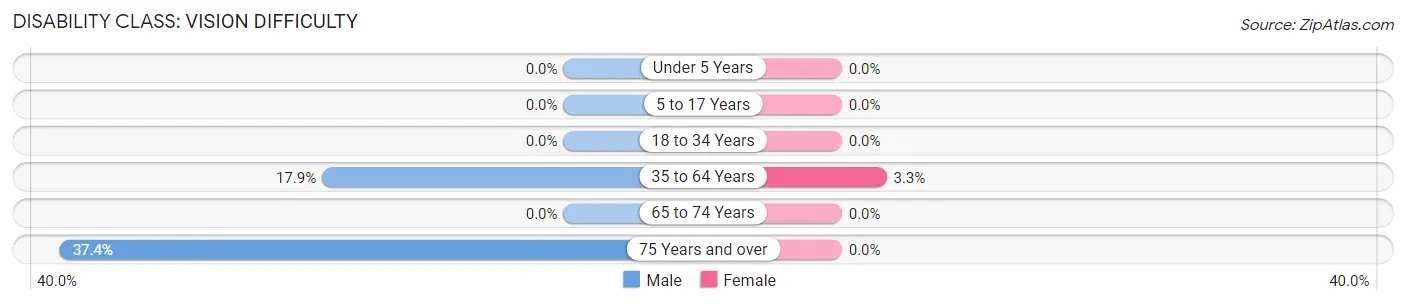
| Age Bracket | Male | Female |
| Under 5 Years | 0 (0.0%) | 0 (0.0%) |
| 5 to 17 Years | 0 (0.0%) | 0 (0.0%) |
| 18 to 34 Years | 0 (0.0%) | 0 (0.0%) |
| 35 to 64 Years | 62 (17.9%) | 10 (3.3%) |
| 65 to 74 Years | 0 (0.0%) | 0 (0.0%) |
| 75 Years and over | 43 (37.4%) | 0 (0.0%) |
Disability Class: Cognitive Difficulty
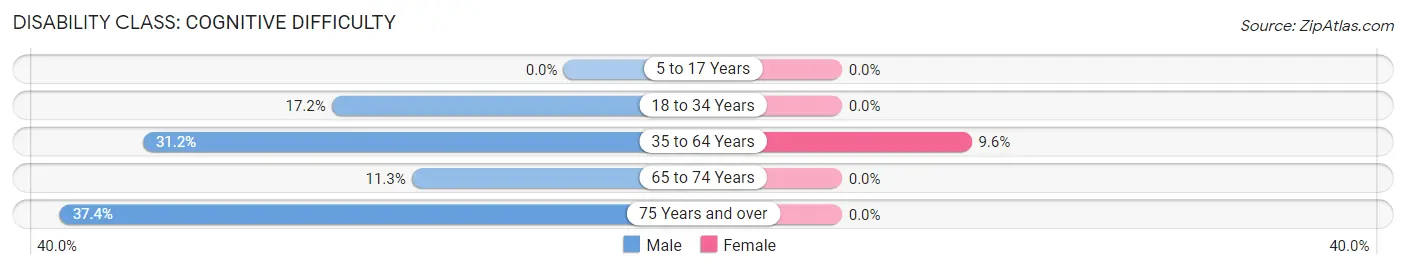
| Age Bracket | Male | Female |
| 5 to 17 Years | 0 (0.0%) | 0 (0.0%) |
| 18 to 34 Years | 58 (17.2%) | 0 (0.0%) |
| 35 to 64 Years | 108 (31.2%) | 29 (9.6%) |
| 65 to 74 Years | 31 (11.3%) | 0 (0.0%) |
| 75 Years and over | 43 (37.4%) | 0 (0.0%) |
Disability Class: Ambulatory Difficulty
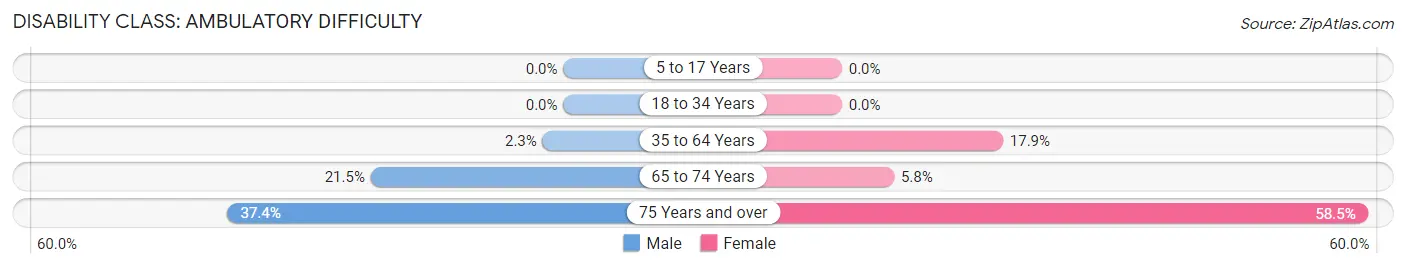
| Age Bracket | Male | Female |
| 5 to 17 Years | 0 (0.0%) | 0 (0.0%) |
| 18 to 34 Years | 0 (0.0%) | 0 (0.0%) |
| 35 to 64 Years | 8 (2.3%) | 54 (17.9%) |
| 65 to 74 Years | 59 (21.4%) | 9 (5.8%) |
| 75 Years and over | 43 (37.4%) | 48 (58.5%) |
Disability Class: Self-Care Difficulty
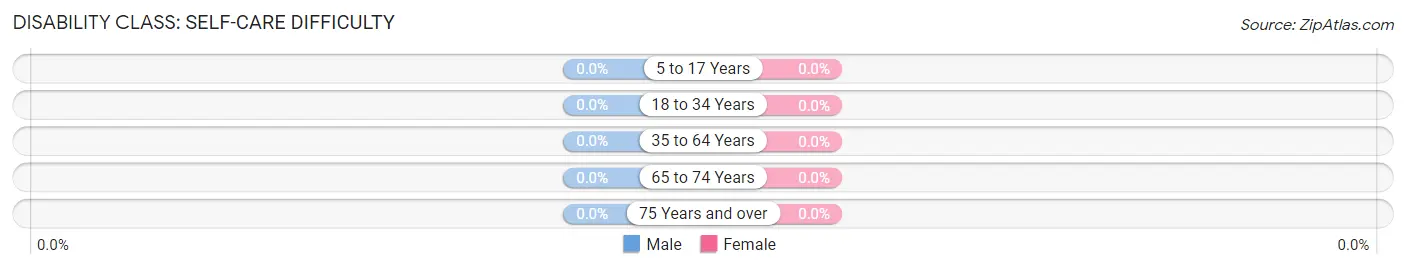
| Age Bracket | Male | Female |
| 5 to 17 Years | 0 (0.0%) | 0 (0.0%) |
| 18 to 34 Years | 0 (0.0%) | 0 (0.0%) |
| 35 to 64 Years | 0 (0.0%) | 0 (0.0%) |
| 65 to 74 Years | 0 (0.0%) | 0 (0.0%) |
| 75 Years and over | 0 (0.0%) | 0 (0.0%) |
Technology Access in Twain Harte
Computing Device Access in Twain Harte
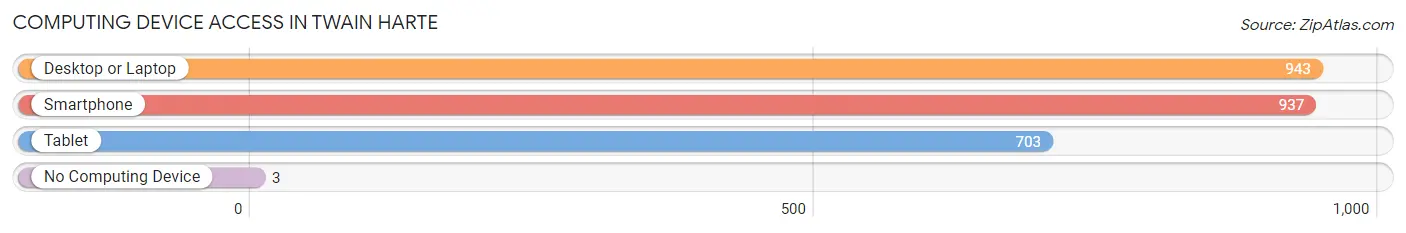
| Device Type | # Households | % Households |
| Desktop or Laptop | 943 | 93.4% |
| Smartphone | 937 | 92.8% |
| Tablet | 703 | 69.6% |
| No Computing Device | 3 | 0.3% |
| Total | 1,010 | 100.0% |
Internet Access in Twain Harte
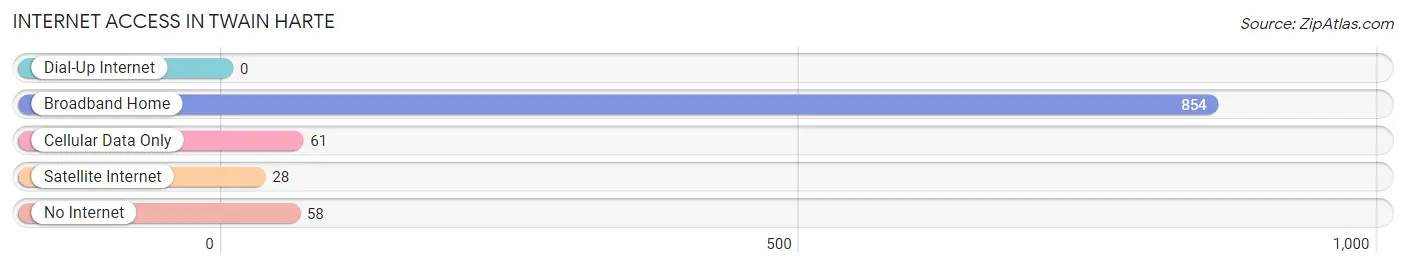
| Internet Type | # Households | % Households |
| Dial-Up Internet | 0 | 0.0% |
| Broadband Home | 854 | 84.6% |
| Cellular Data Only | 61 | 6.0% |
| Satellite Internet | 28 | 2.8% |
| No Internet | 58 | 5.7% |
| Total | 1,010 | 100.0% |
Twain Harte Summary
Twain Harte is a small mountain community located in Tuolumne County, California. It is situated in the Sierra Nevada Mountains, approximately four miles east of the city of Sonora. The town was founded in the late 1800s by two entrepreneurs, Mark Twain and Bret Harte, who wanted to create a resort destination for visitors to the area. The town has a population of approximately 1,500 people and is known for its picturesque mountain views, outdoor recreation opportunities, and quaint downtown area.
Geography
Twain Harte is located in the Sierra Nevada Mountains, approximately four miles east of the city of Sonora. The town is situated at an elevation of 2,500 feet and is surrounded by the Stanislaus National Forest. The area is known for its beautiful mountain views and is home to a variety of wildlife, including deer, bears, and mountain lions. The town is located near several popular recreational areas, including Pinecrest Lake, Dodge Ridge Ski Resort, and the Stanislaus River.
Economy
Twain Harte’s economy is largely based on tourism. The town is a popular destination for visitors to the Sierra Nevada Mountains, and it is home to a variety of lodging options, restaurants, and shops. The town is also home to several businesses that provide services to the local community, such as a grocery store, hardware store, and gas station.
Demographics
As of the 2010 census, the population of Twain Harte was 1,423. The racial makeup of the town was 94.3% White, 0.7% African American, 0.7% Native American, 0.7% Asian, 0.2% Pacific Islander, and 2.7% from other races. The median household income in the town was $45,000, and the median age was 44.
History
Twain Harte was founded in the late 1800s by two entrepreneurs, Mark Twain and Bret Harte. The two men wanted to create a resort destination for visitors to the area, and they named the town after themselves. The town quickly grew in popularity, and by the early 1900s, it had become a popular destination for tourists. The town was incorporated in 1949, and it has remained a popular destination for visitors to the Sierra Nevada Mountains ever since.
Common Questions
What is Per Capita Income in Twain Harte?
Per Capita income in Twain Harte is $75,244.
What is the Median Family Income in Twain Harte?
Median Family Income in Twain Harte is $84,185.
What is the Median Household income in Twain Harte?
Median Household Income in Twain Harte is $83,538.
What is Inequality or Gini Index in Twain Harte?
Inequality or Gini Index in Twain Harte is 0.62.
What is the Total Population of Twain Harte?
Total Population of Twain Harte is 2,154.
What is the Total Male Population of Twain Harte?
Total Male Population of Twain Harte is 1,309.
What is the Total Female Population of Twain Harte?
Total Female Population of Twain Harte is 845.
What is the Ratio of Males per 100 Females in Twain Harte?
There are 154.91 Males per 100 Females in Twain Harte.
What is the Ratio of Females per 100 Males in Twain Harte?
There are 64.55 Females per 100 Males in Twain Harte.
What is the Median Population Age in Twain Harte?
Median Population Age in Twain Harte is 47.4 Years.
What is the Average Family Size in Twain Harte
Average Family Size in Twain Harte is 2.6 People.
What is the Average Household Size in Twain Harte
Average Household Size in Twain Harte is 2.1 People.
How Large is the Labor Force in Twain Harte?
There are 973 People in the Labor Forcein in Twain Harte.
What is the Percentage of People in the Labor Force in Twain Harte?
51.6% of People are in the Labor Force in Twain Harte.
What is the Unemployment Rate in Twain Harte?
Unemployment Rate in Twain Harte is 8.3%.