Channel Islands Beach, CA Map & Demographics
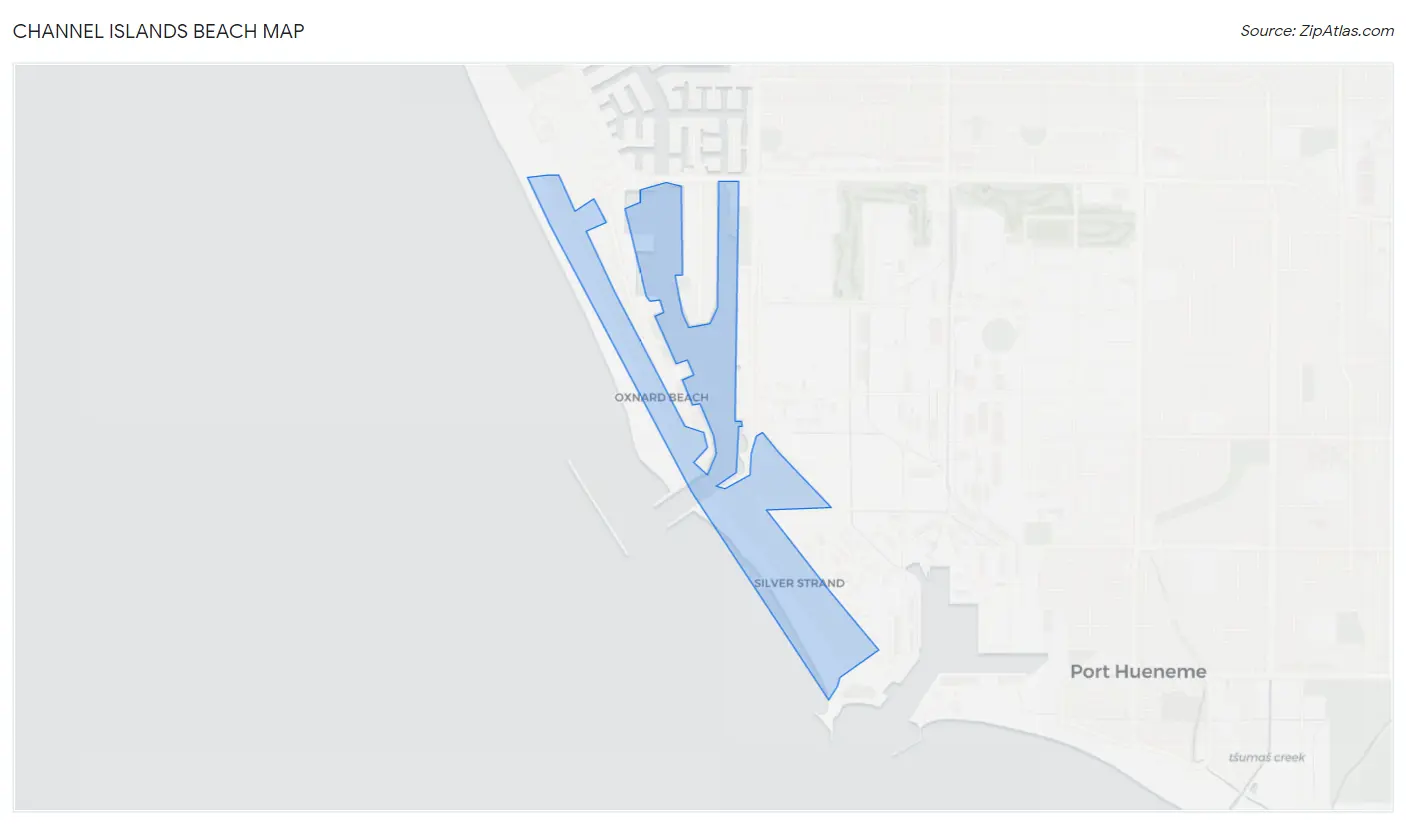
Channel Islands Beach Map
Channel Islands Beach Overview
$63,800
PER CAPITA INCOME
$83,603
AVG FAMILY INCOME
$95,250
AVG HOUSEHOLD INCOME
28.9%
WAGE / INCOME GAP [ % ]
71.1¢/ $1
WAGE / INCOME GAP [ $ ]
0.46
INEQUALITY / GINI INDEX
2,708
TOTAL POPULATION
1,239
MALE POPULATION
1,469
FEMALE POPULATION
84.34
MALES / 100 FEMALES
118.56
FEMALES / 100 MALES
44.4
MEDIAN AGE
2.4
AVG FAMILY SIZE
2.1
AVG HOUSEHOLD SIZE
1,562
LABOR FORCE [ PEOPLE ]
69.1%
PERCENT IN LABOR FORCE
2.8%
UNEMPLOYMENT RATE
Income in Channel Islands Beach
Income Overview in Channel Islands Beach
Per Capita Income in Channel Islands Beach is $63,800, while median incomes of families and households are $83,603 and $95,250 respectively.
| Characteristic | Number | Measure |
| Per Capita Income | 2,708 | $63,800 |
| Median Family Income | 837 | $83,603 |
| Mean Family Income | 837 | $151,781 |
| Median Household Income | 1,296 | $95,250 |
| Mean Household Income | 1,296 | $132,082 |
| Income Deficit | 837 | $0 |
| Wage / Income Gap (%) | 2,708 | 28.87% |
| Wage / Income Gap ($) | 2,708 | 71.13¢ per $1 |
| Gini / Inequality Index | 2,708 | 0.46 |
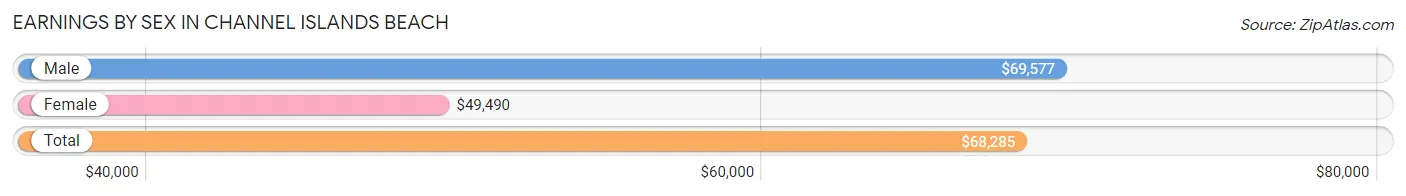
Earnings by Sex in Channel Islands Beach
Average Earnings in Channel Islands Beach are $68,285, $69,577 for men and $49,490 for women, a difference of 28.9%.
| Sex | Number | Average Earnings |
| Male | 938 (57.9%) | $69,577 |
| Female | 681 (42.1%) | $49,490 |
| Total | 1,619 (100.0%) | $68,285 |
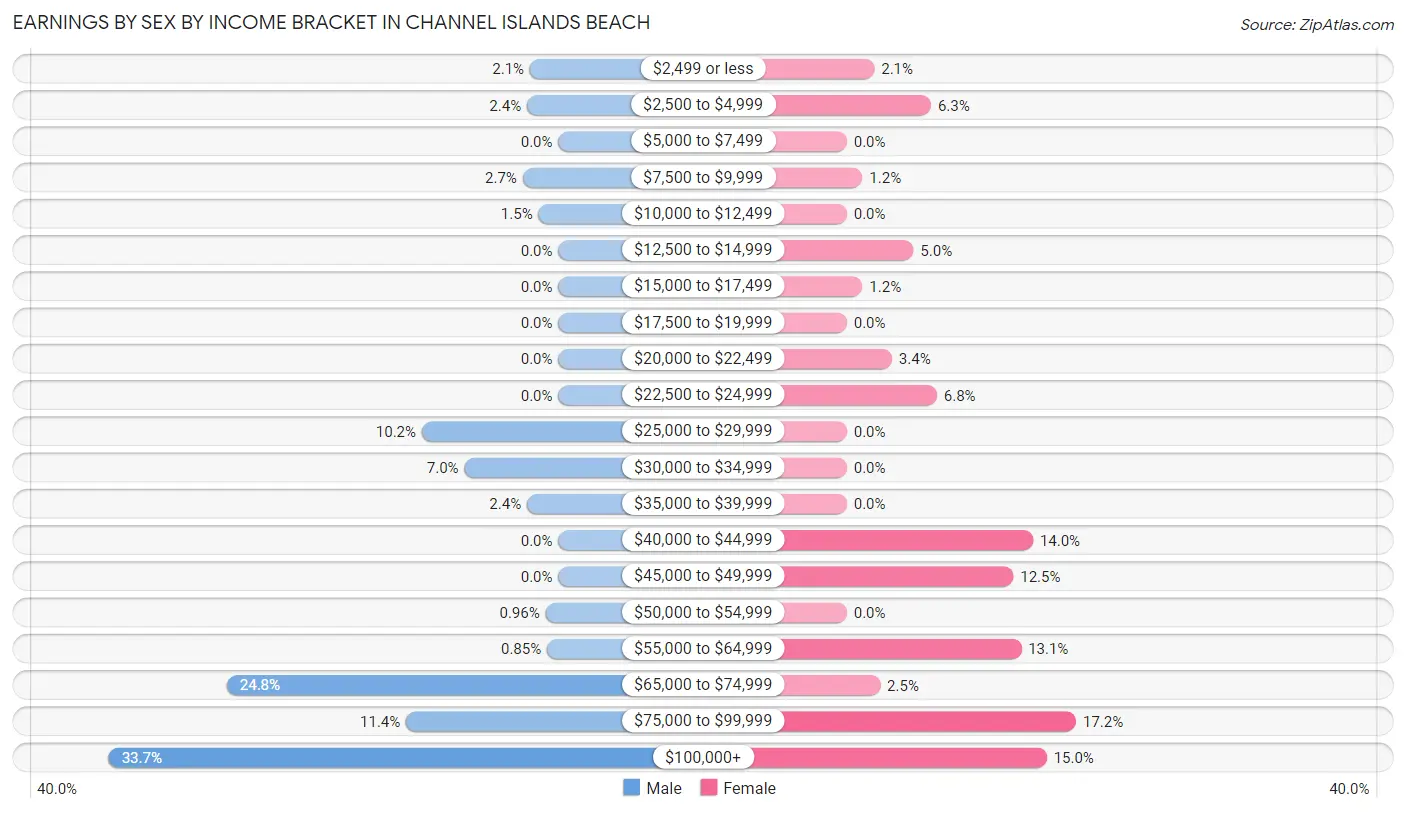
Earnings by Sex by Income Bracket in Channel Islands Beach
The most common earnings brackets in Channel Islands Beach are $100,000+ for men (316 | 33.7%) and $75,000 to $99,999 for women (117 | 17.2%).
| Income | Male | Female |
| $2,499 or less | 20 (2.1%) | 14 (2.1%) |
| $2,500 to $4,999 | 22 (2.4%) | 43 (6.3%) |
| $5,000 to $7,499 | 0 (0.0%) | 0 (0.0%) |
| $7,500 to $9,999 | 25 (2.7%) | 8 (1.2%) |
| $10,000 to $12,499 | 14 (1.5%) | 0 (0.0%) |
| $12,500 to $14,999 | 0 (0.0%) | 34 (5.0%) |
| $15,000 to $17,499 | 0 (0.0%) | 8 (1.2%) |
| $17,500 to $19,999 | 0 (0.0%) | 0 (0.0%) |
| $20,000 to $22,499 | 0 (0.0%) | 23 (3.4%) |
| $22,500 to $24,999 | 0 (0.0%) | 46 (6.8%) |
| $25,000 to $29,999 | 96 (10.2%) | 0 (0.0%) |
| $30,000 to $34,999 | 66 (7.0%) | 0 (0.0%) |
| $35,000 to $39,999 | 22 (2.4%) | 0 (0.0%) |
| $40,000 to $44,999 | 0 (0.0%) | 95 (14.0%) |
| $45,000 to $49,999 | 0 (0.0%) | 85 (12.5%) |
| $50,000 to $54,999 | 9 (1.0%) | 0 (0.0%) |
| $55,000 to $64,999 | 8 (0.9%) | 89 (13.1%) |
| $65,000 to $74,999 | 233 (24.8%) | 17 (2.5%) |
| $75,000 to $99,999 | 107 (11.4%) | 117 (17.2%) |
| $100,000+ | 316 (33.7%) | 102 (15.0%) |
| Total | 938 (100.0%) | 681 (100.0%) |
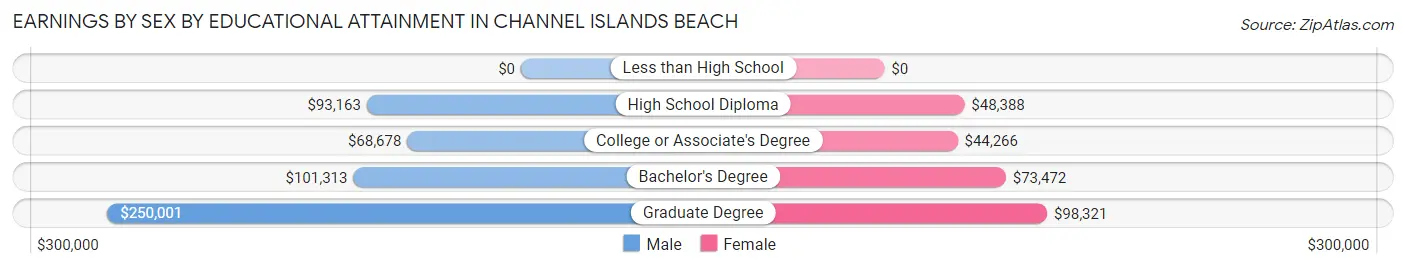
Earnings by Sex by Educational Attainment in Channel Islands Beach
Average earnings in Channel Islands Beach are $69,825 for men and $55,472 for women, a difference of 20.6%. Men with an educational attainment of graduate degree enjoy the highest average annual earnings of $250,001, while those with college or associate's degree education earn the least with $68,678. Women with an educational attainment of graduate degree earn the most with the average annual earnings of $98,321, while those with college or associate's degree education have the smallest earnings of $44,266.
| Educational Attainment | Male Income | Female Income |
| Less than High School | - | - |
| High School Diploma | $93,163 | $48,388 |
| College or Associate's Degree | $68,678 | $44,266 |
| Bachelor's Degree | $101,313 | $73,472 |
| Graduate Degree | $250,001 | $98,321 |
| Total | $69,825 | $55,472 |
Family Income in Channel Islands Beach
Family Income Brackets in Channel Islands Beach
According to the Channel Islands Beach family income data, there are 352 families falling into the $50,000 to $74,999 income range, which is the most common income bracket and makes up 42.0% of all families.
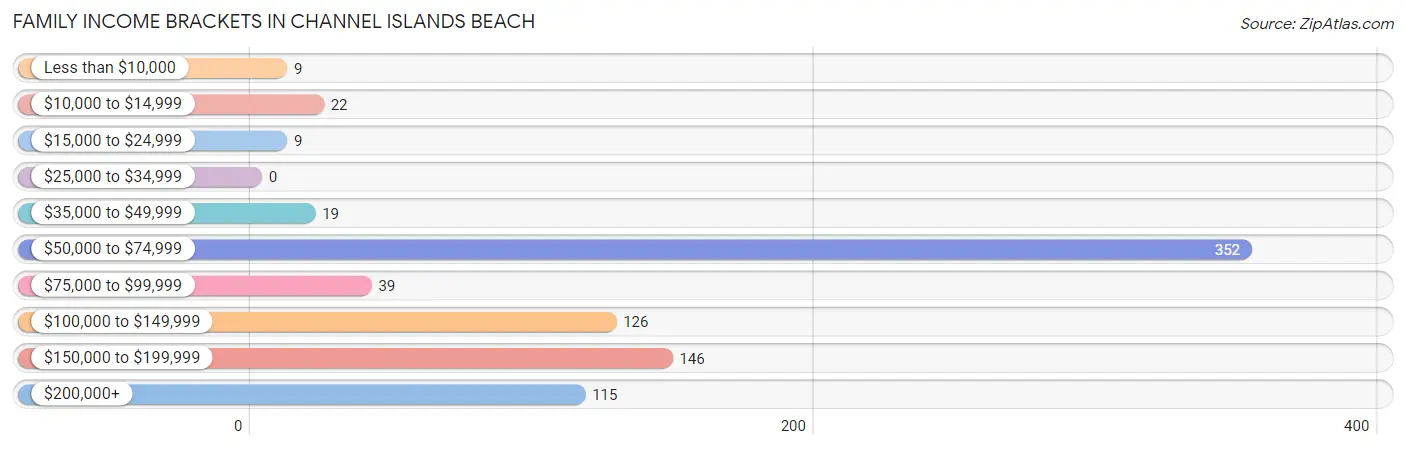
| Income Bracket | # Families | % Families |
| Less than $10,000 | 9 | 1.1% |
| $10,000 to $14,999 | 22 | 2.6% |
| $15,000 to $24,999 | 9 | 1.1% |
| $25,000 to $34,999 | 0 | 0.0% |
| $35,000 to $49,999 | 19 | 2.3% |
| $50,000 to $74,999 | 352 | 42.1% |
| $75,000 to $99,999 | 39 | 4.7% |
| $100,000 to $149,999 | 126 | 15.1% |
| $150,000 to $199,999 | 146 | 17.4% |
| $200,000+ | 115 | 13.7% |
Family Income by Famaliy Size in Channel Islands Beach
3-person families (74 | 8.8%) account for the highest median family income in Channel Islands Beach with $106,888 per family, while 3-person families (74 | 8.8%) have the highest median income of $35,629 per family member.
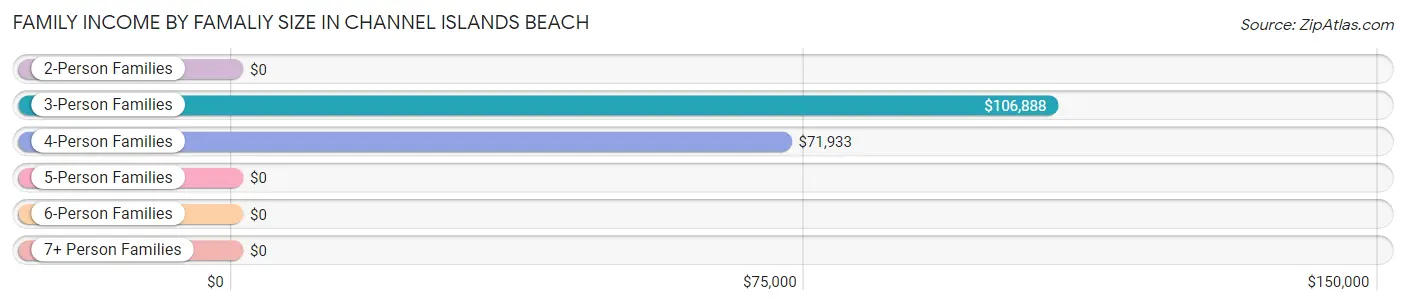
| Income Bracket | # Families | Median Income |
| 2-Person Families | 630 (75.3%) | $0 |
| 3-Person Families | 74 (8.8%) | $106,888 |
| 4-Person Families | 133 (15.9%) | $71,933 |
| 5-Person Families | 0 (0.0%) | $0 |
| 6-Person Families | 0 (0.0%) | $0 |
| 7+ Person Families | 0 (0.0%) | $0 |
| Total | 837 (100.0%) | $83,603 |
Family Income by Number of Earners in Channel Islands Beach
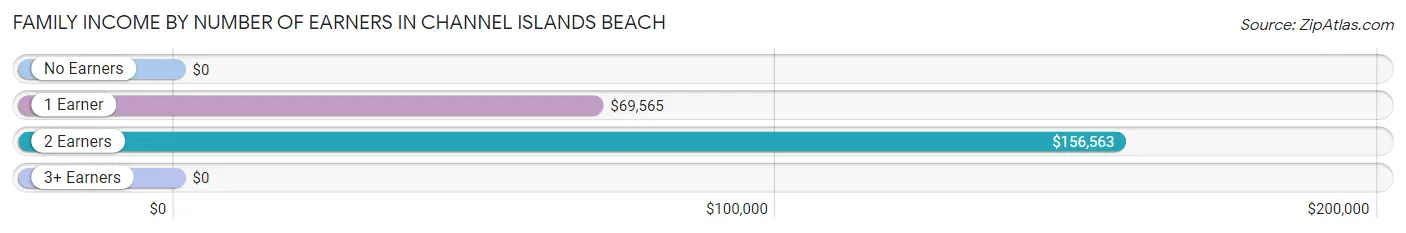
| Number of Earners | # Families | Median Income |
| No Earners | 112 (13.4%) | $0 |
| 1 Earner | 450 (53.8%) | $69,565 |
| 2 Earners | 258 (30.8%) | $156,563 |
| 3+ Earners | 17 (2.0%) | $0 |
| Total | 837 (100.0%) | $83,603 |
Household Income in Channel Islands Beach
Household Income Brackets in Channel Islands Beach
With 398 households falling in the category, the $50,000 to $74,999 income range is the most frequent in Channel Islands Beach, accounting for 30.7% of all households. In contrast, only 9 households (0.7%) fall into the $10,000 to $14,999 income bracket, making it the least populous group.
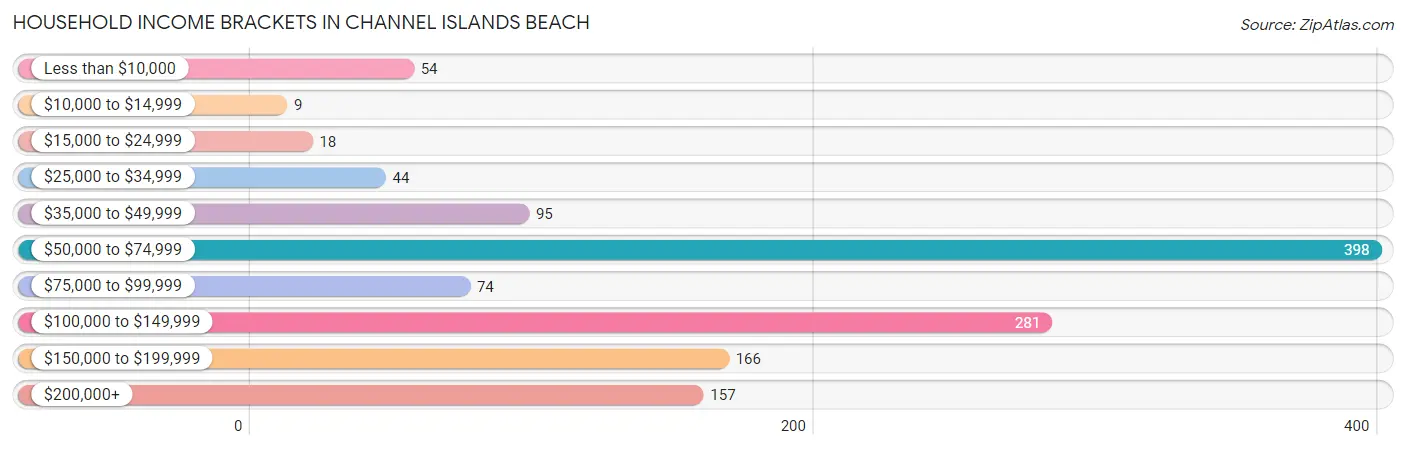
| Income Bracket | # Households | % Households |
| Less than $10,000 | 54 | 4.2% |
| $10,000 to $14,999 | 9 | 0.7% |
| $15,000 to $24,999 | 18 | 1.4% |
| $25,000 to $34,999 | 44 | 3.4% |
| $35,000 to $49,999 | 95 | 7.3% |
| $50,000 to $74,999 | 398 | 30.7% |
| $75,000 to $99,999 | 74 | 5.7% |
| $100,000 to $149,999 | 281 | 21.7% |
| $150,000 to $199,999 | 166 | 12.8% |
| $200,000+ | 157 | 12.1% |
Household Income by Householder Age in Channel Islands Beach
The median household income in Channel Islands Beach is $95,250, with the highest median household income of $115,078 found in the 45 to 64 years age bracket for the primary householder. A total of 459 households (35.4%) fall into this category.
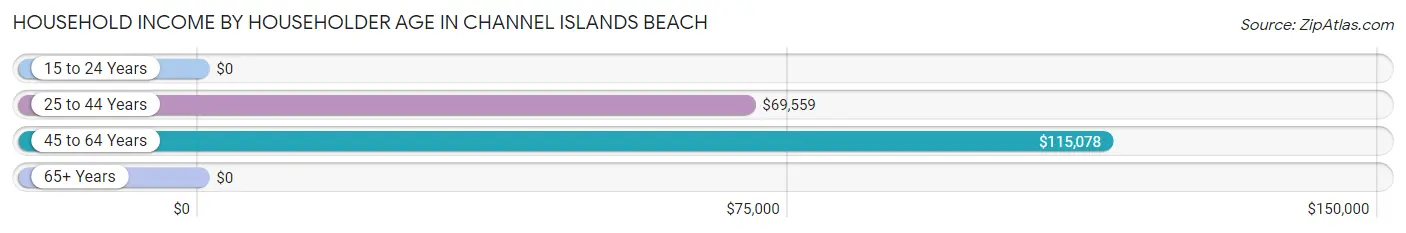
| Income Bracket | # Households | Median Income |
| 15 to 24 Years | 0 (0.0%) | $0 |
| 25 to 44 Years | 583 (45.0%) | $69,559 |
| 45 to 64 Years | 459 (35.4%) | $115,078 |
| 65+ Years | 254 (19.6%) | $0 |
| Total | 1,296 (100.0%) | $95,250 |
Poverty in Channel Islands Beach
Income Below Poverty by Sex and Age in Channel Islands Beach
With 6.8% poverty level for males and 4.6% for females among the residents of Channel Islands Beach, 16 and 17 year old males and 75 year old and over females are the most vulnerable to poverty, with 12 males (44.4%) and 15 females (19.2%) in their respective age groups living below the poverty level.
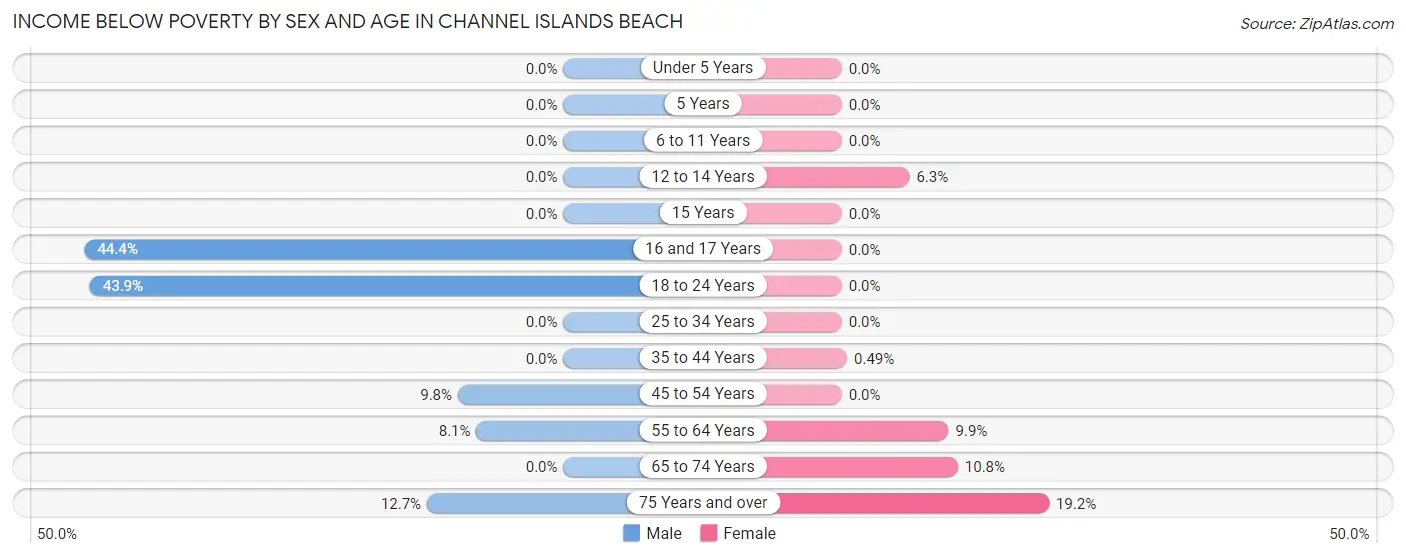
| Age Bracket | Male | Female |
| Under 5 Years | 0 (0.0%) | 0 (0.0%) |
| 5 Years | 0 (0.0%) | 0 (0.0%) |
| 6 to 11 Years | 0 (0.0%) | 0 (0.0%) |
| 12 to 14 Years | 0 (0.0%) | 15 (6.3%) |
| 15 Years | 0 (0.0%) | 0 (0.0%) |
| 16 and 17 Years | 12 (44.4%) | 0 (0.0%) |
| 18 to 24 Years | 29 (43.9%) | 0 (0.0%) |
| 25 to 34 Years | 0 (0.0%) | 0 (0.0%) |
| 35 to 44 Years | 0 (0.0%) | 1 (0.5%) |
| 45 to 54 Years | 14 (9.8%) | 0 (0.0%) |
| 55 to 64 Years | 18 (8.1%) | 23 (9.9%) |
| 65 to 74 Years | 0 (0.0%) | 14 (10.8%) |
| 75 Years and over | 10 (12.7%) | 15 (19.2%) |
| Total | 83 (6.8%) | 68 (4.6%) |
Income Above Poverty by Sex and Age in Channel Islands Beach
According to the poverty statistics in Channel Islands Beach, males aged under 5 years and females aged under 5 years are the age groups that are most secure financially, with 100.0% of males and 100.0% of females in these age groups living above the poverty line.
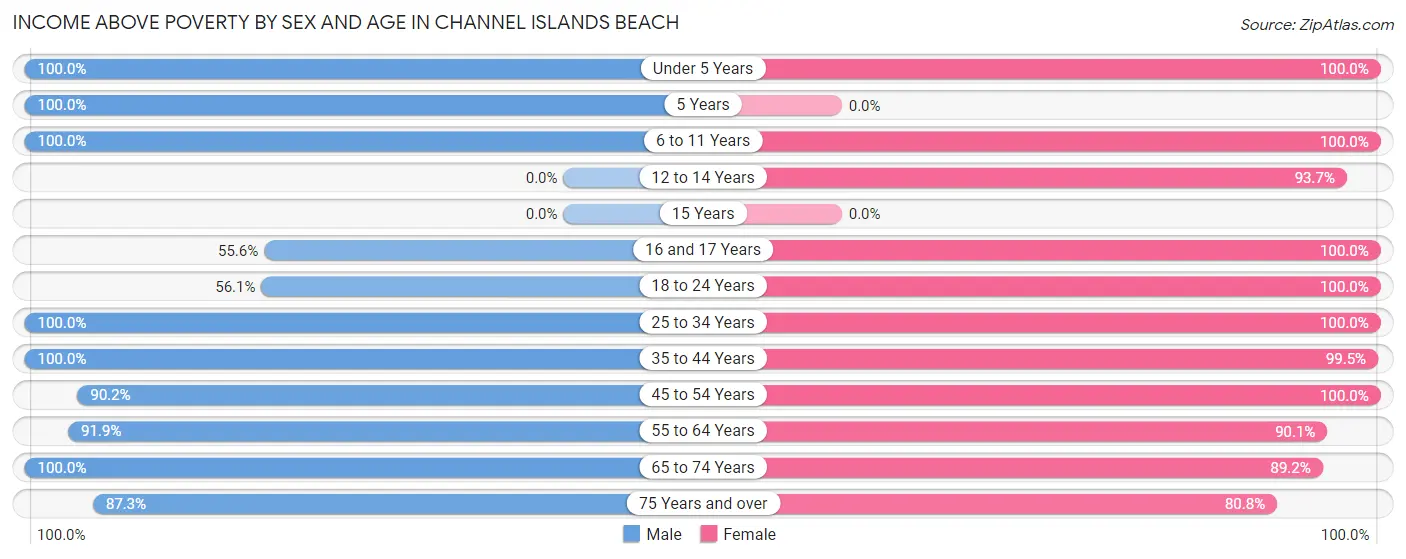
| Age Bracket | Male | Female |
| Under 5 Years | 14 (100.0%) | 22 (100.0%) |
| 5 Years | 14 (100.0%) | 0 (0.0%) |
| 6 to 11 Years | 25 (100.0%) | 120 (100.0%) |
| 12 to 14 Years | 0 (0.0%) | 224 (93.7%) |
| 15 Years | 0 (0.0%) | 0 (0.0%) |
| 16 and 17 Years | 15 (55.6%) | 25 (100.0%) |
| 18 to 24 Years | 37 (56.1%) | 36 (100.0%) |
| 25 to 34 Years | 90 (100.0%) | 213 (100.0%) |
| 35 to 44 Years | 434 (100.0%) | 205 (99.5%) |
| 45 to 54 Years | 129 (90.2%) | 168 (100.0%) |
| 55 to 64 Years | 205 (91.9%) | 209 (90.1%) |
| 65 to 74 Years | 110 (100.0%) | 116 (89.2%) |
| 75 Years and over | 69 (87.3%) | 63 (80.8%) |
| Total | 1,142 (93.2%) | 1,401 (95.4%) |
Income Below Poverty Among Married-Couple Families in Channel Islands Beach
The poverty statistics for married-couple families in Channel Islands Beach show that 4.0% or 17 of the total 427 families live below the poverty line. Families with no children have the highest poverty rate of 5.2%, comprising of 17 families. On the other hand, families with 1 or 2 children have the lowest poverty rate of 0.0%, which includes 0 families.
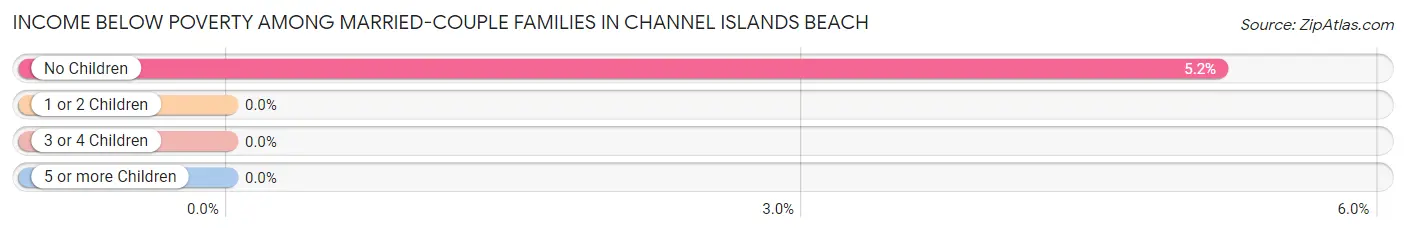
| Children | Above Poverty | Below Poverty |
| No Children | 312 (94.8%) | 17 (5.2%) |
| 1 or 2 Children | 98 (100.0%) | 0 (0.0%) |
| 3 or 4 Children | 0 (0.0%) | 0 (0.0%) |
| 5 or more Children | 0 (0.0%) | 0 (0.0%) |
| Total | 410 (96.0%) | 17 (4.0%) |
Income Below Poverty Among Single-Parent Households in Channel Islands Beach
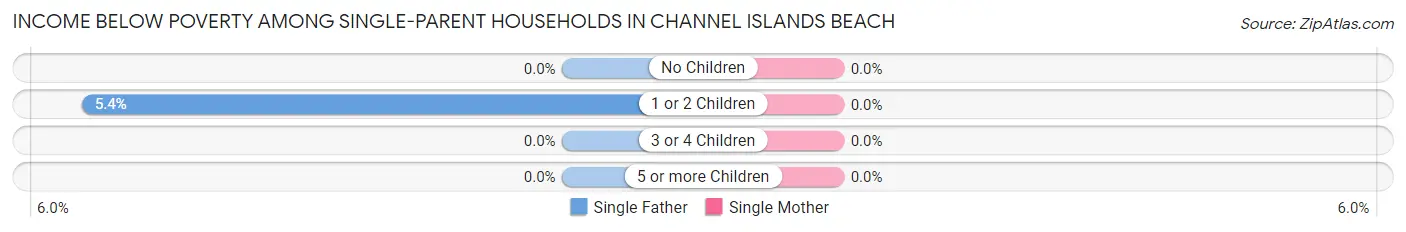
| Children | Single Father | Single Mother |
| No Children | 0 (0.0%) | 0 (0.0%) |
| 1 or 2 Children | 14 (5.4%) | 0 (0.0%) |
| 3 or 4 Children | 0 (0.0%) | 0 (0.0%) |
| 5 or more Children | 0 (0.0%) | 0 (0.0%) |
| Total | 14 (5.0%) | 0 (0.0%) |
Income Below Poverty Among Married-Couple vs Single-Parent Households in Channel Islands Beach
The poverty data for Channel Islands Beach shows that 17 of the married-couple family households (4.0%) and 14 of the single-parent households (3.4%) are living below the poverty level. Within the married-couple family households, those with no children have the highest poverty rate, with 17 households (5.2%) falling below the poverty line. Among the single-parent households, those with 1 or 2 children have the highest poverty rate, with 14 household (5.4%) living below poverty.
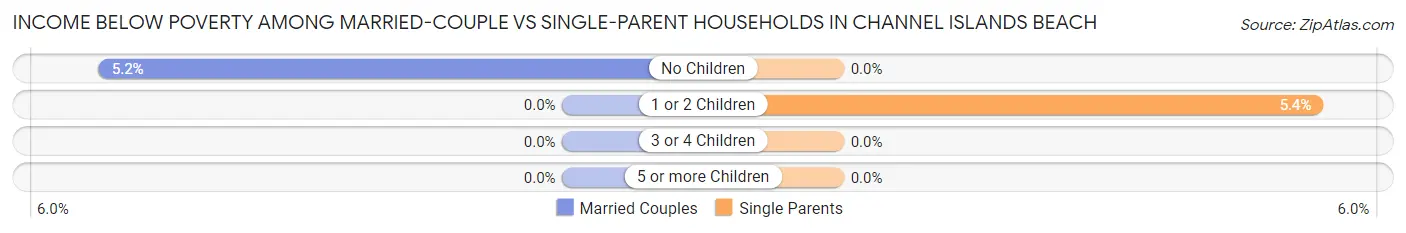
| Children | Married-Couple Families | Single-Parent Households |
| No Children | 17 (5.2%) | 0 (0.0%) |
| 1 or 2 Children | 0 (0.0%) | 14 (5.4%) |
| 3 or 4 Children | 0 (0.0%) | 0 (0.0%) |
| 5 or more Children | 0 (0.0%) | 0 (0.0%) |
| Total | 17 (4.0%) | 14 (3.4%) |
Race in Channel Islands Beach
The most populous races in Channel Islands Beach are White / Caucasian (2,147 | 79.3%), Hispanic or Latino (983 | 36.3%), and Two or more Races (428 | 15.8%).
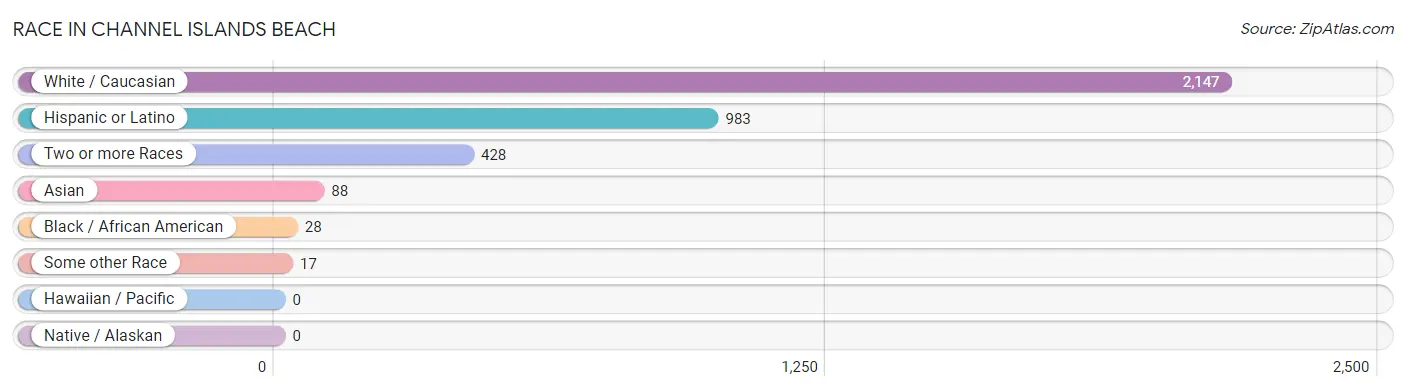
| Race | # Population | % Population |
| Asian | 88 | 3.3% |
| Black / African American | 28 | 1.0% |
| Hawaiian / Pacific | 0 | 0.0% |
| Hispanic or Latino | 983 | 36.3% |
| Native / Alaskan | 0 | 0.0% |
| White / Caucasian | 2,147 | 79.3% |
| Two or more Races | 428 | 15.8% |
| Some other Race | 17 | 0.6% |
| Total | 2,708 | 100.0% |
Ancestry in Channel Islands Beach
The most populous ancestries reported in Channel Islands Beach are Mexican (451 | 16.7%), Spaniard (371 | 13.7%), English (301 | 11.1%), Irish (285 | 10.5%), and German (266 | 9.8%), together accounting for 61.8% of all Channel Islands Beach residents.
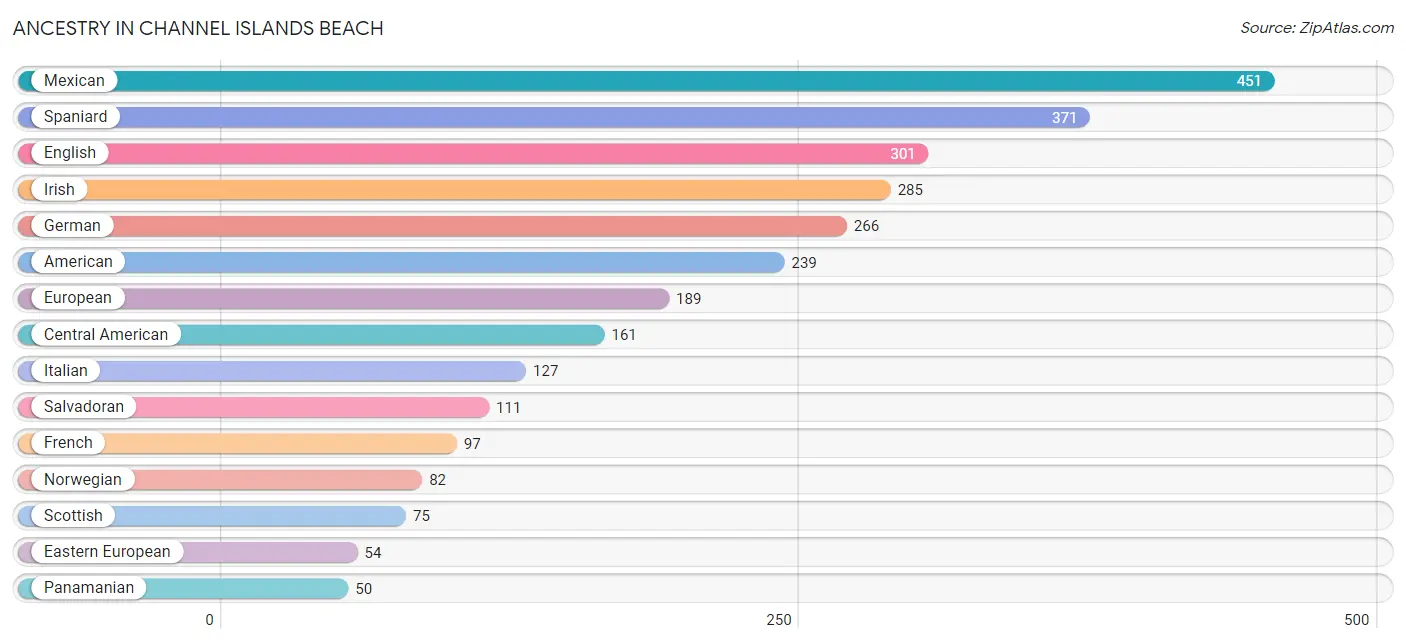
| Ancestry | # Population | % Population |
| American | 239 | 8.8% |
| Armenian | 25 | 0.9% |
| Bhutanese | 2 | 0.1% |
| British | 18 | 0.7% |
| Canadian | 13 | 0.5% |
| Central American | 161 | 5.9% |
| Danish | 10 | 0.4% |
| Dutch | 10 | 0.4% |
| Eastern European | 54 | 2.0% |
| English | 301 | 11.1% |
| European | 189 | 7.0% |
| Finnish | 17 | 0.6% |
| French | 97 | 3.6% |
| German | 266 | 9.8% |
| Greek | 42 | 1.5% |
| Hungarian | 9 | 0.3% |
| Indian (Asian) | 39 | 1.4% |
| Irish | 285 | 10.5% |
| Israeli | 12 | 0.4% |
| Italian | 127 | 4.7% |
| Korean | 46 | 1.7% |
| Mexican | 451 | 16.7% |
| Norwegian | 82 | 3.0% |
| Pakistani | 7 | 0.3% |
| Panamanian | 50 | 1.8% |
| Polish | 8 | 0.3% |
| Portuguese | 8 | 0.3% |
| Russian | 49 | 1.8% |
| Salvadoran | 111 | 4.1% |
| Scandinavian | 15 | 0.5% |
| Scotch-Irish | 50 | 1.8% |
| Scottish | 75 | 2.8% |
| Spaniard | 371 | 13.7% |
| Swedish | 26 | 1.0% |
| Thai | 10 | 0.4% |
| Welsh | 20 | 0.7% | View All 36 Rows |
Immigrants in Channel Islands Beach
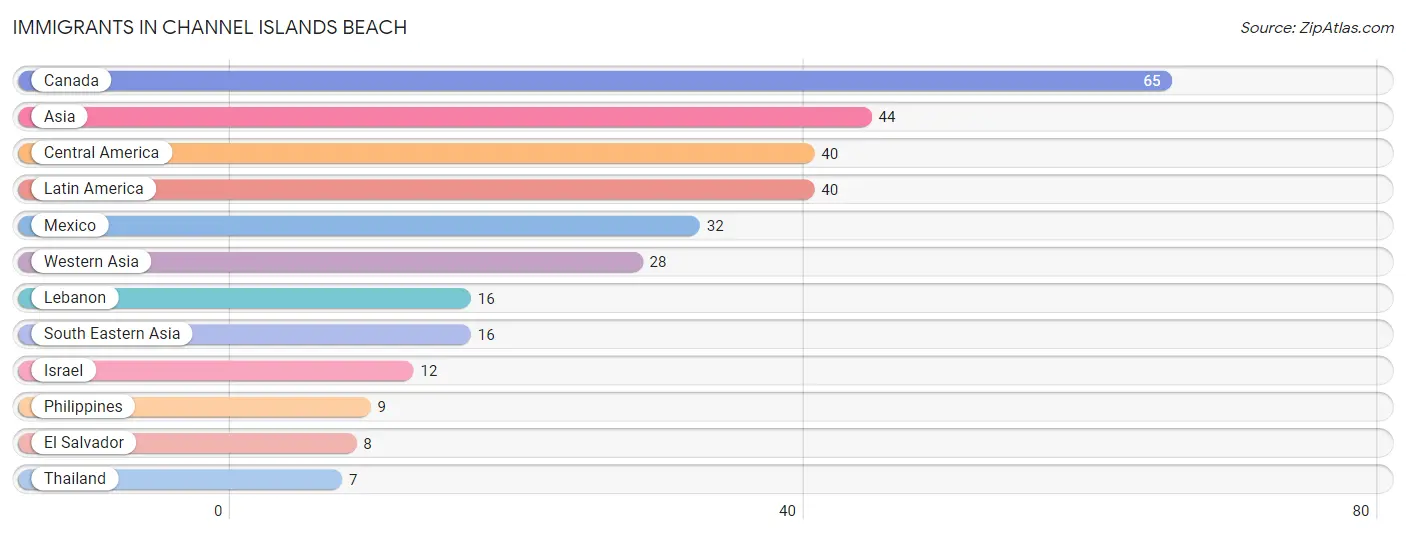
The most numerous immigrant groups reported in Channel Islands Beach came from Canada (65 | 2.4%), Asia (44 | 1.6%), Central America (40 | 1.5%), Latin America (40 | 1.5%), and Mexico (32 | 1.2%), together accounting for 8.2% of all Channel Islands Beach residents.
| Immigration Origin | # Population | % Population |
| Asia | 44 | 1.6% |
| Canada | 65 | 2.4% |
| Central America | 40 | 1.5% |
| El Salvador | 8 | 0.3% |
| Israel | 12 | 0.4% |
| Latin America | 40 | 1.5% |
| Lebanon | 16 | 0.6% |
| Mexico | 32 | 1.2% |
| Philippines | 9 | 0.3% |
| South Eastern Asia | 16 | 0.6% |
| Thailand | 7 | 0.3% |
| Western Asia | 28 | 1.0% | View All 12 Rows |
Sex and Age in Channel Islands Beach
Sex and Age in Channel Islands Beach
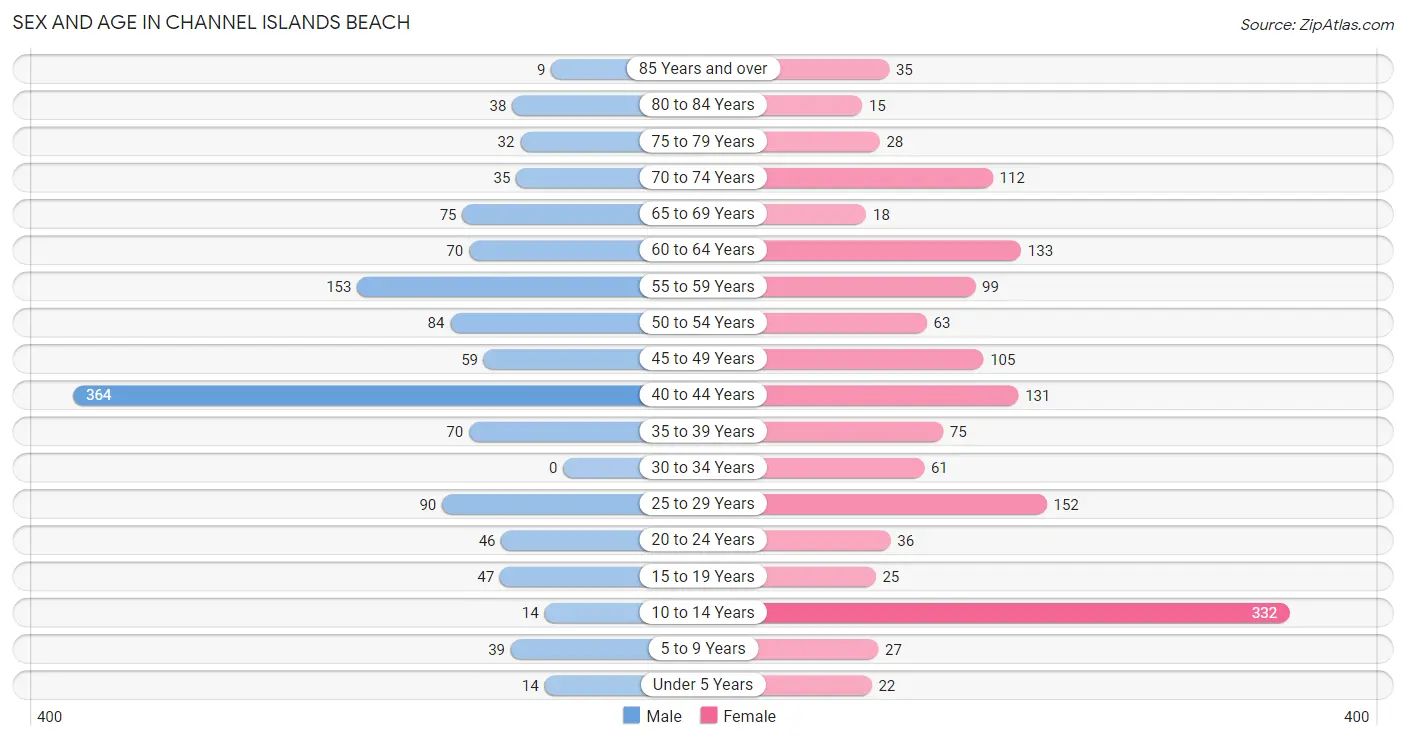
The most populous age groups in Channel Islands Beach are 40 to 44 Years (364 | 29.4%) for men and 10 to 14 Years (332 | 22.6%) for women.
| Age Bracket | Male | Female |
| Under 5 Years | 14 (1.1%) | 22 (1.5%) |
| 5 to 9 Years | 39 (3.2%) | 27 (1.8%) |
| 10 to 14 Years | 14 (1.1%) | 332 (22.6%) |
| 15 to 19 Years | 47 (3.8%) | 25 (1.7%) |
| 20 to 24 Years | 46 (3.7%) | 36 (2.5%) |
| 25 to 29 Years | 90 (7.3%) | 152 (10.3%) |
| 30 to 34 Years | 0 (0.0%) | 61 (4.2%) |
| 35 to 39 Years | 70 (5.7%) | 75 (5.1%) |
| 40 to 44 Years | 364 (29.4%) | 131 (8.9%) |
| 45 to 49 Years | 59 (4.8%) | 105 (7.1%) |
| 50 to 54 Years | 84 (6.8%) | 63 (4.3%) |
| 55 to 59 Years | 153 (12.3%) | 99 (6.7%) |
| 60 to 64 Years | 70 (5.7%) | 133 (9.0%) |
| 65 to 69 Years | 75 (6.0%) | 18 (1.2%) |
| 70 to 74 Years | 35 (2.8%) | 112 (7.6%) |
| 75 to 79 Years | 32 (2.6%) | 28 (1.9%) |
| 80 to 84 Years | 38 (3.1%) | 15 (1.0%) |
| 85 Years and over | 9 (0.7%) | 35 (2.4%) |
| Total | 1,239 (100.0%) | 1,469 (100.0%) |
Families and Households in Channel Islands Beach
Median Family Size in Channel Islands Beach
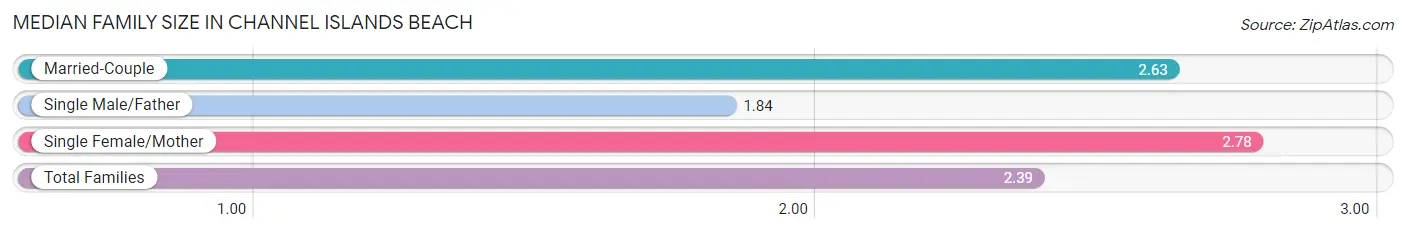
The median family size in Channel Islands Beach is 2.39 persons per family, with single female/mother families (130 | 15.5%) accounting for the largest median family size of 2.78 persons per family. On the other hand, single male/father families (280 | 33.5%) represent the smallest median family size with 1.84 persons per family.
| Family Type | # Families | Family Size |
| Married-Couple | 427 (51.0%) | 2.63 |
| Single Male/Father | 280 (33.5%) | 1.84 |
| Single Female/Mother | 130 (15.5%) | 2.78 |
| Total Families | 837 (100.0%) | 2.39 |
Median Household Size in Channel Islands Beach
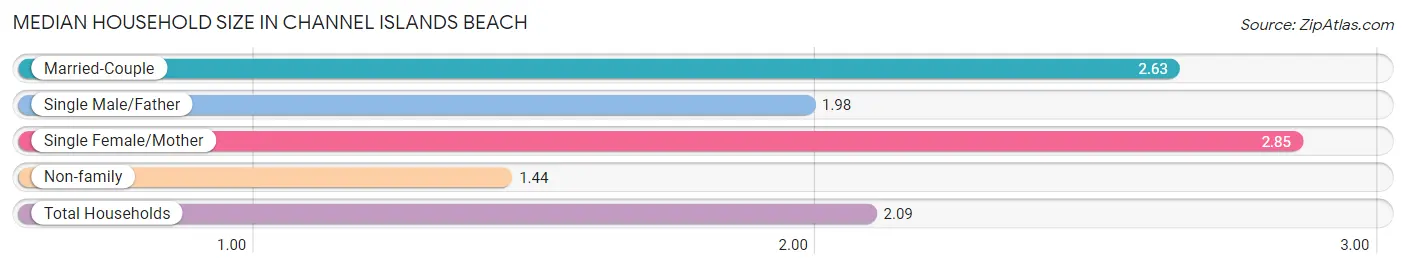
The median household size in Channel Islands Beach is 2.09 persons per household, with single female/mother households (130 | 10.0%) accounting for the largest median household size of 2.85 persons per household. non-family households (459 | 35.4%) represent the smallest median household size with 1.44 persons per household.
| Household Type | # Households | Household Size |
| Married-Couple | 427 (33.0%) | 2.63 |
| Single Male/Father | 280 (21.6%) | 1.98 |
| Single Female/Mother | 130 (10.0%) | 2.85 |
| Non-family | 459 (35.4%) | 1.44 |
| Total Households | 1,296 (100.0%) | 2.09 |
Household Size by Marriage Status in Channel Islands Beach
Out of a total of 1,296 households in Channel Islands Beach, 837 (64.6%) are family households, while 459 (35.4%) are nonfamily households. The most numerous type of family households are 2-person households, comprising 616, and the most common type of nonfamily households are 1-person households, comprising 327.
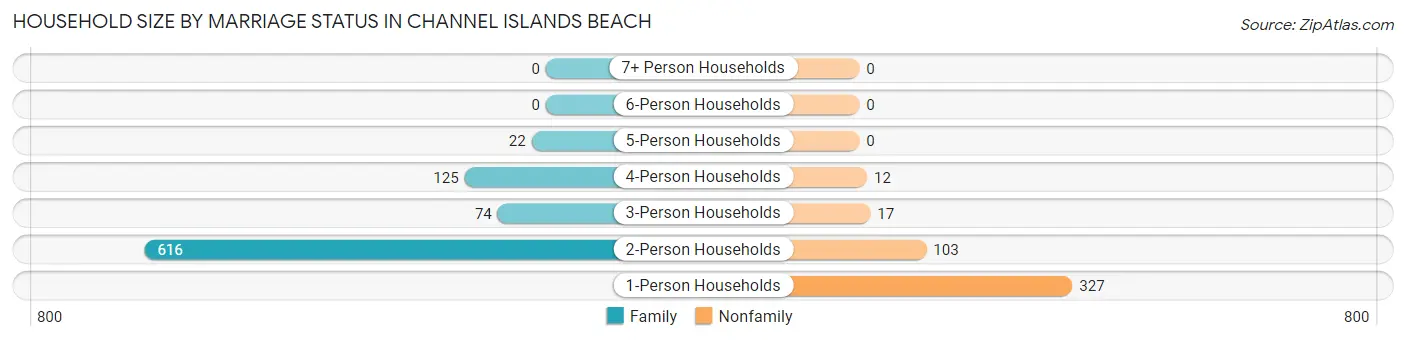
| Household Size | Family Households | Nonfamily Households |
| 1-Person Households | - | 327 (25.2%) |
| 2-Person Households | 616 (47.5%) | 103 (8.0%) |
| 3-Person Households | 74 (5.7%) | 17 (1.3%) |
| 4-Person Households | 125 (9.7%) | 12 (0.9%) |
| 5-Person Households | 22 (1.7%) | 0 (0.0%) |
| 6-Person Households | 0 (0.0%) | 0 (0.0%) |
| 7+ Person Households | 0 (0.0%) | 0 (0.0%) |
| Total | 837 (64.6%) | 459 (35.4%) |
Female Fertility in Channel Islands Beach
Fertility by Age in Channel Islands Beach
| Age Bracket | Women with Births | Births / 1,000 Women |
| 15 to 19 years | 0 (0.0%) | 0.0 |
| 20 to 34 years | 0 (0.0%) | 0.0 |
| 35 to 50 years | 0 (0.0%) | 0.0 |
| Total | 0 (0.0%) | 0.0 |
Fertility by Age by Marriage Status in Channel Islands Beach
| Age Bracket | Married | Unmarried |
| 15 to 19 years | 0 (0.0%) | 0 (0.0%) |
| 20 to 34 years | 0 (0.0%) | 0 (0.0%) |
| 35 to 50 years | 0 (0.0%) | 0 (0.0%) |
| Total | 0 (0.0%) | 0 (0.0%) |
Fertility by Education in Channel Islands Beach
| Educational Attainment | Women with Births | Births / 1,000 Women |
| Less than High School | 0 (0.0%) | 0.0 |
| High School Diploma | 0 (0.0%) | 0.0 |
| College or Associate's Degree | 0 (0.0%) | 0.0 |
| Bachelor's Degree | 0 (0.0%) | 0.0 |
| Graduate Degree | 0 (0.0%) | 0.0 |
| Total | 0 (0.0%) | 0.0 |
Fertility by Education by Marriage Status in Channel Islands Beach
| Educational Attainment | Married | Unmarried |
| Less than High School | 0 (0.0%) | 0 (0.0%) |
| High School Diploma | 0 (0.0%) | 0 (0.0%) |
| College or Associate's Degree | 0 (0.0%) | 0 (0.0%) |
| Bachelor's Degree | 0 (0.0%) | 0 (0.0%) |
| Graduate Degree | 0 (0.0%) | 0 (0.0%) |
| Total | 0 (0.0%) | 0 (0.0%) |
Employment Characteristics in Channel Islands Beach
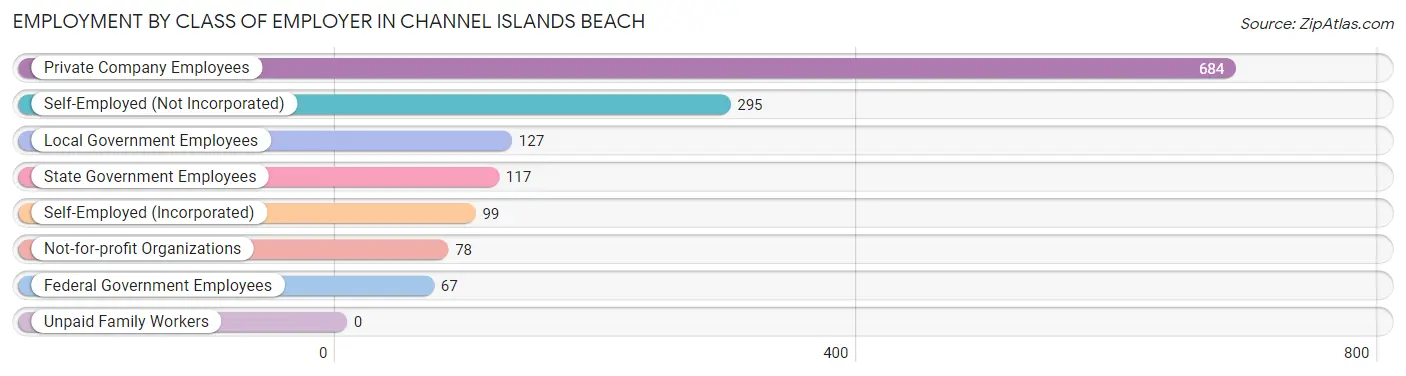
Employment by Class of Employer in Channel Islands Beach
Among the 1,467 employed individuals in Channel Islands Beach, private company employees (684 | 46.6%), self-employed (not incorporated) (295 | 20.1%), and local government employees (127 | 8.7%) make up the most common classes of employment.
| Employer Class | # Employees | % Employees |
| Private Company Employees | 684 | 46.6% |
| Self-Employed (Incorporated) | 99 | 6.8% |
| Self-Employed (Not Incorporated) | 295 | 20.1% |
| Not-for-profit Organizations | 78 | 5.3% |
| Local Government Employees | 127 | 8.7% |
| State Government Employees | 117 | 8.0% |
| Federal Government Employees | 67 | 4.6% |
| Unpaid Family Workers | 0 | 0.0% |
| Total | 1,467 | 100.0% |
Employment Status by Age in Channel Islands Beach
According to the labor force statistics for Channel Islands Beach, out of the total population over 16 years of age (2,260), 69.1% or 1,562 individuals are in the labor force, with 2.8% or 44 of them unemployed. The age group with the highest labor force participation rate is 30 to 34 years, with 100.0% or 61 individuals in the labor force. Within the labor force, the 25 to 29 years age range has the highest percentage of unemployed individuals, with 14.9% or 34 of them being unemployed.
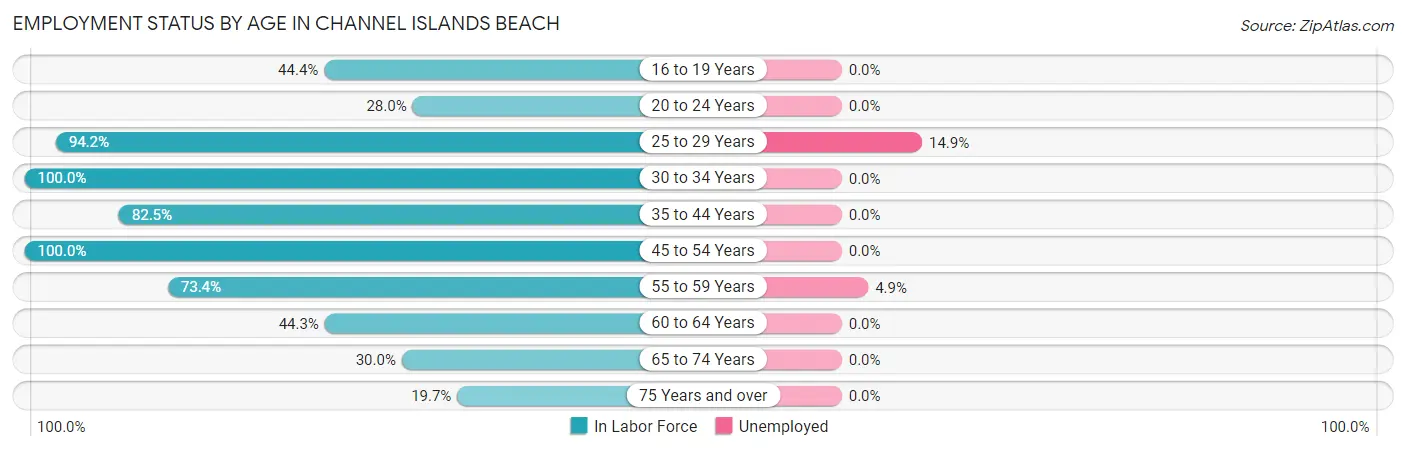
| Age Bracket | In Labor Force | Unemployed |
| 16 to 19 Years | 32 (44.4%) | 0 (0.0%) |
| 20 to 24 Years | 23 (28.0%) | 0 (0.0%) |
| 25 to 29 Years | 228 (94.2%) | 34 (14.9%) |
| 30 to 34 Years | 61 (100.0%) | 0 (0.0%) |
| 35 to 44 Years | 528 (82.5%) | 0 (0.0%) |
| 45 to 54 Years | 311 (100.0%) | 0 (0.0%) |
| 55 to 59 Years | 185 (73.4%) | 9 (4.9%) |
| 60 to 64 Years | 90 (44.3%) | 0 (0.0%) |
| 65 to 74 Years | 72 (30.0%) | 0 (0.0%) |
| 75 Years and over | 31 (19.7%) | 0 (0.0%) |
| Total | 1,562 (69.1%) | 44 (2.8%) |
Employment Status by Educational Attainment in Channel Islands Beach
According to labor force statistics for Channel Islands Beach, 82.1% of individuals (1,403) out of the total population between 25 and 64 years of age (1,709) are in the labor force, with 3.1% or 43 of them being unemployed. The group with the highest labor force participation rate are those with the educational attainment of high school diploma, with 94.7% or 248 individuals in the labor force. Within the labor force, individuals with college / associate degree education have the highest percentage of unemployment, with 6.9% or 43 of them being unemployed.
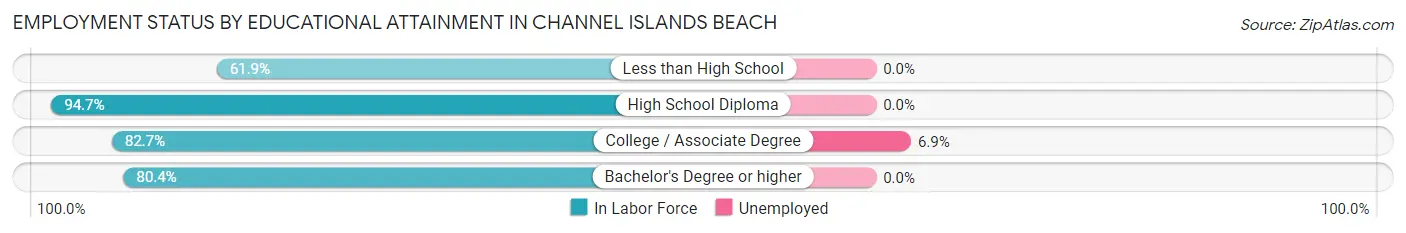
| Educational Attainment | In Labor Force | Unemployed |
| Less than High School | 86 (61.9%) | 0 (0.0%) |
| High School Diploma | 248 (94.7%) | 0 (0.0%) |
| College / Associate Degree | 626 (82.7%) | 52 (6.9%) |
| Bachelor's Degree or higher | 443 (80.4%) | 0 (0.0%) |
| Total | 1,403 (82.1%) | 53 (3.1%) |
Employment Occupations by Sex in Channel Islands Beach
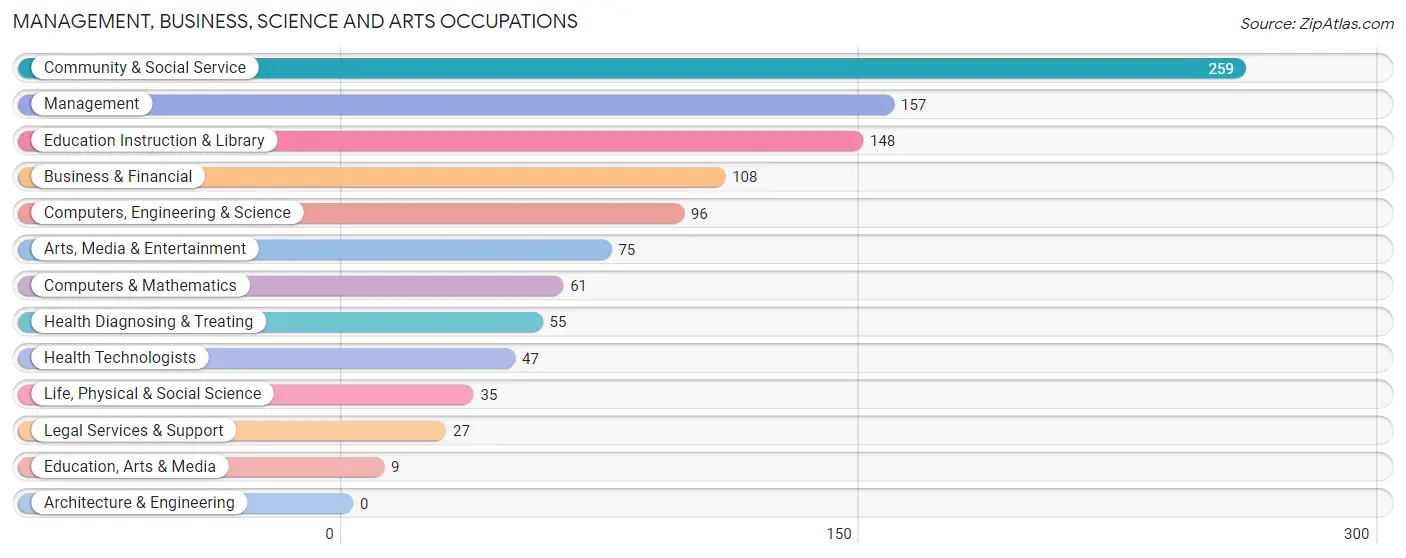
Management, Business, Science and Arts Occupations
The most common Management, Business, Science and Arts occupations in Channel Islands Beach are Community & Social Service (259 | 17.1%), Management (157 | 10.3%), Education Instruction & Library (148 | 9.8%), Business & Financial (108 | 7.1%), and Computers, Engineering & Science (96 | 6.3%).
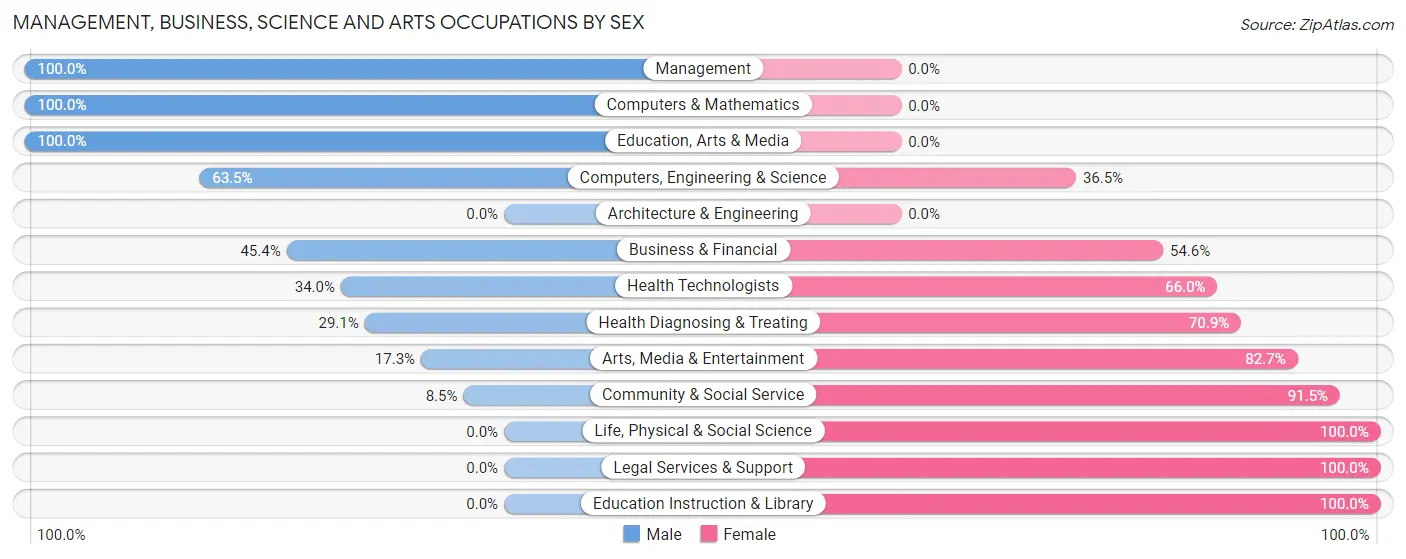
Management, Business, Science and Arts Occupations by Sex
Within the Management, Business, Science and Arts occupations in Channel Islands Beach, the most male-oriented occupations are Management (100.0%), Computers & Mathematics (100.0%), and Education, Arts & Media (100.0%), while the most female-oriented occupations are Life, Physical & Social Science (100.0%), Legal Services & Support (100.0%), and Education Instruction & Library (100.0%).
| Occupation | Male | Female |
| Management | 157 (100.0%) | 0 (0.0%) |
| Business & Financial | 49 (45.4%) | 59 (54.6%) |
| Computers, Engineering & Science | 61 (63.5%) | 35 (36.5%) |
| Computers & Mathematics | 61 (100.0%) | 0 (0.0%) |
| Architecture & Engineering | 0 (0.0%) | 0 (0.0%) |
| Life, Physical & Social Science | 0 (0.0%) | 35 (100.0%) |
| Community & Social Service | 22 (8.5%) | 237 (91.5%) |
| Education, Arts & Media | 9 (100.0%) | 0 (0.0%) |
| Legal Services & Support | 0 (0.0%) | 27 (100.0%) |
| Education Instruction & Library | 0 (0.0%) | 148 (100.0%) |
| Arts, Media & Entertainment | 13 (17.3%) | 62 (82.7%) |
| Health Diagnosing & Treating | 16 (29.1%) | 39 (70.9%) |
| Health Technologists | 16 (34.0%) | 31 (66.0%) |
| Total (Category) | 305 (45.2%) | 370 (54.8%) |
| Total (Overall) | 910 (60.0%) | 608 (40.1%) |
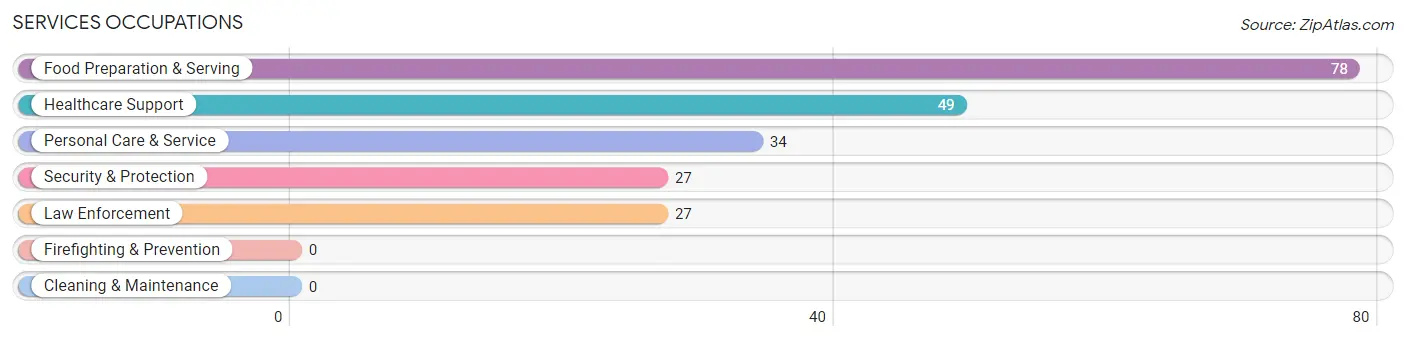
Services Occupations
The most common Services occupations in Channel Islands Beach are Food Preparation & Serving (78 | 5.1%), Healthcare Support (49 | 3.2%), Personal Care & Service (34 | 2.2%), Security & Protection (27 | 1.8%), and Law Enforcement (27 | 1.8%).
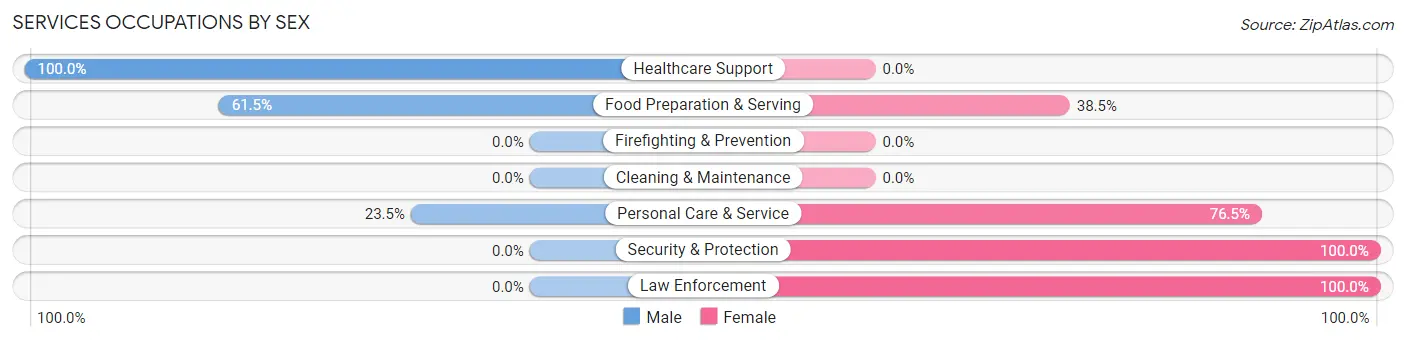
Services Occupations by Sex
Within the Services occupations in Channel Islands Beach, the most male-oriented occupations are Healthcare Support (100.0%), Food Preparation & Serving (61.5%), and Personal Care & Service (23.5%), while the most female-oriented occupations are Security & Protection (100.0%), Law Enforcement (100.0%), and Personal Care & Service (76.5%).
| Occupation | Male | Female |
| Healthcare Support | 49 (100.0%) | 0 (0.0%) |
| Security & Protection | 0 (0.0%) | 27 (100.0%) |
| Firefighting & Prevention | 0 (0.0%) | 0 (0.0%) |
| Law Enforcement | 0 (0.0%) | 27 (100.0%) |
| Food Preparation & Serving | 48 (61.5%) | 30 (38.5%) |
| Cleaning & Maintenance | 0 (0.0%) | 0 (0.0%) |
| Personal Care & Service | 8 (23.5%) | 26 (76.5%) |
| Total (Category) | 105 (55.8%) | 83 (44.2%) |
| Total (Overall) | 910 (60.0%) | 608 (40.1%) |
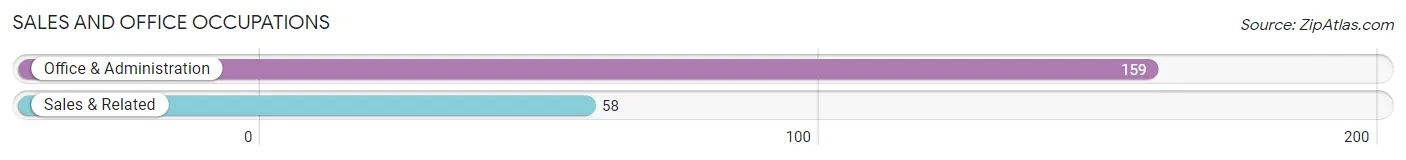
Sales and Office Occupations
The most common Sales and Office occupations in Channel Islands Beach are Office & Administration (159 | 10.5%), and Sales & Related (58 | 3.8%).
Sales and Office Occupations by Sex
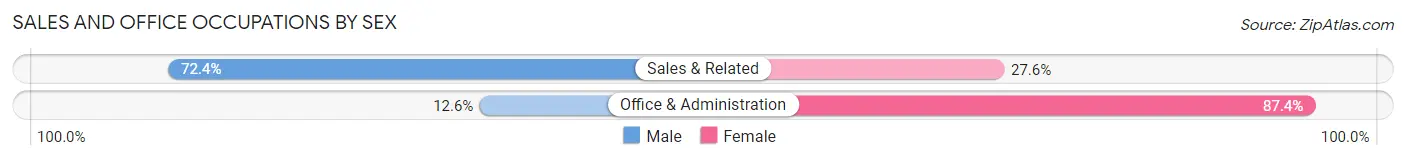
| Occupation | Male | Female |
| Sales & Related | 42 (72.4%) | 16 (27.6%) |
| Office & Administration | 20 (12.6%) | 139 (87.4%) |
| Total (Category) | 62 (28.6%) | 155 (71.4%) |
| Total (Overall) | 910 (60.0%) | 608 (40.1%) |
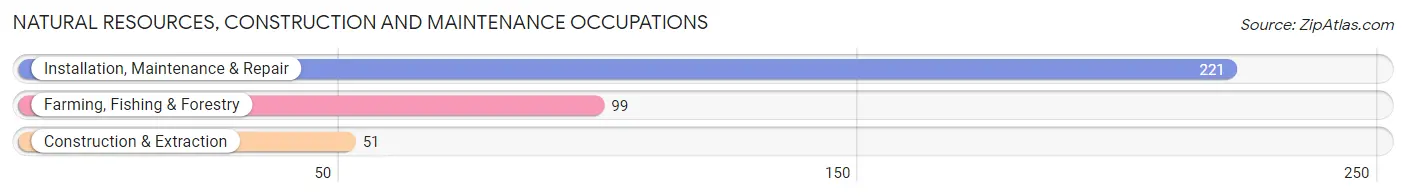
Natural Resources, Construction and Maintenance Occupations
The most common Natural Resources, Construction and Maintenance occupations in Channel Islands Beach are Installation, Maintenance & Repair (221 | 14.6%), Farming, Fishing & Forestry (99 | 6.5%), and Construction & Extraction (51 | 3.4%).
Natural Resources, Construction and Maintenance Occupations by Sex
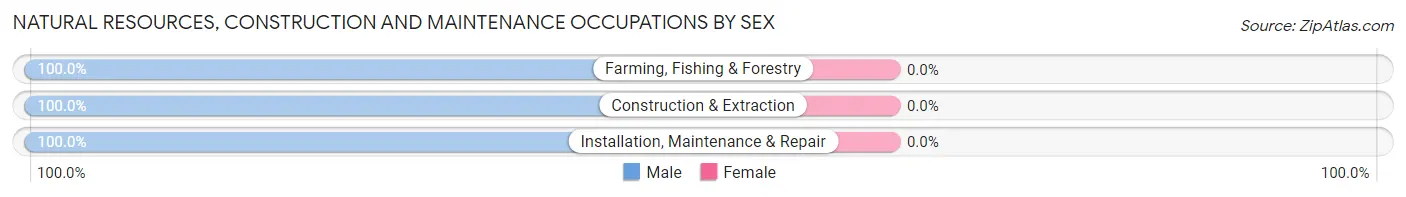
| Occupation | Male | Female |
| Farming, Fishing & Forestry | 99 (100.0%) | 0 (0.0%) |
| Construction & Extraction | 51 (100.0%) | 0 (0.0%) |
| Installation, Maintenance & Repair | 221 (100.0%) | 0 (0.0%) |
| Total (Category) | 371 (100.0%) | 0 (0.0%) |
| Total (Overall) | 910 (60.0%) | 608 (40.1%) |
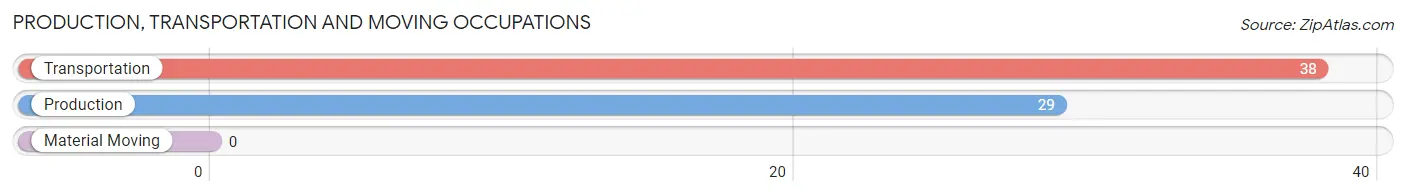
Production, Transportation and Moving Occupations
The most common Production, Transportation and Moving occupations in Channel Islands Beach are Transportation (38 | 2.5%), and Production (29 | 1.9%).
Production, Transportation and Moving Occupations by Sex
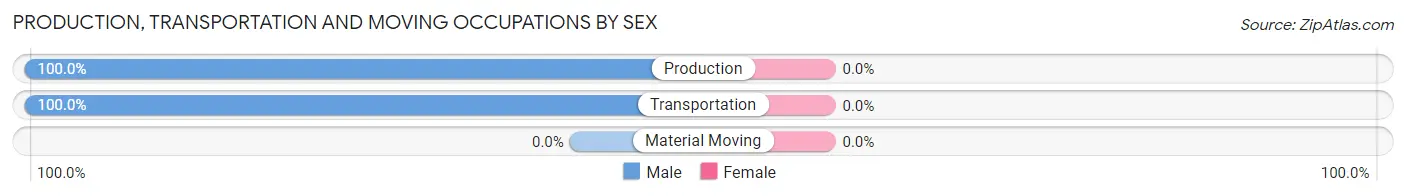
| Occupation | Male | Female |
| Production | 29 (100.0%) | 0 (0.0%) |
| Transportation | 38 (100.0%) | 0 (0.0%) |
| Material Moving | 0 (0.0%) | 0 (0.0%) |
| Total (Category) | 67 (100.0%) | 0 (0.0%) |
| Total (Overall) | 910 (60.0%) | 608 (40.1%) |
Employment Industries by Sex in Channel Islands Beach
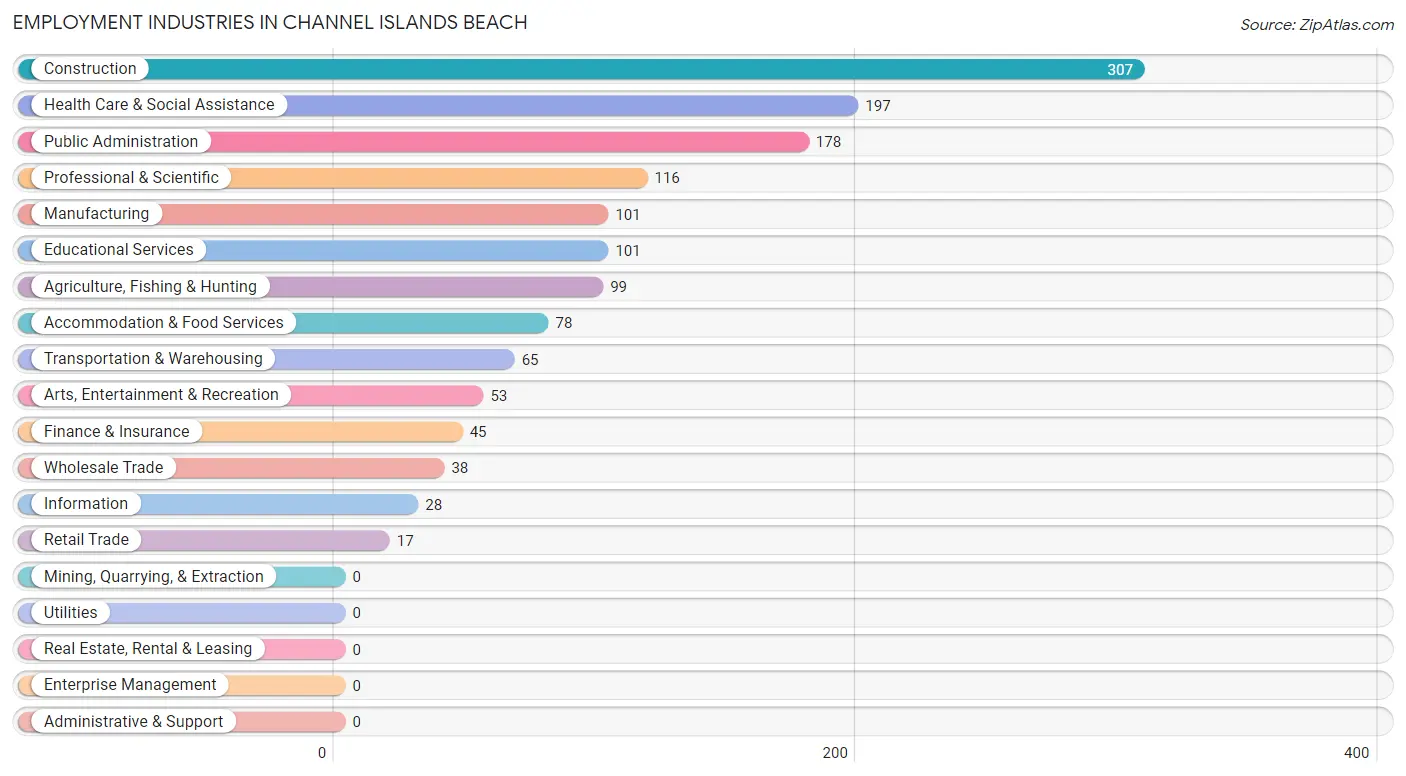
Employment Industries in Channel Islands Beach
The major employment industries in Channel Islands Beach include Construction (307 | 20.2%), Health Care & Social Assistance (197 | 13.0%), Public Administration (178 | 11.7%), Professional & Scientific (116 | 7.6%), and Manufacturing (101 | 6.7%).
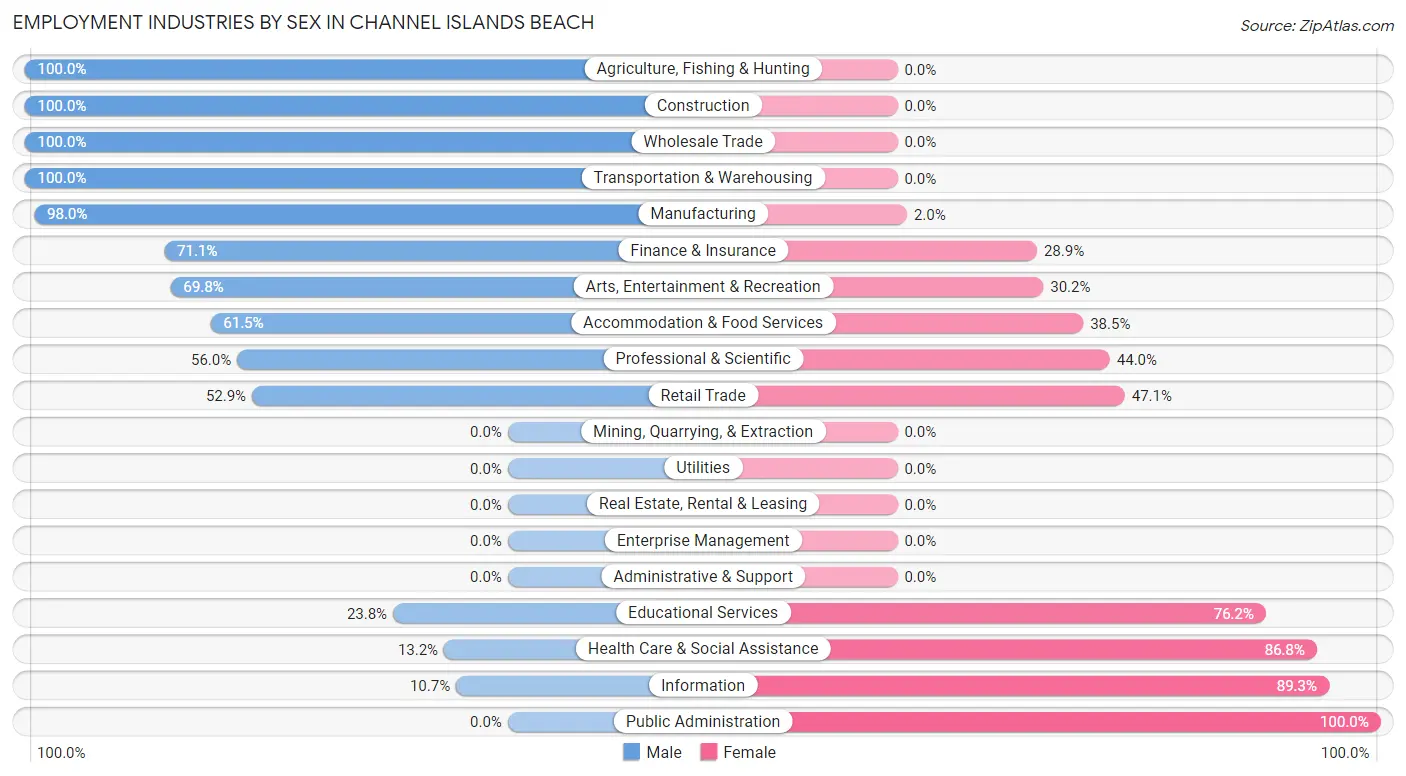
Employment Industries by Sex in Channel Islands Beach
The Channel Islands Beach industries that see more men than women are Agriculture, Fishing & Hunting (100.0%), Construction (100.0%), and Wholesale Trade (100.0%), whereas the industries that tend to have a higher number of women are Public Administration (100.0%), Information (89.3%), and Health Care & Social Assistance (86.8%).
| Industry | Male | Female |
| Agriculture, Fishing & Hunting | 99 (100.0%) | 0 (0.0%) |
| Mining, Quarrying, & Extraction | 0 (0.0%) | 0 (0.0%) |
| Construction | 307 (100.0%) | 0 (0.0%) |
| Manufacturing | 99 (98.0%) | 2 (2.0%) |
| Wholesale Trade | 38 (100.0%) | 0 (0.0%) |
| Retail Trade | 9 (52.9%) | 8 (47.1%) |
| Transportation & Warehousing | 65 (100.0%) | 0 (0.0%) |
| Utilities | 0 (0.0%) | 0 (0.0%) |
| Information | 3 (10.7%) | 25 (89.3%) |
| Finance & Insurance | 32 (71.1%) | 13 (28.9%) |
| Real Estate, Rental & Leasing | 0 (0.0%) | 0 (0.0%) |
| Professional & Scientific | 65 (56.0%) | 51 (44.0%) |
| Enterprise Management | 0 (0.0%) | 0 (0.0%) |
| Administrative & Support | 0 (0.0%) | 0 (0.0%) |
| Educational Services | 24 (23.8%) | 77 (76.2%) |
| Health Care & Social Assistance | 26 (13.2%) | 171 (86.8%) |
| Arts, Entertainment & Recreation | 37 (69.8%) | 16 (30.2%) |
| Accommodation & Food Services | 48 (61.5%) | 30 (38.5%) |
| Public Administration | 0 (0.0%) | 178 (100.0%) |
| Total | 910 (60.0%) | 608 (40.1%) |
Education in Channel Islands Beach
School Enrollment in Channel Islands Beach
The most common levels of schooling among the 547 students in Channel Islands Beach are middle school (346 | 63.2%), college / undergraduate (55 | 10.1%), and graduate / professional (43 | 7.9%).
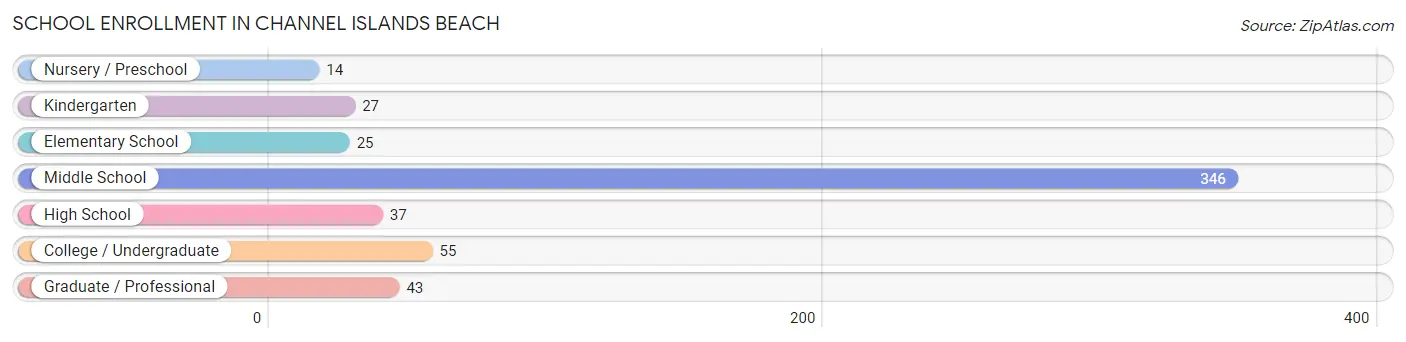
| School Level | # Students | % Students |
| Nursery / Preschool | 14 | 2.6% |
| Kindergarten | 27 | 4.9% |
| Elementary School | 25 | 4.6% |
| Middle School | 346 | 63.2% |
| High School | 37 | 6.8% |
| College / Undergraduate | 55 | 10.1% |
| Graduate / Professional | 43 | 7.9% |
| Total | 547 | 100.0% |
School Enrollment by Age by Funding Source in Channel Islands Beach
Out of a total of 547 students who are enrolled in schools in Channel Islands Beach, 115 (21.0%) attend a private institution, while the remaining 432 (79.0%) are enrolled in public schools. The age group of 10 to 14 year olds has the highest likelihood of being enrolled in private schools, with 93 (26.9% in the age bracket) enrolled. Conversely, the age group of 15 to 17 year olds has the lowest likelihood of being enrolled in a private school, with 37 (100.0% in the age bracket) attending a public institution.
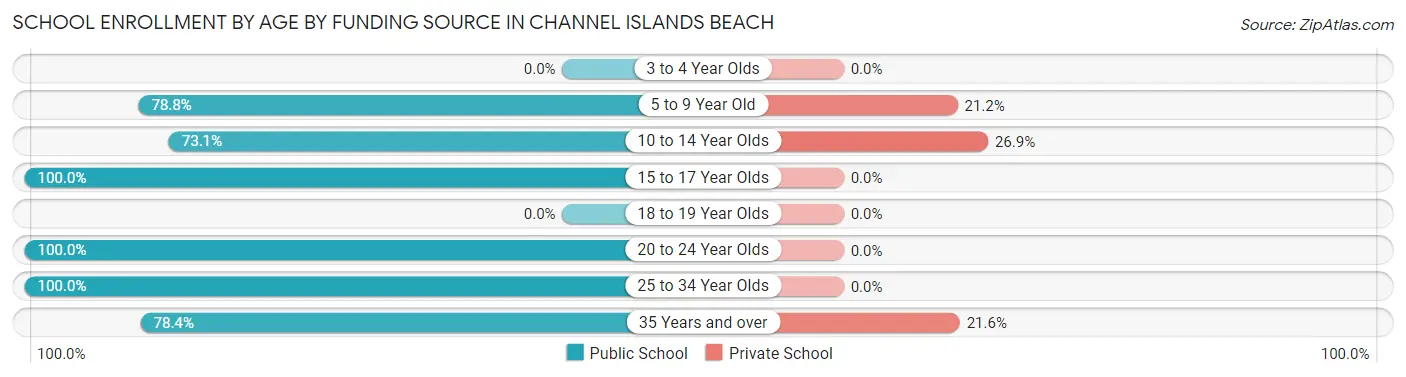
| Age Bracket | Public School | Private School |
| 3 to 4 Year Olds | 0 (0.0%) | 0 (0.0%) |
| 5 to 9 Year Old | 52 (78.8%) | 14 (21.2%) |
| 10 to 14 Year Olds | 253 (73.1%) | 93 (26.9%) |
| 15 to 17 Year Olds | 37 (100.0%) | 0 (0.0%) |
| 18 to 19 Year Olds | 0 (0.0%) | 0 (0.0%) |
| 20 to 24 Year Olds | 59 (100.0%) | 0 (0.0%) |
| 25 to 34 Year Olds | 2 (100.0%) | 0 (0.0%) |
| 35 Years and over | 29 (78.4%) | 8 (21.6%) |
| Total | 432 (79.0%) | 115 (21.0%) |
Educational Attainment by Field of Study in Channel Islands Beach
Business (141 | 16.6%), communications (117 | 13.7%), education (105 | 12.3%), arts & humanities (103 | 12.1%), and science & technology (84 | 9.9%) are the most common fields of study among 852 individuals in Channel Islands Beach who have obtained a bachelor's degree or higher.
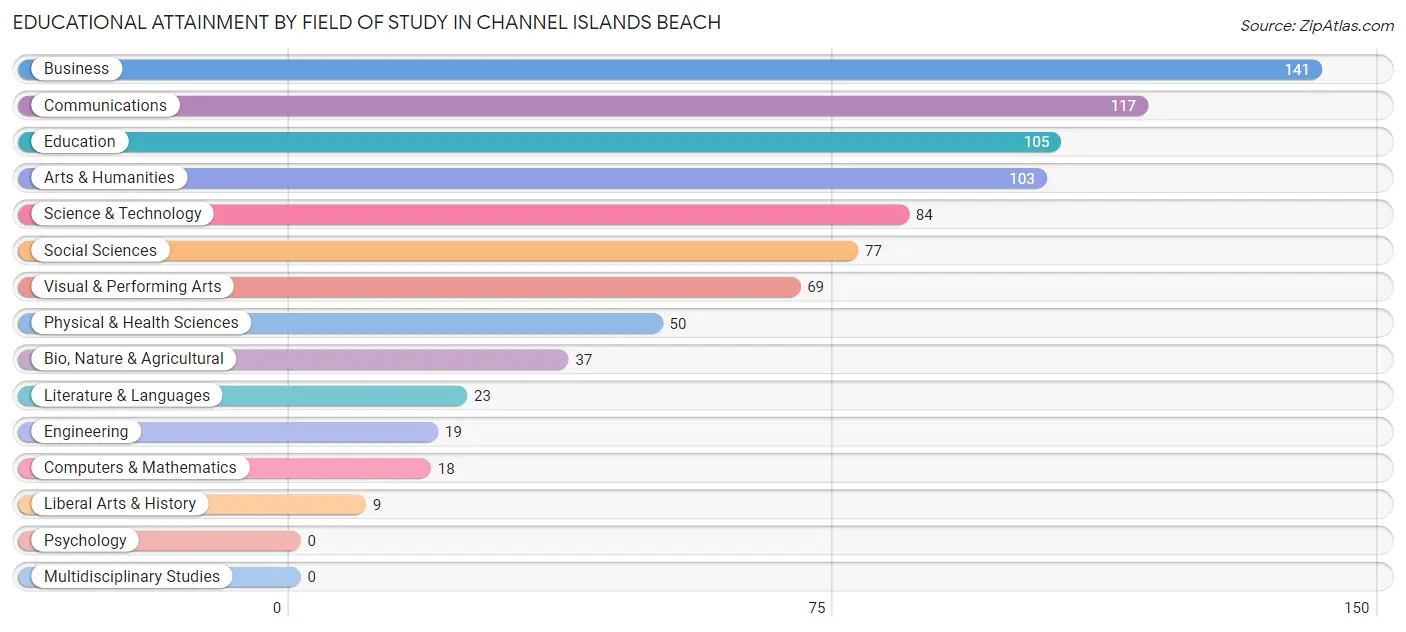
| Field of Study | # Graduates | % Graduates |
| Computers & Mathematics | 18 | 2.1% |
| Bio, Nature & Agricultural | 37 | 4.3% |
| Physical & Health Sciences | 50 | 5.9% |
| Psychology | 0 | 0.0% |
| Social Sciences | 77 | 9.0% |
| Engineering | 19 | 2.2% |
| Multidisciplinary Studies | 0 | 0.0% |
| Science & Technology | 84 | 9.9% |
| Business | 141 | 16.6% |
| Education | 105 | 12.3% |
| Literature & Languages | 23 | 2.7% |
| Liberal Arts & History | 9 | 1.1% |
| Visual & Performing Arts | 69 | 8.1% |
| Communications | 117 | 13.7% |
| Arts & Humanities | 103 | 12.1% |
| Total | 852 | 100.0% |
Transportation & Commute in Channel Islands Beach
Vehicle Availability by Sex in Channel Islands Beach
The most prevalent vehicle ownership categories in Channel Islands Beach are males with 2 vehicles (412, accounting for 47.5%) and females with 2 vehicles (170, making up 68.8%).
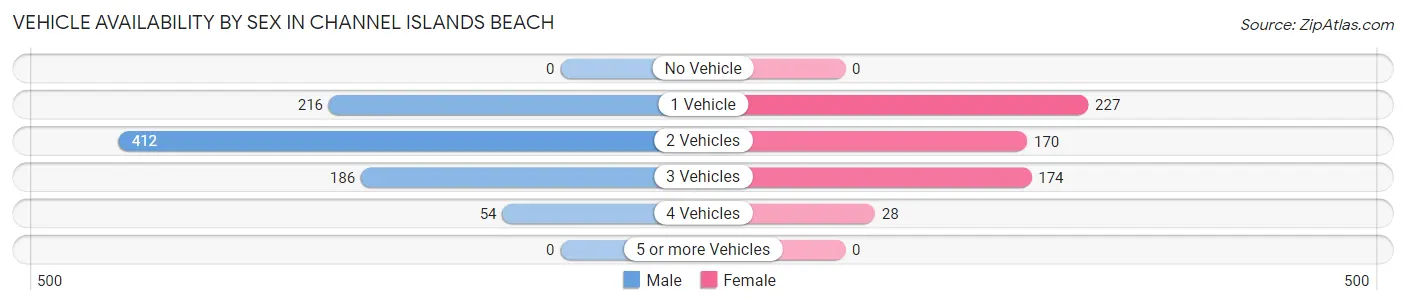
| Vehicles Available | Male | Female |
| No Vehicle | 0 (0.0%) | 0 (0.0%) |
| 1 Vehicle | 216 (24.9%) | 227 (37.9%) |
| 2 Vehicles | 412 (47.5%) | 170 (28.4%) |
| 3 Vehicles | 186 (21.4%) | 174 (29.0%) |
| 4 Vehicles | 54 (6.2%) | 28 (4.7%) |
| 5 or more Vehicles | 0 (0.0%) | 0 (0.0%) |
| Total | 868 (100.0%) | 599 (100.0%) |
Commute Time in Channel Islands Beach
The most frequently occuring commute durations in Channel Islands Beach are 20 to 24 minutes (407 commuters, 33.6%), 90 or more minutes (160 commuters, 13.2%), and 15 to 19 minutes (141 commuters, 11.6%).
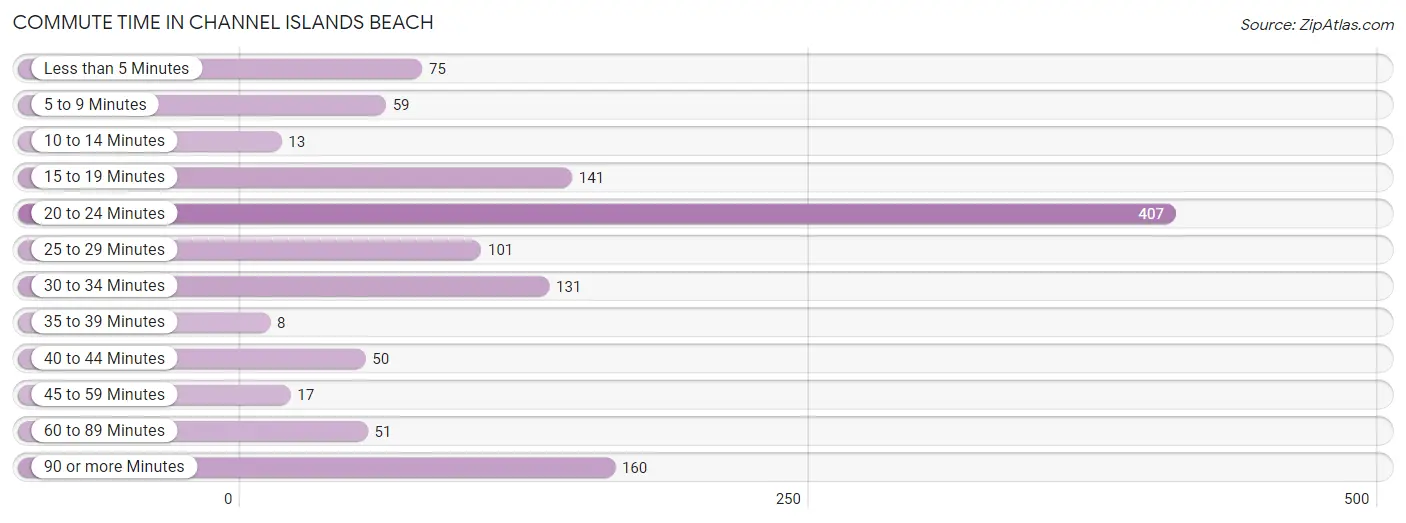
| Commute Time | # Commuters | % Commuters |
| Less than 5 Minutes | 75 | 6.2% |
| 5 to 9 Minutes | 59 | 4.9% |
| 10 to 14 Minutes | 13 | 1.1% |
| 15 to 19 Minutes | 141 | 11.6% |
| 20 to 24 Minutes | 407 | 33.6% |
| 25 to 29 Minutes | 101 | 8.3% |
| 30 to 34 Minutes | 131 | 10.8% |
| 35 to 39 Minutes | 8 | 0.7% |
| 40 to 44 Minutes | 50 | 4.1% |
| 45 to 59 Minutes | 17 | 1.4% |
| 60 to 89 Minutes | 51 | 4.2% |
| 90 or more Minutes | 160 | 13.2% |
Commute Time by Sex in Channel Islands Beach
The most common commute times in Channel Islands Beach are 20 to 24 minutes (284 commuters, 42.1%) for males and 20 to 24 minutes (123 commuters, 22.9%) for females.
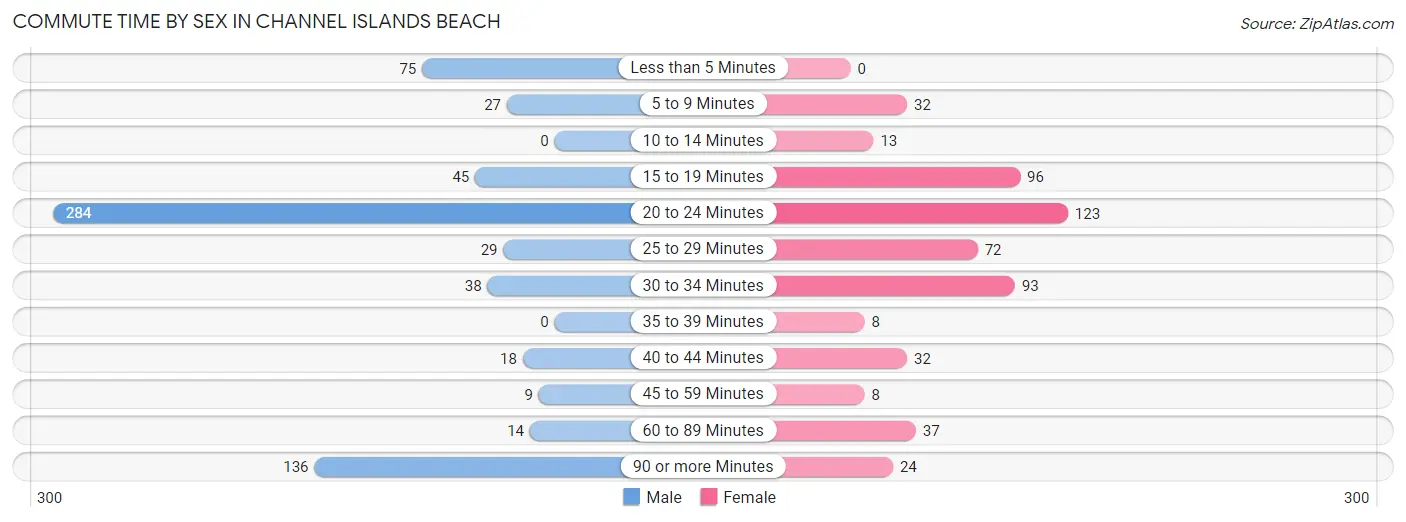
| Commute Time | Male | Female |
| Less than 5 Minutes | 75 (11.1%) | 0 (0.0%) |
| 5 to 9 Minutes | 27 (4.0%) | 32 (5.9%) |
| 10 to 14 Minutes | 0 (0.0%) | 13 (2.4%) |
| 15 to 19 Minutes | 45 (6.7%) | 96 (17.8%) |
| 20 to 24 Minutes | 284 (42.1%) | 123 (22.9%) |
| 25 to 29 Minutes | 29 (4.3%) | 72 (13.4%) |
| 30 to 34 Minutes | 38 (5.6%) | 93 (17.3%) |
| 35 to 39 Minutes | 0 (0.0%) | 8 (1.5%) |
| 40 to 44 Minutes | 18 (2.7%) | 32 (5.9%) |
| 45 to 59 Minutes | 9 (1.3%) | 8 (1.5%) |
| 60 to 89 Minutes | 14 (2.1%) | 37 (6.9%) |
| 90 or more Minutes | 136 (20.2%) | 24 (4.5%) |
Time of Departure to Work by Sex in Channel Islands Beach
The most frequent times of departure to work in Channel Islands Beach are 8:00 AM to 8:29 AM (277, 41.0%) for males and 7:30 AM to 7:59 AM (193, 35.9%) for females.
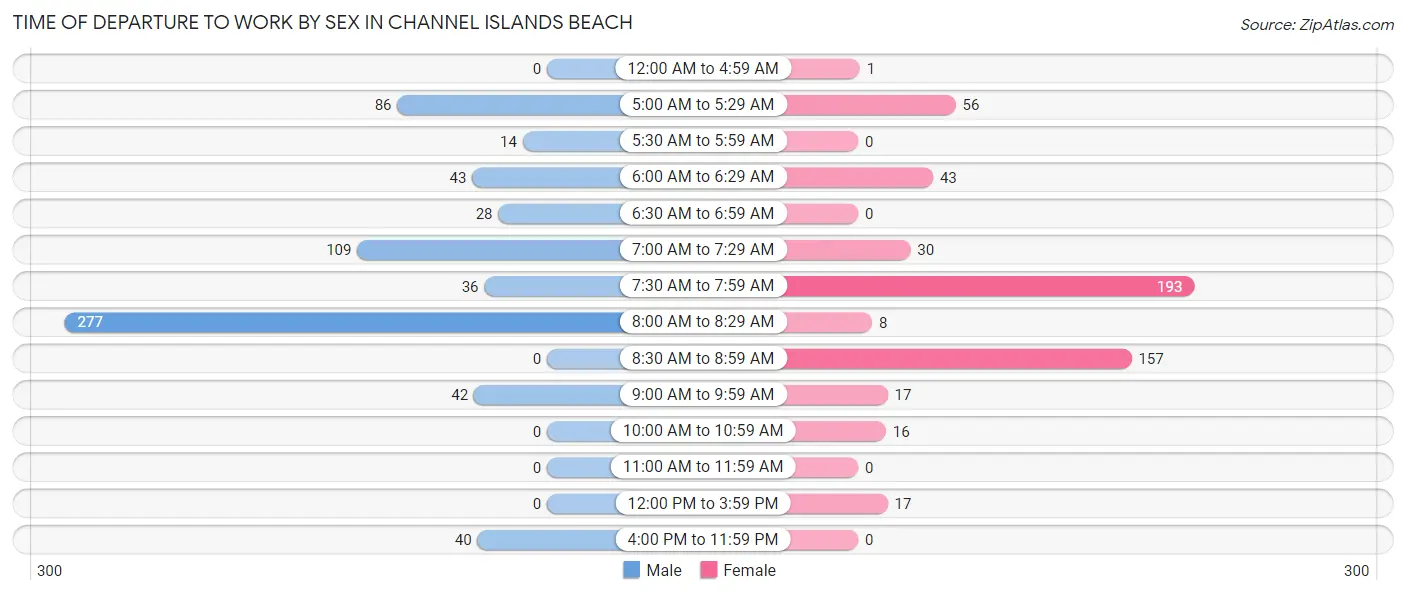
| Time of Departure | Male | Female |
| 12:00 AM to 4:59 AM | 0 (0.0%) | 1 (0.2%) |
| 5:00 AM to 5:29 AM | 86 (12.7%) | 56 (10.4%) |
| 5:30 AM to 5:59 AM | 14 (2.1%) | 0 (0.0%) |
| 6:00 AM to 6:29 AM | 43 (6.4%) | 43 (8.0%) |
| 6:30 AM to 6:59 AM | 28 (4.2%) | 0 (0.0%) |
| 7:00 AM to 7:29 AM | 109 (16.2%) | 30 (5.6%) |
| 7:30 AM to 7:59 AM | 36 (5.3%) | 193 (35.9%) |
| 8:00 AM to 8:29 AM | 277 (41.0%) | 8 (1.5%) |
| 8:30 AM to 8:59 AM | 0 (0.0%) | 157 (29.2%) |
| 9:00 AM to 9:59 AM | 42 (6.2%) | 17 (3.2%) |
| 10:00 AM to 10:59 AM | 0 (0.0%) | 16 (3.0%) |
| 11:00 AM to 11:59 AM | 0 (0.0%) | 0 (0.0%) |
| 12:00 PM to 3:59 PM | 0 (0.0%) | 17 (3.2%) |
| 4:00 PM to 11:59 PM | 40 (5.9%) | 0 (0.0%) |
| Total | 675 (100.0%) | 538 (100.0%) |
Housing Occupancy in Channel Islands Beach
Occupancy by Ownership in Channel Islands Beach
Of the total 1,296 dwellings in Channel Islands Beach, owner-occupied units account for 579 (44.7%), while renter-occupied units make up 717 (55.3%).
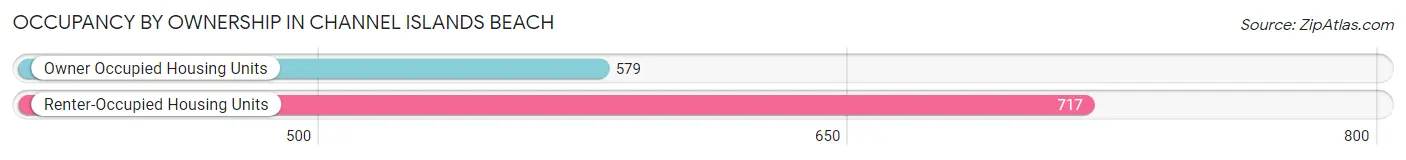
| Occupancy | # Housing Units | % Housing Units |
| Owner Occupied Housing Units | 579 | 44.7% |
| Renter-Occupied Housing Units | 717 | 55.3% |
| Total Occupied Housing Units | 1,296 | 100.0% |
Occupancy by Household Size in Channel Islands Beach
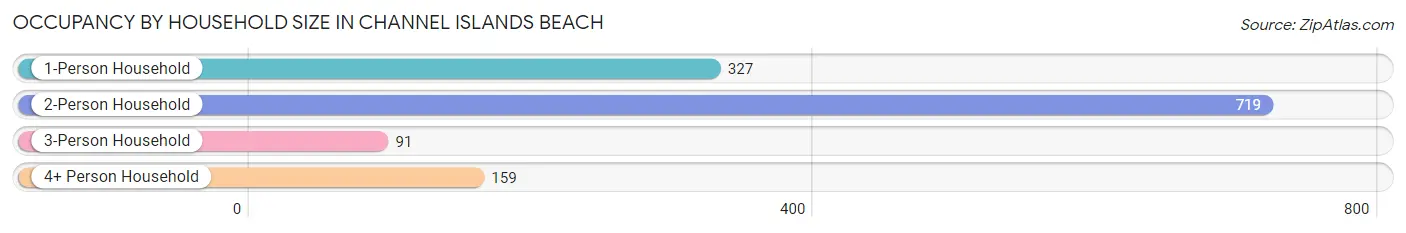
| Household Size | # Housing Units | % Housing Units |
| 1-Person Household | 327 | 25.2% |
| 2-Person Household | 719 | 55.5% |
| 3-Person Household | 91 | 7.0% |
| 4+ Person Household | 159 | 12.3% |
| Total Housing Units | 1,296 | 100.0% |
Occupancy by Ownership by Household Size in Channel Islands Beach
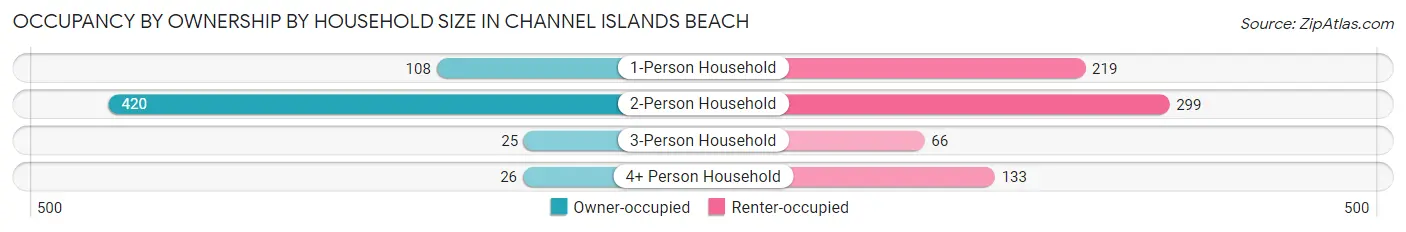
| Household Size | Owner-occupied | Renter-occupied |
| 1-Person Household | 108 (33.0%) | 219 (67.0%) |
| 2-Person Household | 420 (58.4%) | 299 (41.6%) |
| 3-Person Household | 25 (27.5%) | 66 (72.5%) |
| 4+ Person Household | 26 (16.4%) | 133 (83.7%) |
| Total Housing Units | 579 (44.7%) | 717 (55.3%) |
Occupancy by Educational Attainment in Channel Islands Beach
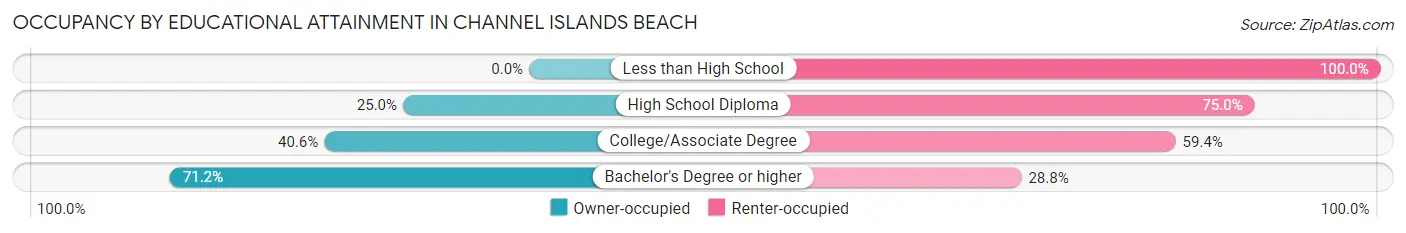
| Household Size | Owner-occupied | Renter-occupied |
| Less than High School | 0 (0.0%) | 86 (100.0%) |
| High School Diploma | 62 (25.0%) | 186 (75.0%) |
| College/Associate Degree | 223 (40.6%) | 326 (59.4%) |
| Bachelor's Degree or higher | 294 (71.2%) | 119 (28.8%) |
Occupancy by Age of Householder in Channel Islands Beach
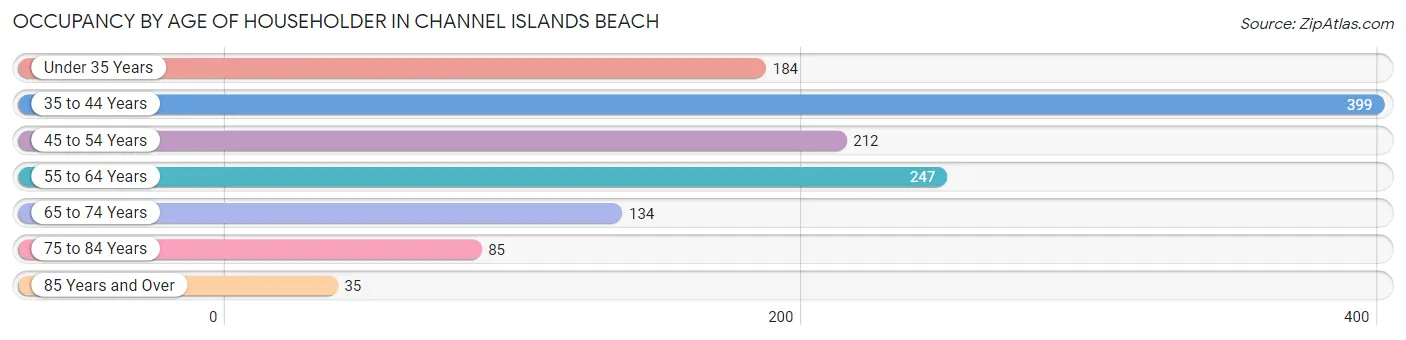
| Age Bracket | # Households | % Households |
| Under 35 Years | 184 | 14.2% |
| 35 to 44 Years | 399 | 30.8% |
| 45 to 54 Years | 212 | 16.4% |
| 55 to 64 Years | 247 | 19.1% |
| 65 to 74 Years | 134 | 10.3% |
| 75 to 84 Years | 85 | 6.6% |
| 85 Years and Over | 35 | 2.7% |
| Total | 1,296 | 100.0% |
Housing Finances in Channel Islands Beach
Median Income by Occupancy in Channel Islands Beach
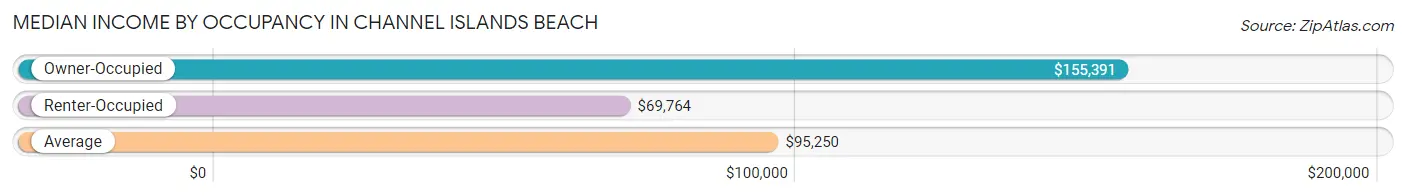
| Occupancy Type | # Households | Median Income |
| Owner-Occupied | 579 (44.7%) | $155,391 |
| Renter-Occupied | 717 (55.3%) | $69,764 |
| Average | 1,296 (100.0%) | $95,250 |
Occupancy by Householder Income Bracket in Channel Islands Beach
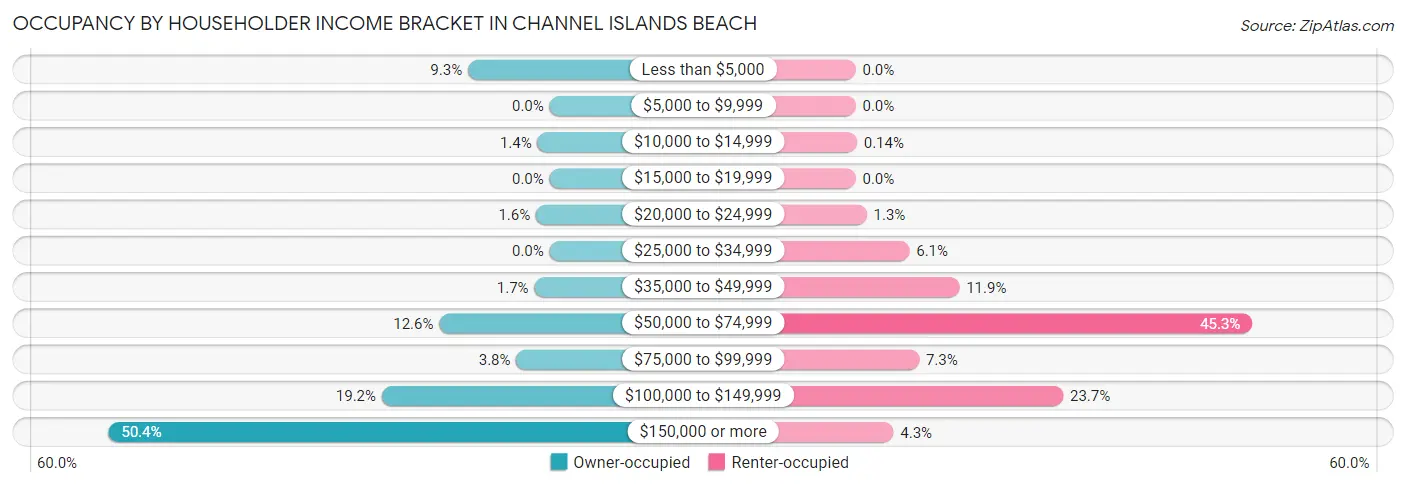
| Income Bracket | Owner-occupied | Renter-occupied |
| Less than $5,000 | 54 (9.3%) | 0 (0.0%) |
| $5,000 to $9,999 | 0 (0.0%) | 0 (0.0%) |
| $10,000 to $14,999 | 8 (1.4%) | 1 (0.1%) |
| $15,000 to $19,999 | 0 (0.0%) | 0 (0.0%) |
| $20,000 to $24,999 | 9 (1.5%) | 9 (1.3%) |
| $25,000 to $34,999 | 0 (0.0%) | 44 (6.1%) |
| $35,000 to $49,999 | 10 (1.7%) | 85 (11.8%) |
| $50,000 to $74,999 | 73 (12.6%) | 325 (45.3%) |
| $75,000 to $99,999 | 22 (3.8%) | 52 (7.2%) |
| $100,000 to $149,999 | 111 (19.2%) | 170 (23.7%) |
| $150,000 or more | 292 (50.4%) | 31 (4.3%) |
| Total | 579 (100.0%) | 717 (100.0%) |
Monthly Housing Cost Tiers in Channel Islands Beach
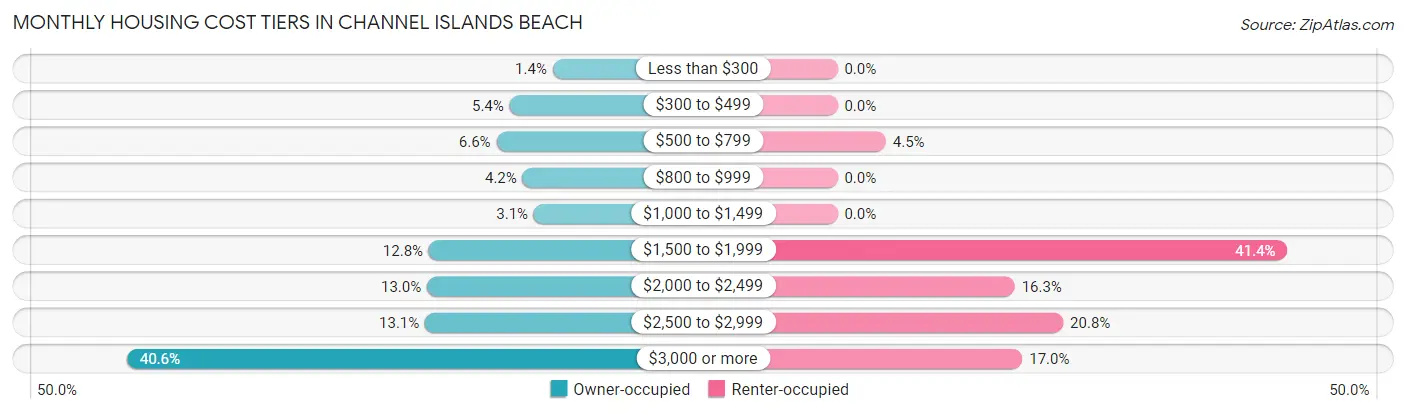
| Monthly Cost | Owner-occupied | Renter-occupied |
| Less than $300 | 8 (1.4%) | 0 (0.0%) |
| $300 to $499 | 31 (5.3%) | 0 (0.0%) |
| $500 to $799 | 38 (6.6%) | 32 (4.5%) |
| $800 to $999 | 24 (4.2%) | 0 (0.0%) |
| $1,000 to $1,499 | 18 (3.1%) | 0 (0.0%) |
| $1,500 to $1,999 | 74 (12.8%) | 297 (41.4%) |
| $2,000 to $2,499 | 75 (13.0%) | 117 (16.3%) |
| $2,500 to $2,999 | 76 (13.1%) | 149 (20.8%) |
| $3,000 or more | 235 (40.6%) | 122 (17.0%) |
| Total | 579 (100.0%) | 717 (100.0%) |
Physical Housing Characteristics in Channel Islands Beach
Housing Structures in Channel Islands Beach
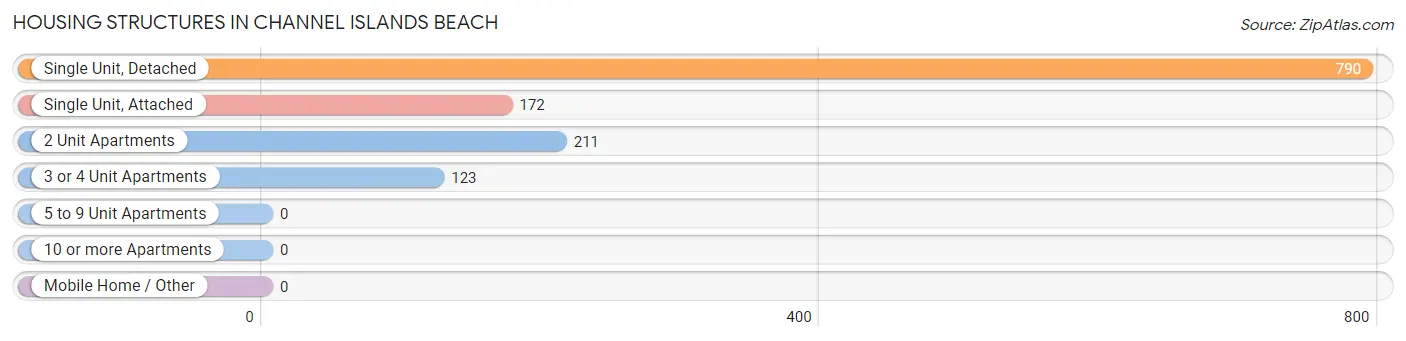
| Structure Type | # Housing Units | % Housing Units |
| Single Unit, Detached | 790 | 61.0% |
| Single Unit, Attached | 172 | 13.3% |
| 2 Unit Apartments | 211 | 16.3% |
| 3 or 4 Unit Apartments | 123 | 9.5% |
| 5 to 9 Unit Apartments | 0 | 0.0% |
| 10 or more Apartments | 0 | 0.0% |
| Mobile Home / Other | 0 | 0.0% |
| Total | 1,296 | 100.0% |
Housing Structures by Occupancy in Channel Islands Beach
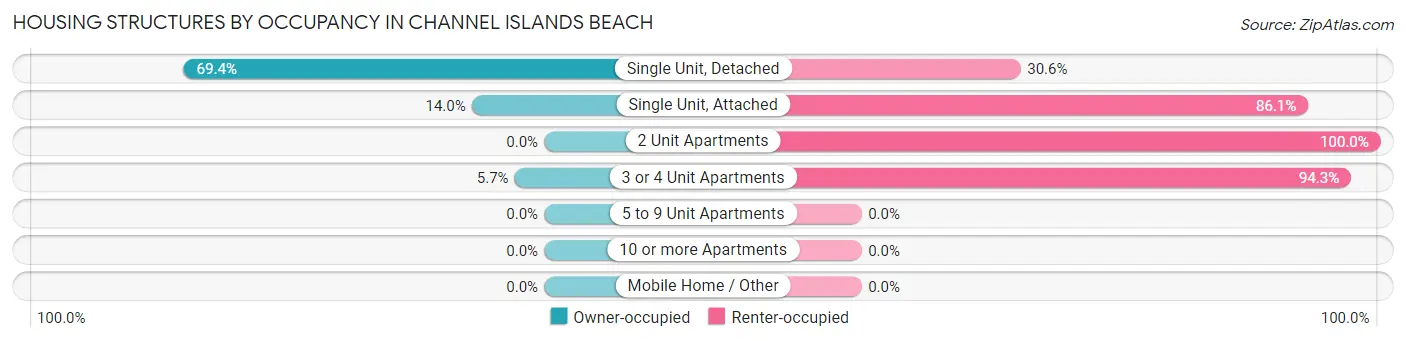
| Structure Type | Owner-occupied | Renter-occupied |
| Single Unit, Detached | 548 (69.4%) | 242 (30.6%) |
| Single Unit, Attached | 24 (14.0%) | 148 (86.1%) |
| 2 Unit Apartments | 0 (0.0%) | 211 (100.0%) |
| 3 or 4 Unit Apartments | 7 (5.7%) | 116 (94.3%) |
| 5 to 9 Unit Apartments | 0 (0.0%) | 0 (0.0%) |
| 10 or more Apartments | 0 (0.0%) | 0 (0.0%) |
| Mobile Home / Other | 0 (0.0%) | 0 (0.0%) |
| Total | 579 (44.7%) | 717 (55.3%) |
Housing Structures by Number of Rooms in Channel Islands Beach
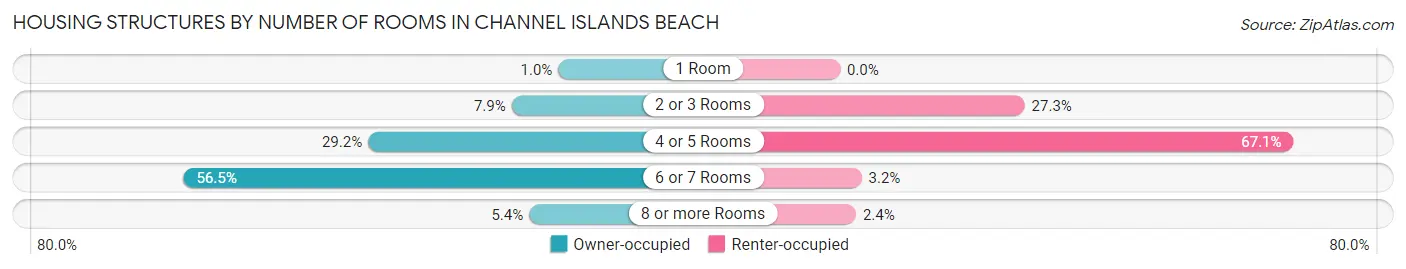
| Number of Rooms | Owner-occupied | Renter-occupied |
| 1 Room | 6 (1.0%) | 0 (0.0%) |
| 2 or 3 Rooms | 46 (7.9%) | 196 (27.3%) |
| 4 or 5 Rooms | 169 (29.2%) | 481 (67.1%) |
| 6 or 7 Rooms | 327 (56.5%) | 23 (3.2%) |
| 8 or more Rooms | 31 (5.3%) | 17 (2.4%) |
| Total | 579 (100.0%) | 717 (100.0%) |
Housing Structure by Heating Type in Channel Islands Beach
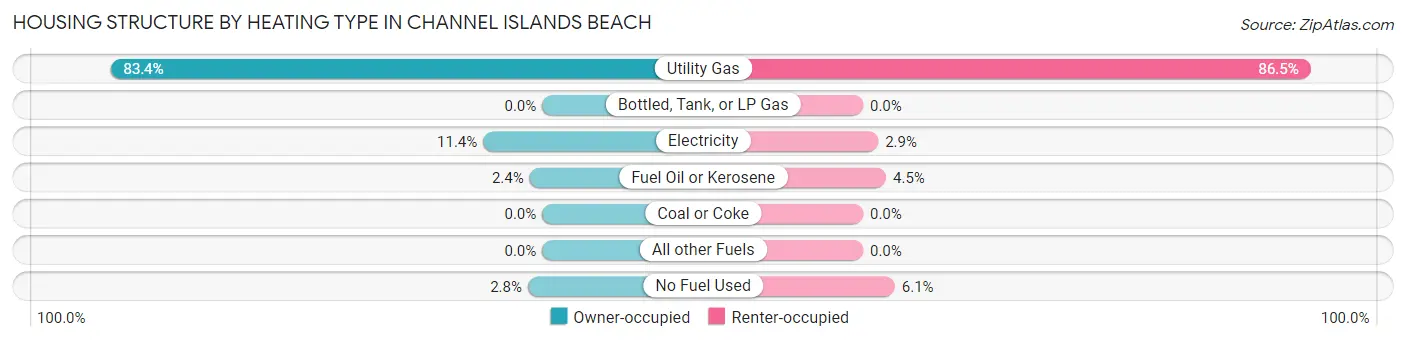
| Heating Type | Owner-occupied | Renter-occupied |
| Utility Gas | 483 (83.4%) | 620 (86.5%) |
| Bottled, Tank, or LP Gas | 0 (0.0%) | 0 (0.0%) |
| Electricity | 66 (11.4%) | 21 (2.9%) |
| Fuel Oil or Kerosene | 14 (2.4%) | 32 (4.5%) |
| Coal or Coke | 0 (0.0%) | 0 (0.0%) |
| All other Fuels | 0 (0.0%) | 0 (0.0%) |
| No Fuel Used | 16 (2.8%) | 44 (6.1%) |
| Total | 579 (100.0%) | 717 (100.0%) |
Household Vehicle Usage in Channel Islands Beach
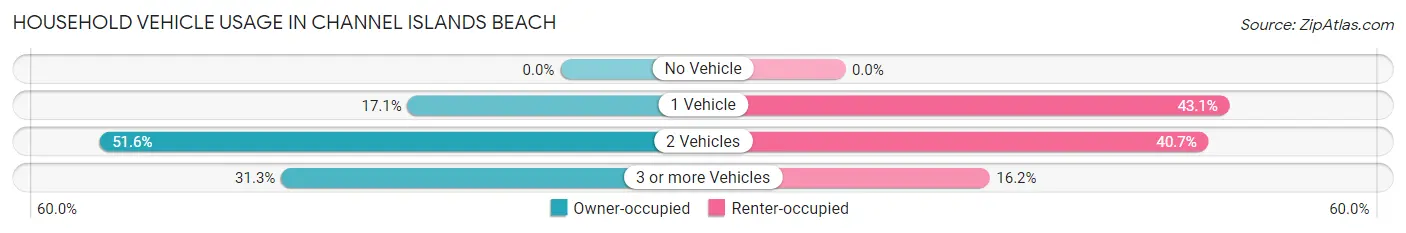
| Vehicles per Household | Owner-occupied | Renter-occupied |
| No Vehicle | 0 (0.0%) | 0 (0.0%) |
| 1 Vehicle | 99 (17.1%) | 309 (43.1%) |
| 2 Vehicles | 299 (51.6%) | 292 (40.7%) |
| 3 or more Vehicles | 181 (31.3%) | 116 (16.2%) |
| Total | 579 (100.0%) | 717 (100.0%) |
Real Estate & Mortgages in Channel Islands Beach
Real Estate and Mortgage Overview in Channel Islands Beach
| Characteristic | Without Mortgage | With Mortgage |
| Housing Units | 118 | 461 |
| Median Property Value | $993,400 | $933,300 |
| Median Household Income | $157,586 | $232 |
| Monthly Housing Costs | $797 | $235 |
| Real Estate Taxes | $6,111 | $0 |
Property Value by Mortgage Status in Channel Islands Beach
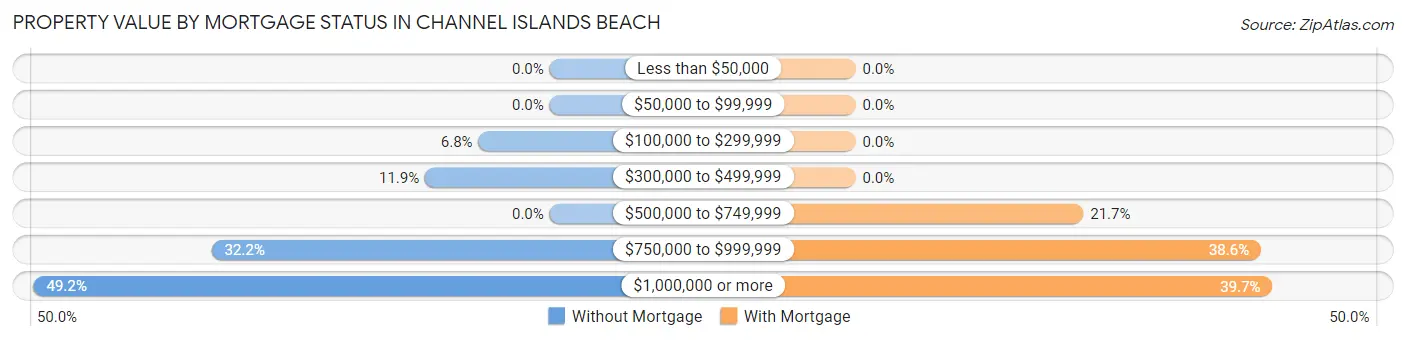
| Property Value | Without Mortgage | With Mortgage |
| Less than $50,000 | 0 (0.0%) | 0 (0.0%) |
| $50,000 to $99,999 | 0 (0.0%) | 0 (0.0%) |
| $100,000 to $299,999 | 8 (6.8%) | 0 (0.0%) |
| $300,000 to $499,999 | 14 (11.9%) | 0 (0.0%) |
| $500,000 to $749,999 | 0 (0.0%) | 100 (21.7%) |
| $750,000 to $999,999 | 38 (32.2%) | 178 (38.6%) |
| $1,000,000 or more | 58 (49.1%) | 183 (39.7%) |
| Total | 118 (100.0%) | 461 (100.0%) |
Household Income by Mortgage Status in Channel Islands Beach
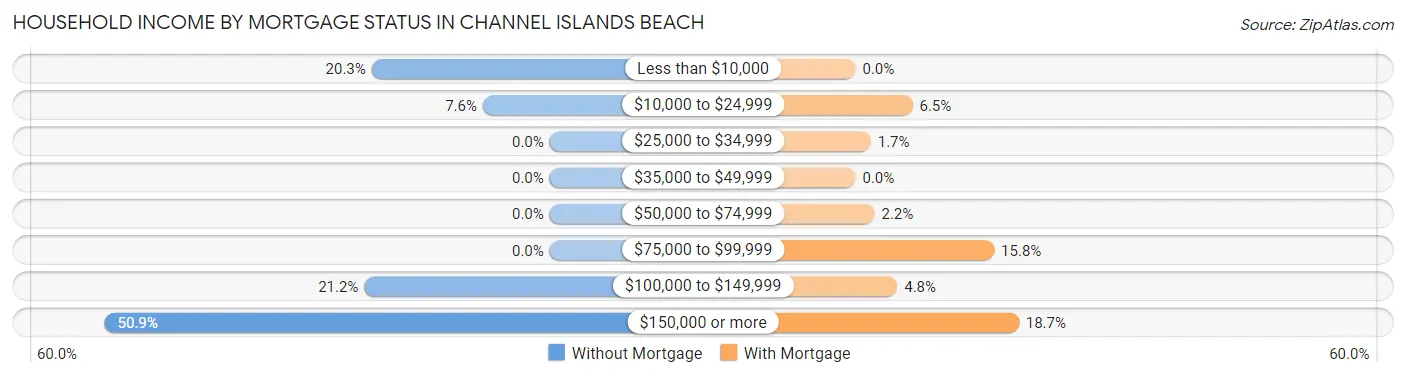
| Household Income | Without Mortgage | With Mortgage |
| Less than $10,000 | 24 (20.3%) | 0 (0.0%) |
| $10,000 to $24,999 | 9 (7.6%) | 30 (6.5%) |
| $25,000 to $34,999 | 0 (0.0%) | 8 (1.7%) |
| $35,000 to $49,999 | 0 (0.0%) | 0 (0.0%) |
| $50,000 to $74,999 | 0 (0.0%) | 10 (2.2%) |
| $75,000 to $99,999 | 0 (0.0%) | 73 (15.8%) |
| $100,000 to $149,999 | 25 (21.2%) | 22 (4.8%) |
| $150,000 or more | 60 (50.8%) | 86 (18.7%) |
| Total | 118 (100.0%) | 461 (100.0%) |
Property Value to Household Income Ratio in Channel Islands Beach
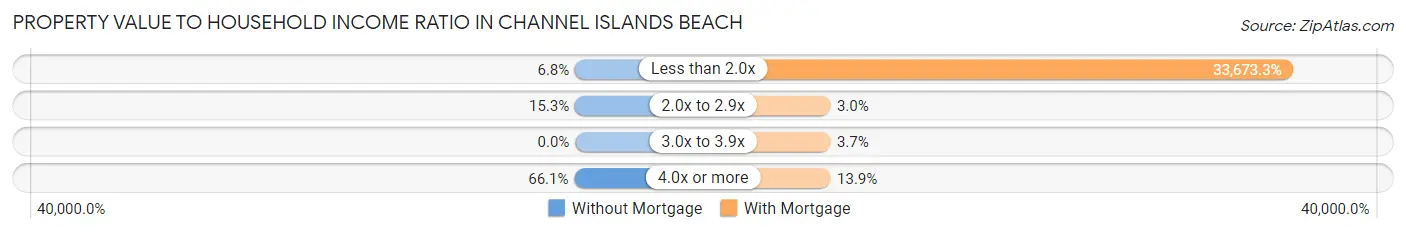
| Value-to-Income Ratio | Without Mortgage | With Mortgage |
| Less than 2.0x | 8 (6.8%) | 155,234 (33,673.3%) |
| 2.0x to 2.9x | 18 (15.2%) | 14 (3.0%) |
| 3.0x to 3.9x | 0 (0.0%) | 17 (3.7%) |
| 4.0x or more | 78 (66.1%) | 64 (13.9%) |
| Total | 118 (100.0%) | 461 (100.0%) |
Real Estate Taxes by Mortgage Status in Channel Islands Beach
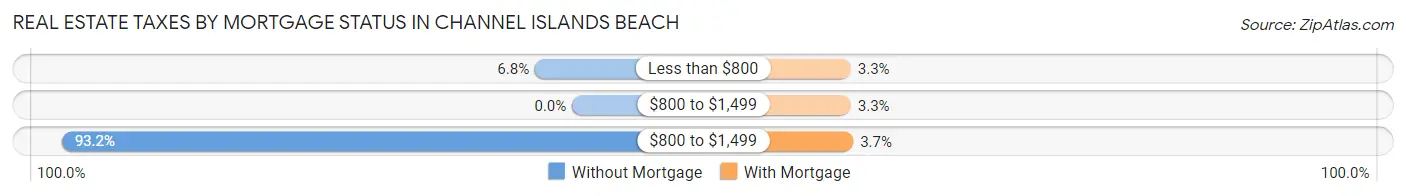
| Property Taxes | Without Mortgage | With Mortgage |
| Less than $800 | 8 (6.8%) | 15 (3.3%) |
| $800 to $1,499 | 0 (0.0%) | 15 (3.3%) |
| $800 to $1,499 | 110 (93.2%) | 17 (3.7%) |
| Total | 118 (100.0%) | 461 (100.0%) |
Health & Disability in Channel Islands Beach
Health Insurance Coverage by Age in Channel Islands Beach
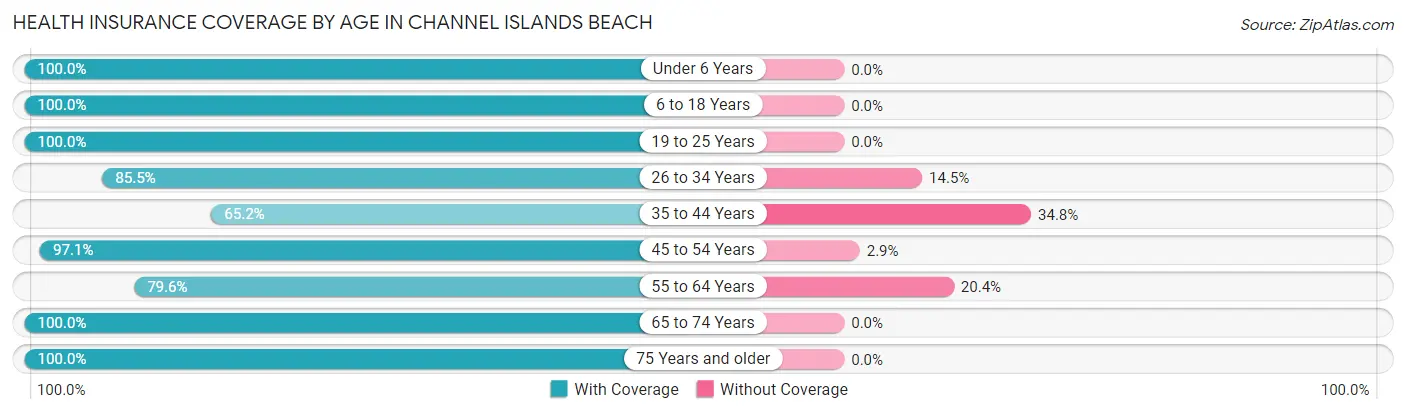
| Age Bracket | With Coverage | Without Coverage |
| Under 6 Years | 50 (100.0%) | 0 (0.0%) |
| 6 to 18 Years | 450 (100.0%) | 0 (0.0%) |
| 19 to 25 Years | 102 (100.0%) | 0 (0.0%) |
| 26 to 34 Years | 259 (85.5%) | 44 (14.5%) |
| 35 to 44 Years | 417 (65.2%) | 223 (34.8%) |
| 45 to 54 Years | 302 (97.1%) | 9 (2.9%) |
| 55 to 64 Years | 362 (79.6%) | 93 (20.4%) |
| 65 to 74 Years | 240 (100.0%) | 0 (0.0%) |
| 75 Years and older | 157 (100.0%) | 0 (0.0%) |
| Total | 2,339 (86.4%) | 369 (13.6%) |
Health Insurance Coverage by Citizenship Status in Channel Islands Beach
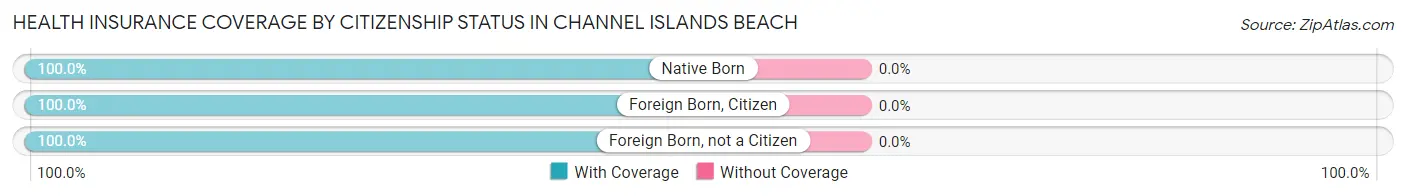
| Citizenship Status | With Coverage | Without Coverage |
| Native Born | 50 (100.0%) | 0 (0.0%) |
| Foreign Born, Citizen | 450 (100.0%) | 0 (0.0%) |
| Foreign Born, not a Citizen | 102 (100.0%) | 0 (0.0%) |
Health Insurance Coverage by Household Income in Channel Islands Beach
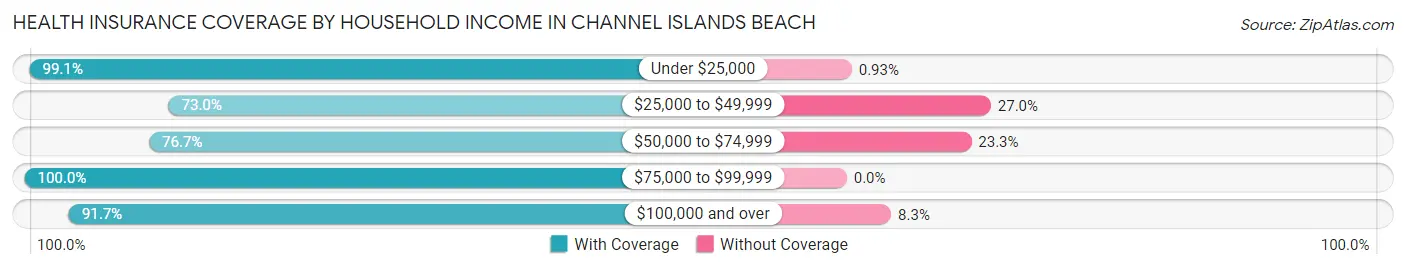
| Household Income | With Coverage | Without Coverage |
| Under $25,000 | 107 (99.1%) | 1 (0.9%) |
| $25,000 to $49,999 | 119 (73.0%) | 44 (27.0%) |
| $50,000 to $74,999 | 680 (76.7%) | 207 (23.3%) |
| $75,000 to $99,999 | 142 (100.0%) | 0 (0.0%) |
| $100,000 and over | 1,291 (91.7%) | 117 (8.3%) |
Public vs Private Health Insurance Coverage by Age in Channel Islands Beach
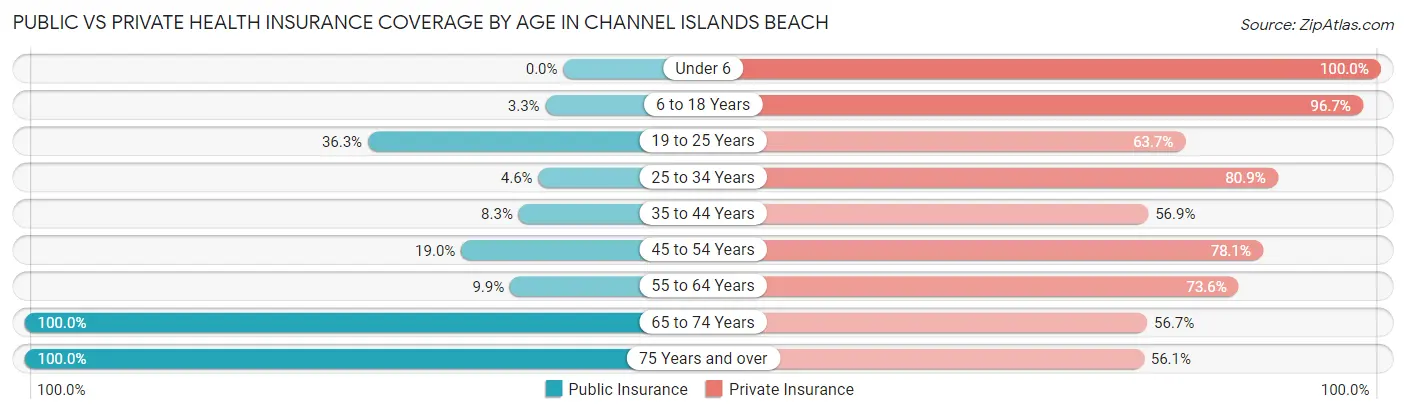
| Age Bracket | Public Insurance | Private Insurance |
| Under 6 | 0 (0.0%) | 50 (100.0%) |
| 6 to 18 Years | 15 (3.3%) | 435 (96.7%) |
| 19 to 25 Years | 37 (36.3%) | 65 (63.7%) |
| 25 to 34 Years | 14 (4.6%) | 245 (80.9%) |
| 35 to 44 Years | 53 (8.3%) | 364 (56.9%) |
| 45 to 54 Years | 59 (19.0%) | 243 (78.1%) |
| 55 to 64 Years | 45 (9.9%) | 335 (73.6%) |
| 65 to 74 Years | 240 (100.0%) | 136 (56.7%) |
| 75 Years and over | 157 (100.0%) | 88 (56.0%) |
| Total | 620 (22.9%) | 1,961 (72.4%) |
Disability Status by Sex by Age in Channel Islands Beach
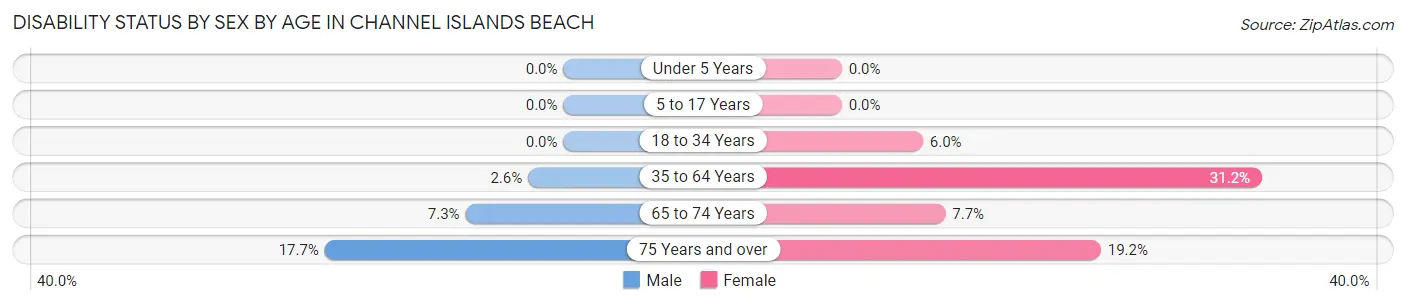
| Age Bracket | Male | Female |
| Under 5 Years | 0 (0.0%) | 0 (0.0%) |
| 5 to 17 Years | 0 (0.0%) | 0 (0.0%) |
| 18 to 34 Years | 0 (0.0%) | 15 (6.0%) |
| 35 to 64 Years | 21 (2.6%) | 189 (31.2%) |
| 65 to 74 Years | 8 (7.3%) | 10 (7.7%) |
| 75 Years and over | 14 (17.7%) | 15 (19.2%) |
Disability Class by Sex by Age in Channel Islands Beach
Disability Class: Hearing Difficulty
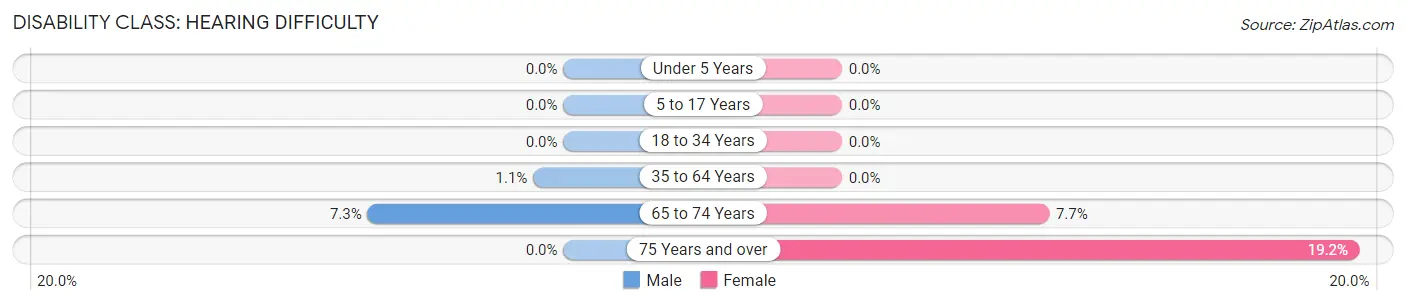
| Age Bracket | Male | Female |
| Under 5 Years | 0 (0.0%) | 0 (0.0%) |
| 5 to 17 Years | 0 (0.0%) | 0 (0.0%) |
| 18 to 34 Years | 0 (0.0%) | 0 (0.0%) |
| 35 to 64 Years | 9 (1.1%) | 0 (0.0%) |
| 65 to 74 Years | 8 (7.3%) | 10 (7.7%) |
| 75 Years and over | 0 (0.0%) | 15 (19.2%) |
Disability Class: Vision Difficulty
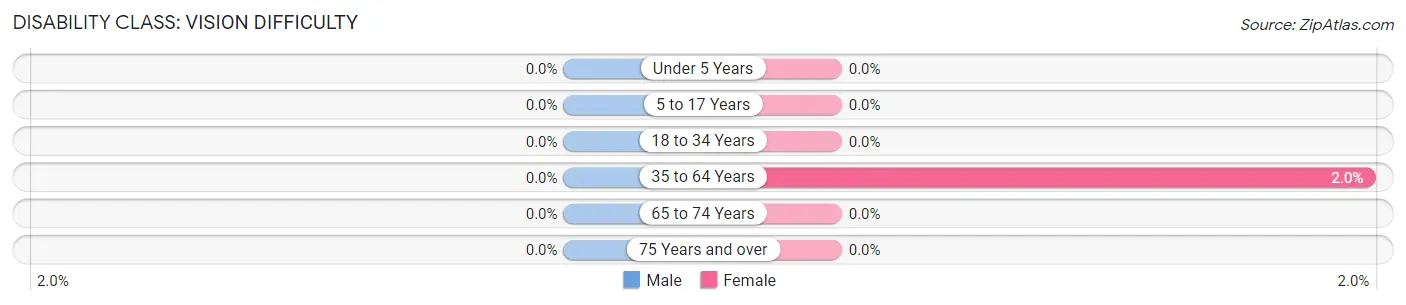
| Age Bracket | Male | Female |
| Under 5 Years | 0 (0.0%) | 0 (0.0%) |
| 5 to 17 Years | 0 (0.0%) | 0 (0.0%) |
| 18 to 34 Years | 0 (0.0%) | 0 (0.0%) |
| 35 to 64 Years | 0 (0.0%) | 12 (2.0%) |
| 65 to 74 Years | 0 (0.0%) | 0 (0.0%) |
| 75 Years and over | 0 (0.0%) | 0 (0.0%) |
Disability Class: Cognitive Difficulty
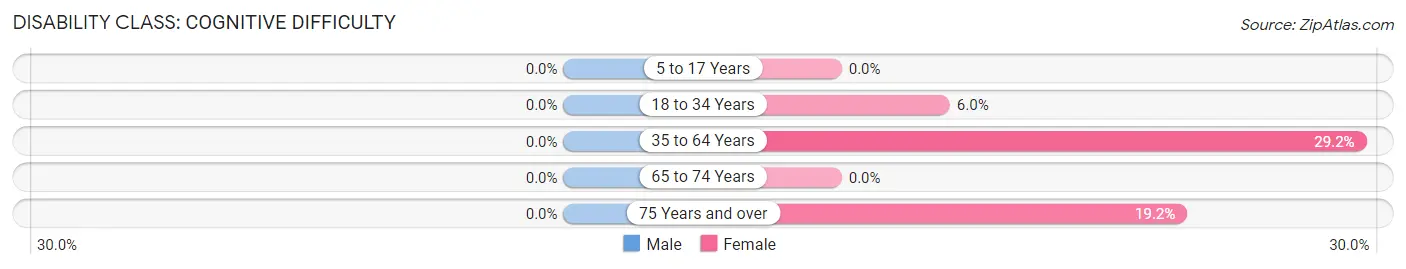
| Age Bracket | Male | Female |
| 5 to 17 Years | 0 (0.0%) | 0 (0.0%) |
| 18 to 34 Years | 0 (0.0%) | 15 (6.0%) |
| 35 to 64 Years | 0 (0.0%) | 177 (29.2%) |
| 65 to 74 Years | 0 (0.0%) | 0 (0.0%) |
| 75 Years and over | 0 (0.0%) | 15 (19.2%) |
Disability Class: Ambulatory Difficulty
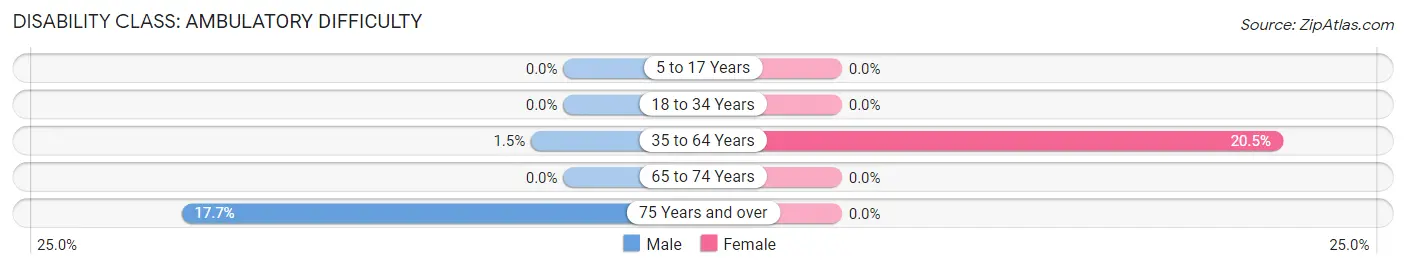
| Age Bracket | Male | Female |
| 5 to 17 Years | 0 (0.0%) | 0 (0.0%) |
| 18 to 34 Years | 0 (0.0%) | 0 (0.0%) |
| 35 to 64 Years | 12 (1.5%) | 124 (20.5%) |
| 65 to 74 Years | 0 (0.0%) | 0 (0.0%) |
| 75 Years and over | 14 (17.7%) | 0 (0.0%) |
Disability Class: Self-Care Difficulty
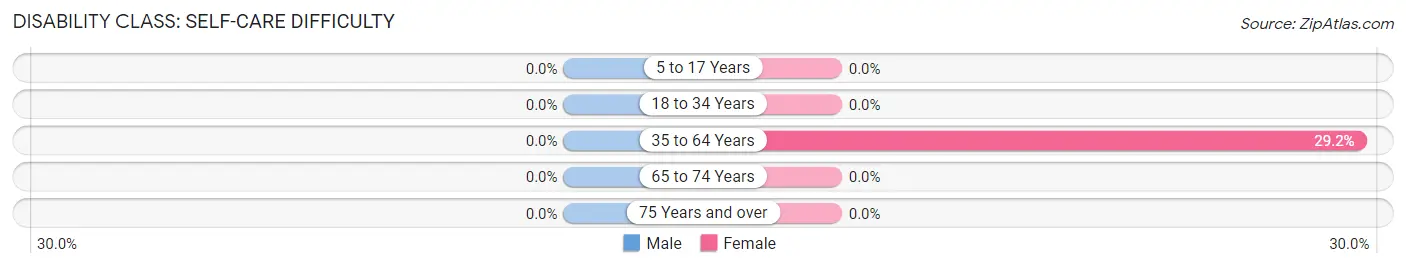
| Age Bracket | Male | Female |
| 5 to 17 Years | 0 (0.0%) | 0 (0.0%) |
| 18 to 34 Years | 0 (0.0%) | 0 (0.0%) |
| 35 to 64 Years | 0 (0.0%) | 177 (29.2%) |
| 65 to 74 Years | 0 (0.0%) | 0 (0.0%) |
| 75 Years and over | 0 (0.0%) | 0 (0.0%) |
Technology Access in Channel Islands Beach
Computing Device Access in Channel Islands Beach
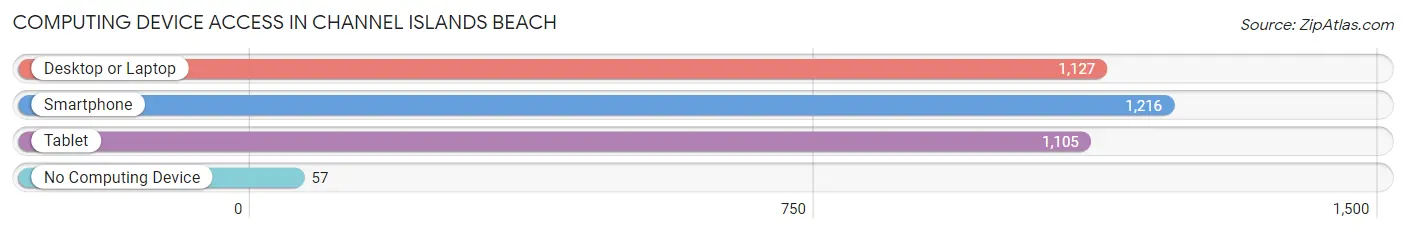
| Device Type | # Households | % Households |
| Desktop or Laptop | 1,127 | 87.0% |
| Smartphone | 1,216 | 93.8% |
| Tablet | 1,105 | 85.3% |
| No Computing Device | 57 | 4.4% |
| Total | 1,296 | 100.0% |
Internet Access in Channel Islands Beach
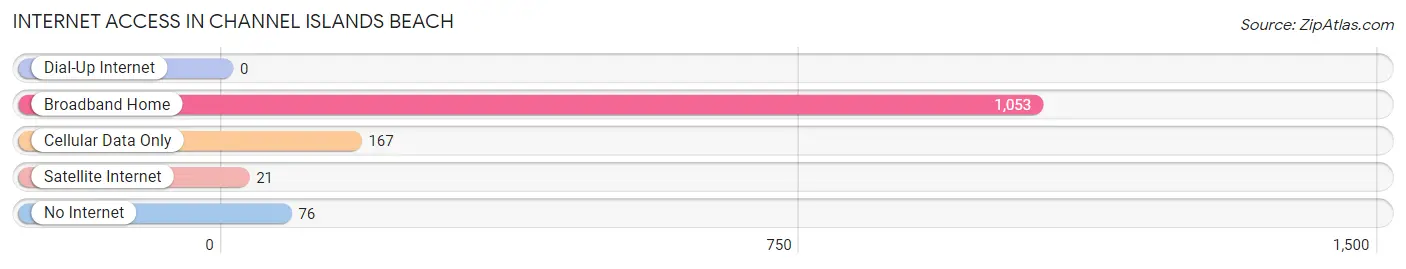
| Internet Type | # Households | % Households |
| Dial-Up Internet | 0 | 0.0% |
| Broadband Home | 1,053 | 81.2% |
| Cellular Data Only | 167 | 12.9% |
| Satellite Internet | 21 | 1.6% |
| No Internet | 76 | 5.9% |
| Total | 1,296 | 100.0% |
Channel Islands Beach Summary
The Channel Islands Beach is a small beach community located in Ventura County, California. It is situated on the eastern side of the Channel Islands, a chain of eight islands off the coast of Southern California. The community is located on the mainland, just south of the city of Oxnard. The population of Channel Islands Beach was estimated to be 1,845 in 2019.
Geography
Channel Islands Beach is located on the mainland, just south of the city of Oxnard. It is situated on the eastern side of the Channel Islands, a chain of eight islands off the coast of Southern California. The community is bordered by the Pacific Ocean to the south, the Santa Clara River to the east, and the Santa Monica Mountains to the north. The climate in Channel Islands Beach is mild and temperate, with average temperatures ranging from the mid-50s to the mid-70s.
Economy
The economy of Channel Islands Beach is largely based on tourism. The community is home to a number of hotels, restaurants, and other businesses that cater to visitors. The area is also home to a number of marinas, which provide access to the Channel Islands and the Pacific Ocean. Additionally, the community is home to a number of small businesses, including retail stores, auto repair shops, and other services.
Demographics
The population of Channel Islands Beach was estimated to be 1,845 in 2019. The racial makeup of the community was 79.2% White, 8.2% Hispanic or Latino, 6.2% Asian, 4.2% African American, and 2.2% other. The median household income in Channel Islands Beach was $68,945 in 2019, and the median home value was $717,000.
History
The area now known as Channel Islands Beach has been inhabited for thousands of years. The Chumash people were the first known inhabitants of the area, and they lived in the area for centuries before the arrival of Europeans. The area was first explored by Europeans in the late 1700s, and the first settlement was established in the early 1800s. The community was officially incorporated in 1947.
In recent years, Channel Islands Beach has become a popular destination for tourists and locals alike. The community is home to a number of attractions, including the Channel Islands National Park, the Channel Islands Maritime Museum, and the Channel Islands Harbor. Additionally, the community is home to a number of restaurants, shops, and other businesses.
Common Questions
What is Per Capita Income in Channel Islands Beach?
Per Capita income in Channel Islands Beach is $63,800.
What is the Median Family Income in Channel Islands Beach?
Median Family Income in Channel Islands Beach is $83,603.
What is the Median Household income in Channel Islands Beach?
Median Household Income in Channel Islands Beach is $95,250.
What is Income or Wage Gap in Channel Islands Beach?
Income or Wage Gap in Channel Islands Beach is 28.9%.
Women in Channel Islands Beach earn 71.1 cents for every dollar earned by a man.
What is Inequality or Gini Index in Channel Islands Beach?
Inequality or Gini Index in Channel Islands Beach is 0.46.
What is the Total Population of Channel Islands Beach?
Total Population of Channel Islands Beach is 2,708.
What is the Total Male Population of Channel Islands Beach?
Total Male Population of Channel Islands Beach is 1,239.
What is the Total Female Population of Channel Islands Beach?
Total Female Population of Channel Islands Beach is 1,469.
What is the Ratio of Males per 100 Females in Channel Islands Beach?
There are 84.34 Males per 100 Females in Channel Islands Beach.
What is the Ratio of Females per 100 Males in Channel Islands Beach?
There are 118.56 Females per 100 Males in Channel Islands Beach.
What is the Median Population Age in Channel Islands Beach?
Median Population Age in Channel Islands Beach is 44.4 Years.
What is the Average Family Size in Channel Islands Beach
Average Family Size in Channel Islands Beach is 2.4 People.
What is the Average Household Size in Channel Islands Beach
Average Household Size in Channel Islands Beach is 2.1 People.
How Large is the Labor Force in Channel Islands Beach?
There are 1,562 People in the Labor Forcein in Channel Islands Beach.
What is the Percentage of People in the Labor Force in Channel Islands Beach?
69.1% of People are in the Labor Force in Channel Islands Beach.
What is the Unemployment Rate in Channel Islands Beach?
Unemployment Rate in Channel Islands Beach is 2.8%.