Richfield, CA Map & Demographics
Richfield Map
Richfield Overview
$27,874
PER CAPITA INCOME
$23,125
AVG HOUSEHOLD INCOME
0.56
INEQUALITY / GINI INDEX
142
TOTAL POPULATION
57
MALE POPULATION
85
FEMALE POPULATION
67.06
MALES / 100 FEMALES
149.12
FEMALES / 100 MALES
59.5
MEDIAN AGE
3.1
AVG FAMILY SIZE
2.0
AVG HOUSEHOLD SIZE
61
LABOR FORCE [ PEOPLE ]
50.0%
PERCENT IN LABOR FORCE
14.8%
UNEMPLOYMENT RATE
Income in Richfield
Income Overview in Richfield
| Characteristic | Number | Measure |
| Per Capita Income | 142 | $27,874 |
| Median Family Income | 34 | $0 |
| Mean Family Income | 34 | $72,838 |
| Median Household Income | 70 | $23,125 |
| Mean Household Income | 70 | $53,893 |
| Income Deficit | 34 | $0 |
| Wage / Income Gap (%) | 142 | 0.00% |
| Wage / Income Gap ($) | 142 | 100.00¢ per $1 |
| Gini / Inequality Index | 142 | 0.56 |
Earnings by Sex in Richfield
| Sex | Number | Average Earnings |
| Male | 31 (54.4%) | $0 |
| Female | 26 (45.6%) | $0 |
| Total | 57 (100.0%) | $0 |
Earnings by Sex by Income Bracket in Richfield
The most common earnings brackets in Richfield are $12,500 to $14,999 for men (8 | 25.8%) and $45,000 to $49,999 for women (7 | 26.9%).
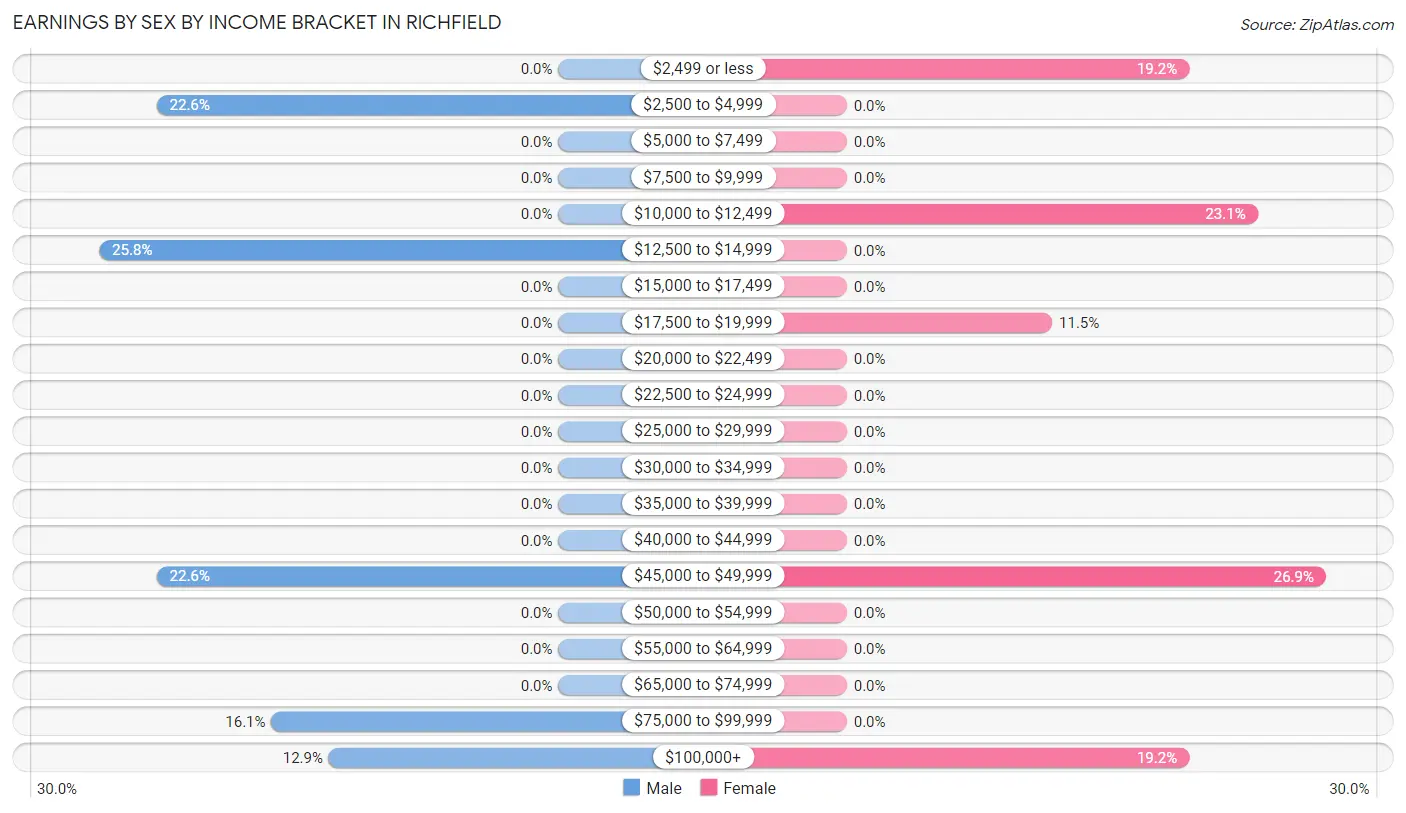
| Income | Male | Female |
| $2,499 or less | 0 (0.0%) | 5 (19.2%) |
| $2,500 to $4,999 | 7 (22.6%) | 0 (0.0%) |
| $5,000 to $7,499 | 0 (0.0%) | 0 (0.0%) |
| $7,500 to $9,999 | 0 (0.0%) | 0 (0.0%) |
| $10,000 to $12,499 | 0 (0.0%) | 6 (23.1%) |
| $12,500 to $14,999 | 8 (25.8%) | 0 (0.0%) |
| $15,000 to $17,499 | 0 (0.0%) | 0 (0.0%) |
| $17,500 to $19,999 | 0 (0.0%) | 3 (11.5%) |
| $20,000 to $22,499 | 0 (0.0%) | 0 (0.0%) |
| $22,500 to $24,999 | 0 (0.0%) | 0 (0.0%) |
| $25,000 to $29,999 | 0 (0.0%) | 0 (0.0%) |
| $30,000 to $34,999 | 0 (0.0%) | 0 (0.0%) |
| $35,000 to $39,999 | 0 (0.0%) | 0 (0.0%) |
| $40,000 to $44,999 | 0 (0.0%) | 0 (0.0%) |
| $45,000 to $49,999 | 7 (22.6%) | 7 (26.9%) |
| $50,000 to $54,999 | 0 (0.0%) | 0 (0.0%) |
| $55,000 to $64,999 | 0 (0.0%) | 0 (0.0%) |
| $65,000 to $74,999 | 0 (0.0%) | 0 (0.0%) |
| $75,000 to $99,999 | 5 (16.1%) | 0 (0.0%) |
| $100,000+ | 4 (12.9%) | 5 (19.2%) |
| Total | 31 (100.0%) | 26 (100.0%) |
Earnings by Sex by Educational Attainment in Richfield
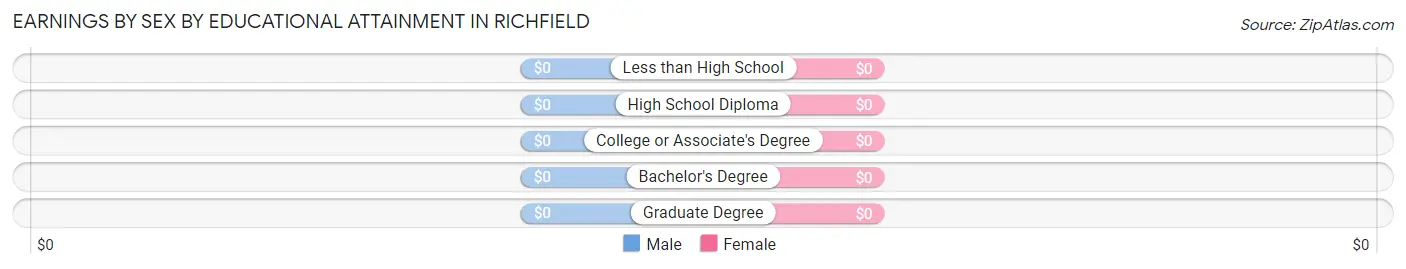
| Educational Attainment | Male Income | Female Income |
| Less than High School | - | - |
| High School Diploma | - | - |
| College or Associate's Degree | - | - |
| Bachelor's Degree | - | - |
| Graduate Degree | - | - |
| Total | - | - |
Family Income in Richfield
Family Income Brackets in Richfield
According to the Richfield family income data, there are 9 families falling into the less than $10,000 income range, which is the most common income bracket and makes up 26.5% of all families.
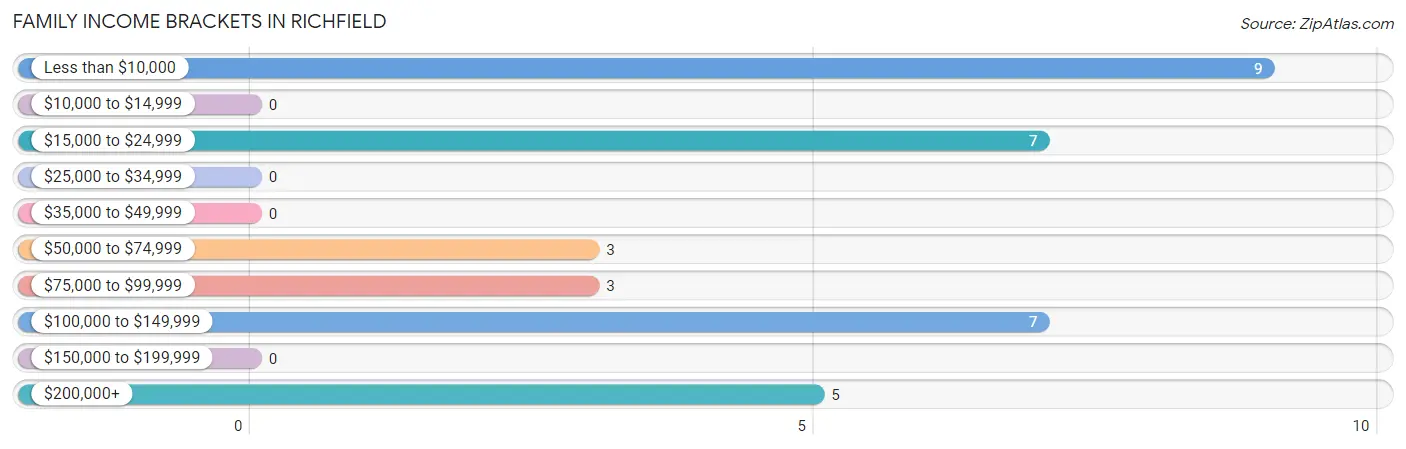
| Income Bracket | # Families | % Families |
| Less than $10,000 | 9 | 26.5% |
| $10,000 to $14,999 | 0 | 0.0% |
| $15,000 to $24,999 | 7 | 20.6% |
| $25,000 to $34,999 | 0 | 0.0% |
| $35,000 to $49,999 | 0 | 0.0% |
| $50,000 to $74,999 | 3 | 8.8% |
| $75,000 to $99,999 | 3 | 8.8% |
| $100,000 to $149,999 | 7 | 20.6% |
| $150,000 to $199,999 | 0 | 0.0% |
| $200,000+ | 5 | 14.7% |
Family Income by Famaliy Size in Richfield
| Income Bracket | # Families | Median Income |
| 2-Person Families | 12 (35.3%) | $0 |
| 3-Person Families | 10 (29.4%) | $0 |
| 4-Person Families | 12 (35.3%) | $0 |
| 5-Person Families | 0 (0.0%) | $0 |
| 6-Person Families | 0 (0.0%) | $0 |
| 7+ Person Families | 0 (0.0%) | $0 |
| Total | 34 (100.0%) | $0 |
Family Income by Number of Earners in Richfield
| Number of Earners | # Families | Median Income |
| No Earners | 7 (20.6%) | $0 |
| 1 Earner | 15 (44.1%) | $0 |
| 2 Earners | 12 (35.3%) | $0 |
| 3+ Earners | 0 (0.0%) | $0 |
| Total | 34 (100.0%) | $0 |
Household Income in Richfield
Household Income Brackets in Richfield
With 14 households falling in the category, the $10,000 to $14,999 income range is the most frequent in Richfield, accounting for 20.0% of all households.
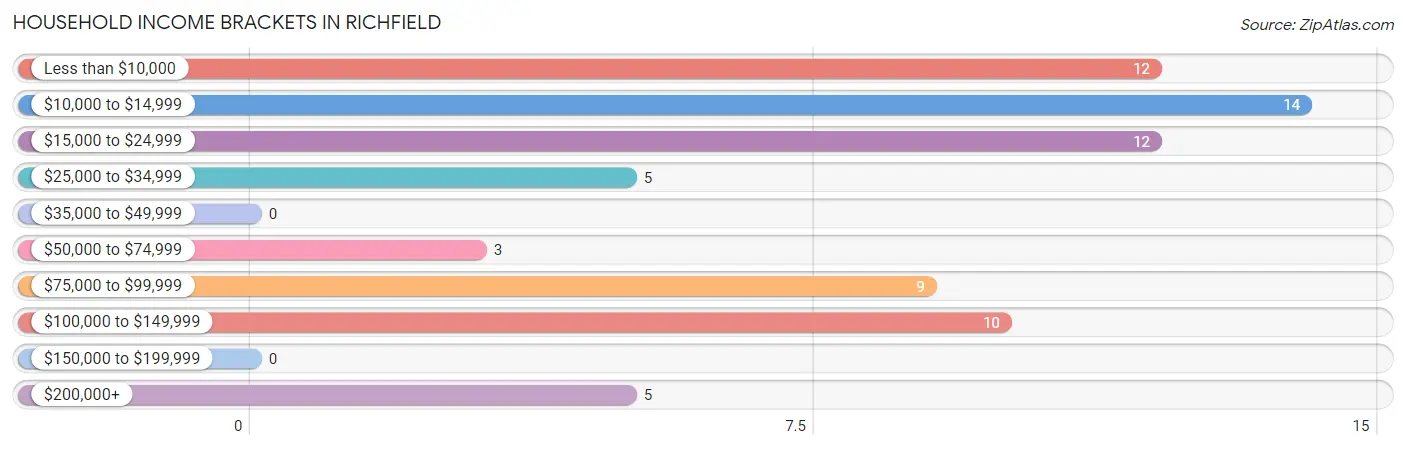
| Income Bracket | # Households | % Households |
| Less than $10,000 | 12 | 17.1% |
| $10,000 to $14,999 | 14 | 20.0% |
| $15,000 to $24,999 | 12 | 17.1% |
| $25,000 to $34,999 | 5 | 7.1% |
| $35,000 to $49,999 | 0 | 0.0% |
| $50,000 to $74,999 | 3 | 4.3% |
| $75,000 to $99,999 | 9 | 12.9% |
| $100,000 to $149,999 | 10 | 14.3% |
| $150,000 to $199,999 | 0 | 0.0% |
| $200,000+ | 5 | 7.1% |
Household Income by Householder Age in Richfield
The median household income in Richfield is $23,125, with the highest median household income of $12,656 found in the 45 to 64 years age bracket for the primary householder. A total of 37 households (52.9%) fall into this category.
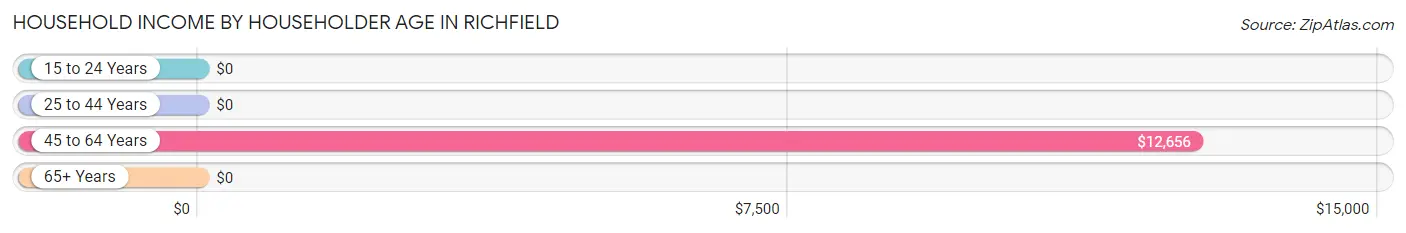
| Income Bracket | # Households | Median Income |
| 15 to 24 Years | 0 (0.0%) | $0 |
| 25 to 44 Years | 5 (7.1%) | $0 |
| 45 to 64 Years | 37 (52.9%) | $12,656 |
| 65+ Years | 28 (40.0%) | $0 |
| Total | 70 (100.0%) | $23,125 |
Poverty in Richfield
Income Below Poverty by Sex and Age in Richfield
With 42.1% poverty level for males and 32.9% for females among the residents of Richfield, under 5 year old males and 5 year old females are the most vulnerable to poverty, with 3 males (100.0%) and 3 females (100.0%) in their respective age groups living below the poverty level.
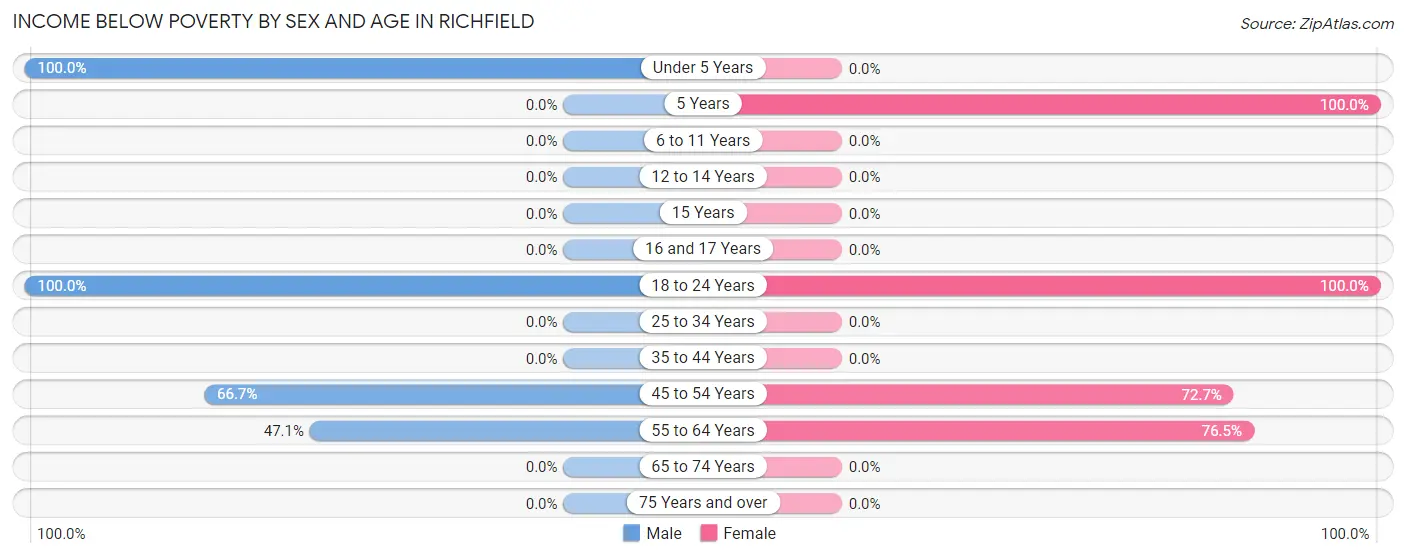
| Age Bracket | Male | Female |
| Under 5 Years | 3 (100.0%) | 0 (0.0%) |
| 5 Years | 0 (0.0%) | 3 (100.0%) |
| 6 to 11 Years | 0 (0.0%) | 0 (0.0%) |
| 12 to 14 Years | 0 (0.0%) | 0 (0.0%) |
| 15 Years | 0 (0.0%) | 0 (0.0%) |
| 16 and 17 Years | 0 (0.0%) | 0 (0.0%) |
| 18 to 24 Years | 9 (100.0%) | 4 (100.0%) |
| 25 to 34 Years | 0 (0.0%) | 0 (0.0%) |
| 35 to 44 Years | 0 (0.0%) | 0 (0.0%) |
| 45 to 54 Years | 4 (66.7%) | 8 (72.7%) |
| 55 to 64 Years | 8 (47.1%) | 13 (76.5%) |
| 65 to 74 Years | 0 (0.0%) | 0 (0.0%) |
| 75 Years and over | 0 (0.0%) | 0 (0.0%) |
| Total | 24 (42.1%) | 28 (32.9%) |
Income Above Poverty by Sex and Age in Richfield
According to the poverty statistics in Richfield, males aged 12 to 14 years and females aged under 5 years are the age groups that are most secure financially, with 100.0% of males and 100.0% of females in these age groups living above the poverty line.
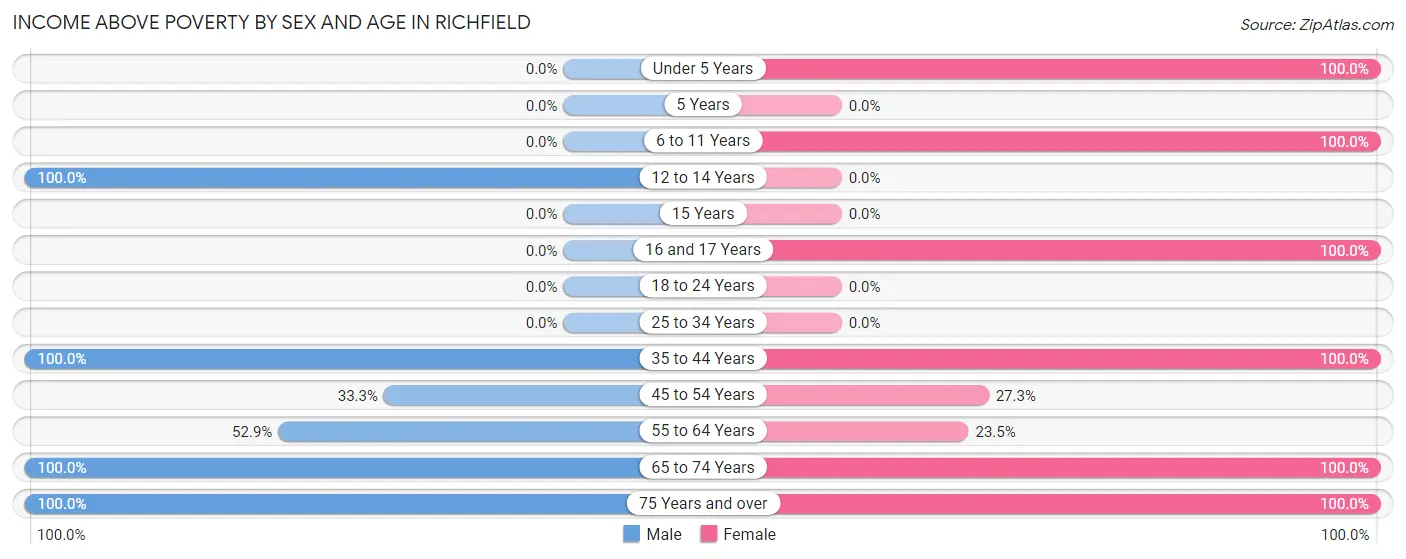
| Age Bracket | Male | Female |
| Under 5 Years | 0 (0.0%) | 2 (100.0%) |
| 5 Years | 0 (0.0%) | 0 (0.0%) |
| 6 to 11 Years | 0 (0.0%) | 8 (100.0%) |
| 12 to 14 Years | 4 (100.0%) | 0 (0.0%) |
| 15 Years | 0 (0.0%) | 0 (0.0%) |
| 16 and 17 Years | 0 (0.0%) | 5 (100.0%) |
| 18 to 24 Years | 0 (0.0%) | 0 (0.0%) |
| 25 to 34 Years | 0 (0.0%) | 0 (0.0%) |
| 35 to 44 Years | 5 (100.0%) | 9 (100.0%) |
| 45 to 54 Years | 2 (33.3%) | 3 (27.3%) |
| 55 to 64 Years | 9 (52.9%) | 4 (23.5%) |
| 65 to 74 Years | 3 (100.0%) | 3 (100.0%) |
| 75 Years and over | 10 (100.0%) | 23 (100.0%) |
| Total | 33 (57.9%) | 57 (67.1%) |
Income Below Poverty Among Married-Couple Families in Richfield
The poverty statistics for married-couple families in Richfield show that 18.5% or 5 of the total 27 families live below the poverty line. Families with no children have the highest poverty rate of 26.3%, comprising of 5 families. On the other hand, families with 1 or 2 children have the lowest poverty rate of 0.0%, which includes 0 families.
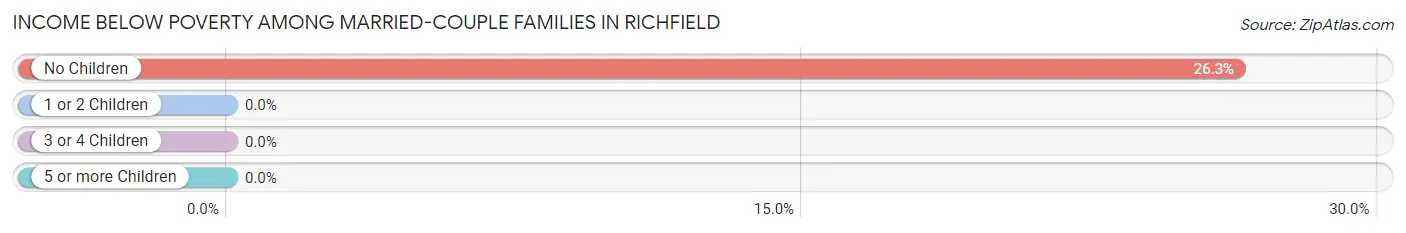
| Children | Above Poverty | Below Poverty |
| No Children | 14 (73.7%) | 5 (26.3%) |
| 1 or 2 Children | 8 (100.0%) | 0 (0.0%) |
| 3 or 4 Children | 0 (0.0%) | 0 (0.0%) |
| 5 or more Children | 0 (0.0%) | 0 (0.0%) |
| Total | 22 (81.5%) | 5 (18.5%) |
Income Below Poverty Among Single-Parent Households in Richfield
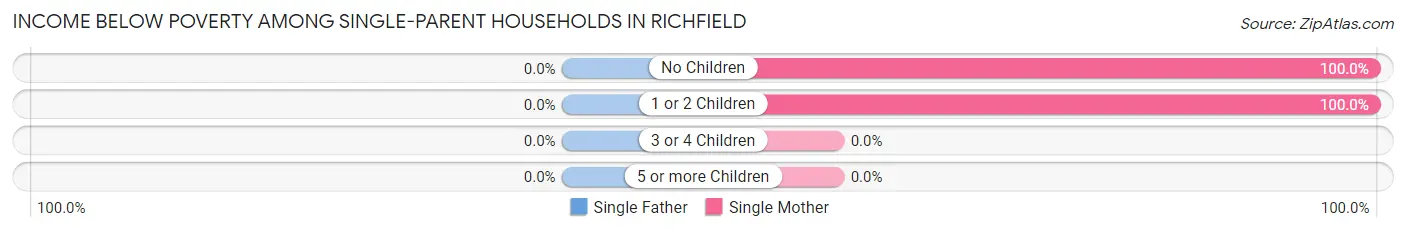
| Children | Single Father | Single Mother |
| No Children | 0 (0.0%) | 3 (100.0%) |
| 1 or 2 Children | 0 (0.0%) | 4 (100.0%) |
| 3 or 4 Children | 0 (0.0%) | 0 (0.0%) |
| 5 or more Children | 0 (0.0%) | 0 (0.0%) |
| Total | 0 (0.0%) | 7 (100.0%) |
Income Below Poverty Among Married-Couple vs Single-Parent Households in Richfield
The poverty data for Richfield shows that 5 of the married-couple family households (18.5%) and 7 of the single-parent households (100.0%) are living below the poverty level. Within the married-couple family households, those with no children have the highest poverty rate, with 5 households (26.3%) falling below the poverty line. Among the single-parent households, those with no children have the highest poverty rate, with 3 household (100.0%) living below poverty.
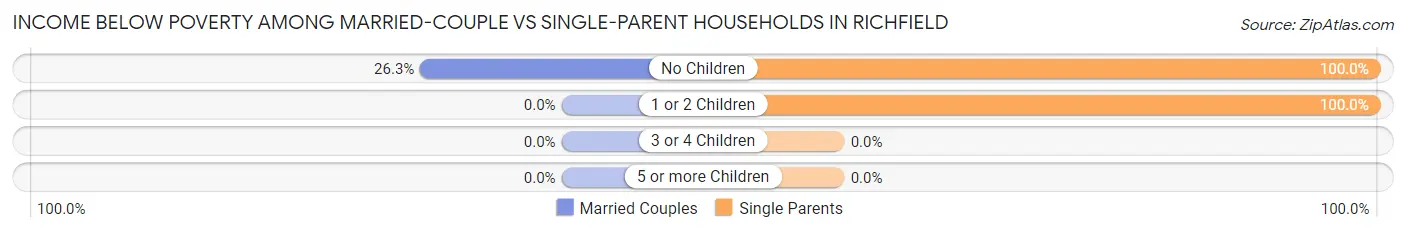
| Children | Married-Couple Families | Single-Parent Households |
| No Children | 5 (26.3%) | 3 (100.0%) |
| 1 or 2 Children | 0 (0.0%) | 4 (100.0%) |
| 3 or 4 Children | 0 (0.0%) | 0 (0.0%) |
| 5 or more Children | 0 (0.0%) | 0 (0.0%) |
| Total | 5 (18.5%) | 7 (100.0%) |
Race in Richfield
The most populous races in Richfield are White / Caucasian (128 | 90.1%), Hispanic or Latino (18 | 12.7%), and Some other Race (8 | 5.6%).
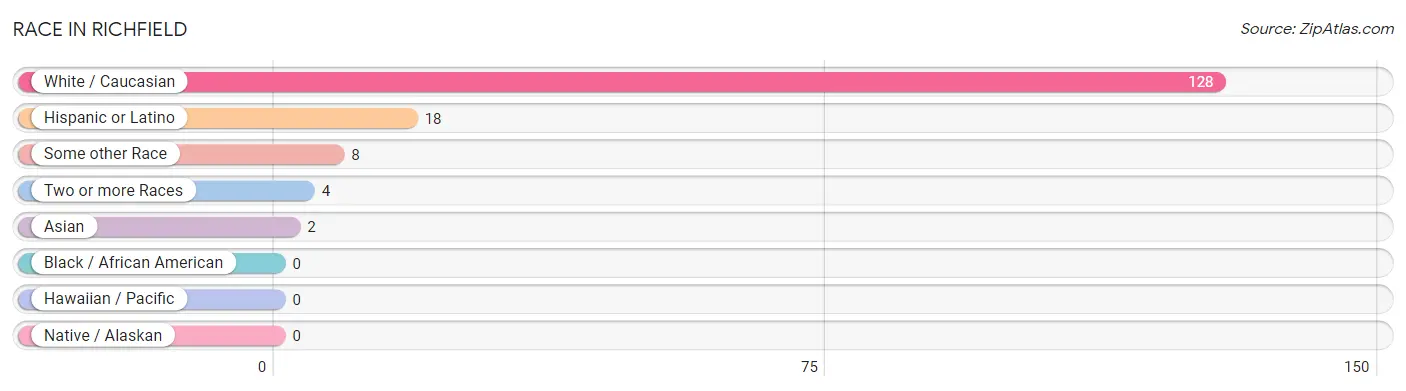
| Race | # Population | % Population |
| Asian | 2 | 1.4% |
| Black / African American | 0 | 0.0% |
| Hawaiian / Pacific | 0 | 0.0% |
| Hispanic or Latino | 18 | 12.7% |
| Native / Alaskan | 0 | 0.0% |
| White / Caucasian | 128 | 90.1% |
| Two or more Races | 4 | 2.8% |
| Some other Race | 8 | 5.6% |
| Total | 142 | 100.0% |
Ancestry in Richfield
The most populous ancestries reported in Richfield are English (35 | 24.6%), Scottish (22 | 15.5%), European (21 | 14.8%), German (20 | 14.1%), and Italian (15 | 10.6%), together accounting for 79.6% of all Richfield residents.
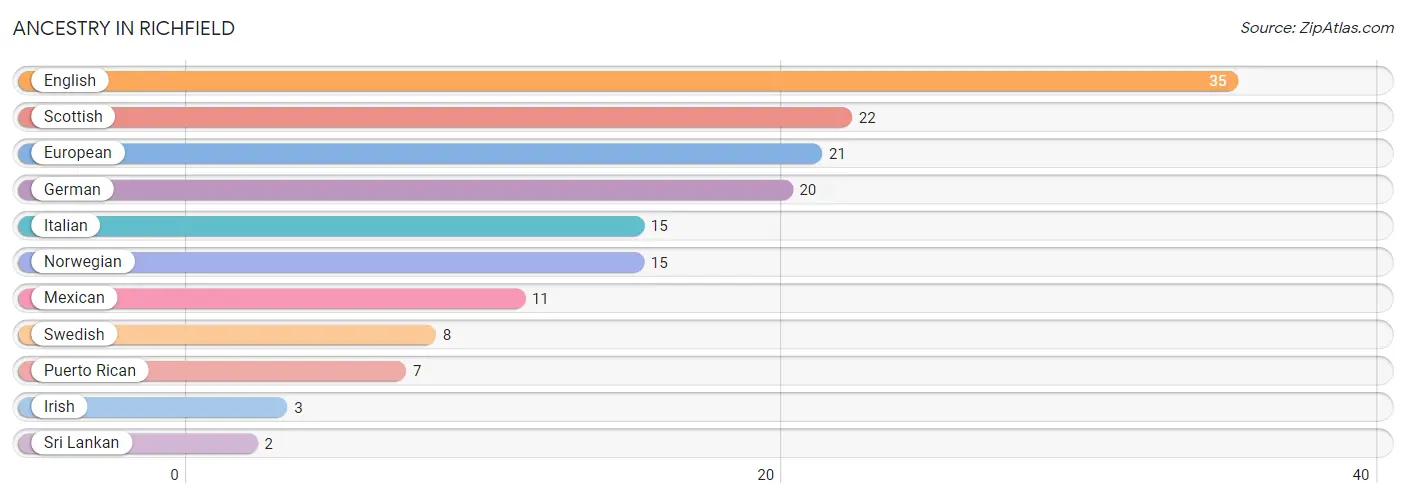
| Ancestry | # Population | % Population |
| English | 35 | 24.6% |
| European | 21 | 14.8% |
| German | 20 | 14.1% |
| Irish | 3 | 2.1% |
| Italian | 15 | 10.6% |
| Mexican | 11 | 7.7% |
| Norwegian | 15 | 10.6% |
| Puerto Rican | 7 | 4.9% |
| Scottish | 22 | 15.5% |
| Sri Lankan | 2 | 1.4% |
| Swedish | 8 | 5.6% | View All 11 Rows |
Immigrants in Richfield
The most numerous immigrant groups reported in Richfield came from Central America (4 | 2.8%), Latin America (4 | 2.8%), Mexico (4 | 2.8%), Eastern Europe (3 | 2.1%), and Europe (3 | 2.1%), together accounting for 12.7% of all Richfield residents.
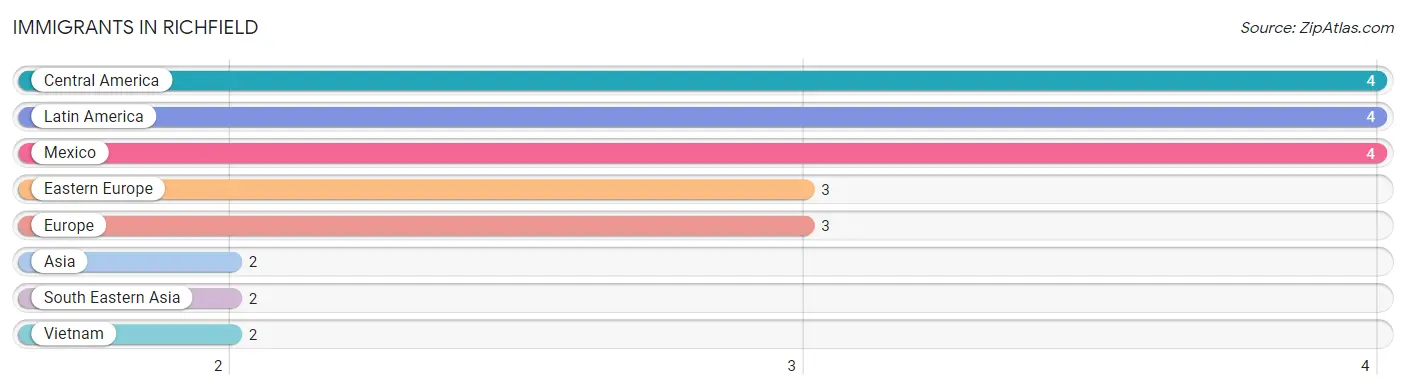
| Immigration Origin | # Population | % Population |
| Asia | 2 | 1.4% |
| Central America | 4 | 2.8% |
| Eastern Europe | 3 | 2.1% |
| Europe | 3 | 2.1% |
| Latin America | 4 | 2.8% |
| Mexico | 4 | 2.8% |
| South Eastern Asia | 2 | 1.4% |
| Vietnam | 2 | 1.4% | View All 8 Rows |
Sex and Age in Richfield
Sex and Age in Richfield
The most populous age groups in Richfield are 60 to 64 Years (17 | 29.8%) for men and 60 to 64 Years (13 | 15.3%) for women.
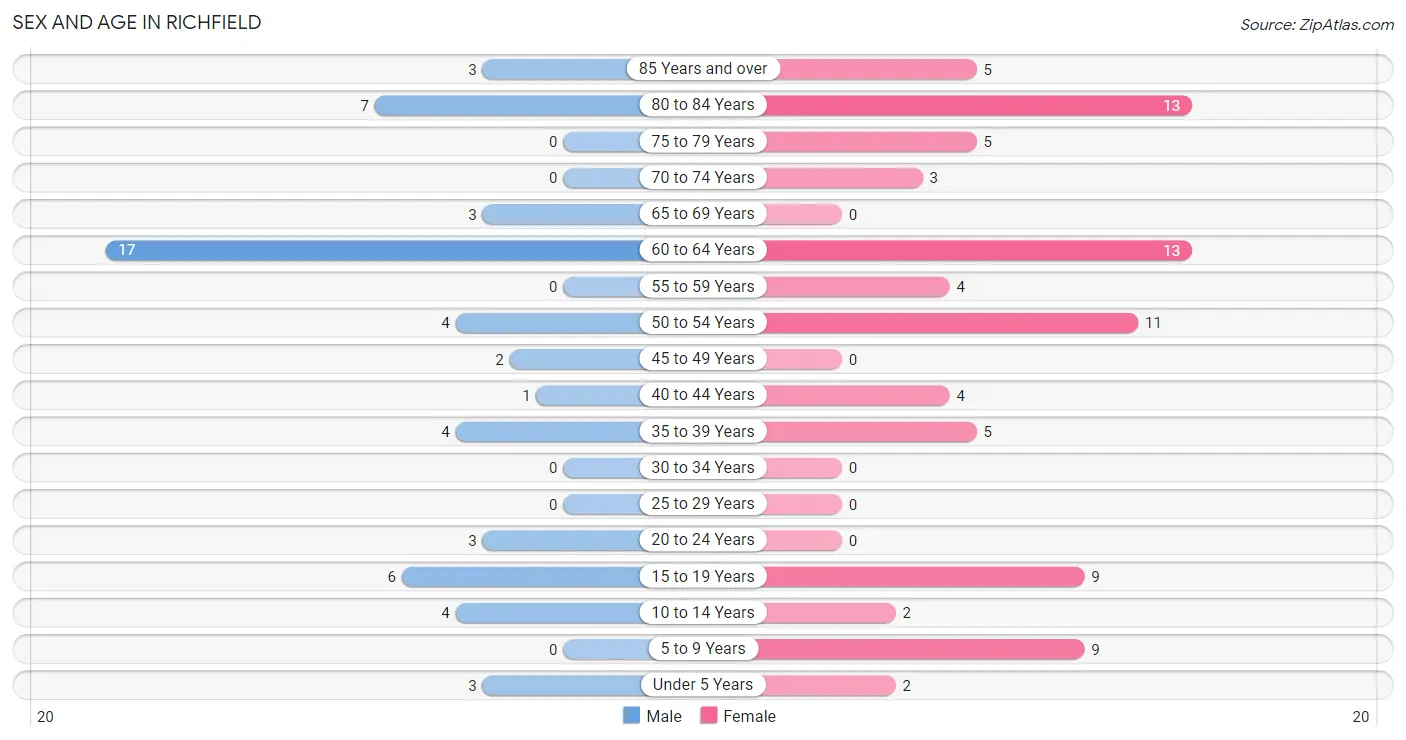
| Age Bracket | Male | Female |
| Under 5 Years | 3 (5.3%) | 2 (2.4%) |
| 5 to 9 Years | 0 (0.0%) | 9 (10.6%) |
| 10 to 14 Years | 4 (7.0%) | 2 (2.4%) |
| 15 to 19 Years | 6 (10.5%) | 9 (10.6%) |
| 20 to 24 Years | 3 (5.3%) | 0 (0.0%) |
| 25 to 29 Years | 0 (0.0%) | 0 (0.0%) |
| 30 to 34 Years | 0 (0.0%) | 0 (0.0%) |
| 35 to 39 Years | 4 (7.0%) | 5 (5.9%) |
| 40 to 44 Years | 1 (1.8%) | 4 (4.7%) |
| 45 to 49 Years | 2 (3.5%) | 0 (0.0%) |
| 50 to 54 Years | 4 (7.0%) | 11 (12.9%) |
| 55 to 59 Years | 0 (0.0%) | 4 (4.7%) |
| 60 to 64 Years | 17 (29.8%) | 13 (15.3%) |
| 65 to 69 Years | 3 (5.3%) | 0 (0.0%) |
| 70 to 74 Years | 0 (0.0%) | 3 (3.5%) |
| 75 to 79 Years | 0 (0.0%) | 5 (5.9%) |
| 80 to 84 Years | 7 (12.3%) | 13 (15.3%) |
| 85 Years and over | 3 (5.3%) | 5 (5.9%) |
| Total | 57 (100.0%) | 85 (100.0%) |
Families and Households in Richfield
Median Family Size in Richfield
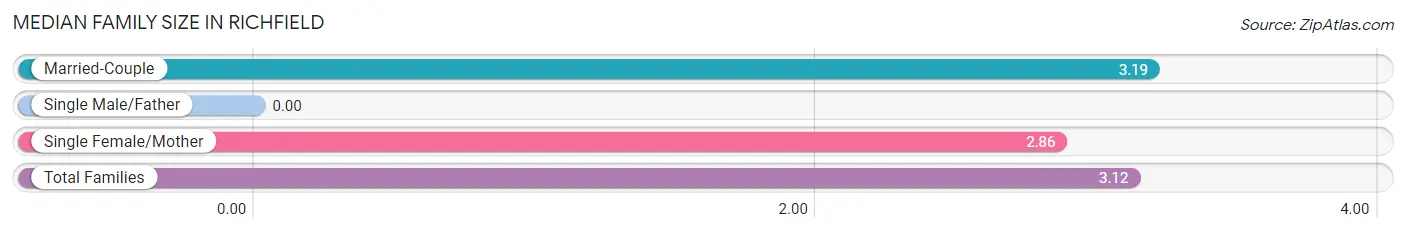
| Family Type | # Families | Family Size |
| Married-Couple | 27 (79.4%) | 3.19 |
| Single Male/Father | 0 (0.0%) | - |
| Single Female/Mother | 7 (20.6%) | 2.86 |
| Total Families | 34 (100.0%) | 3.12 |
Median Household Size in Richfield
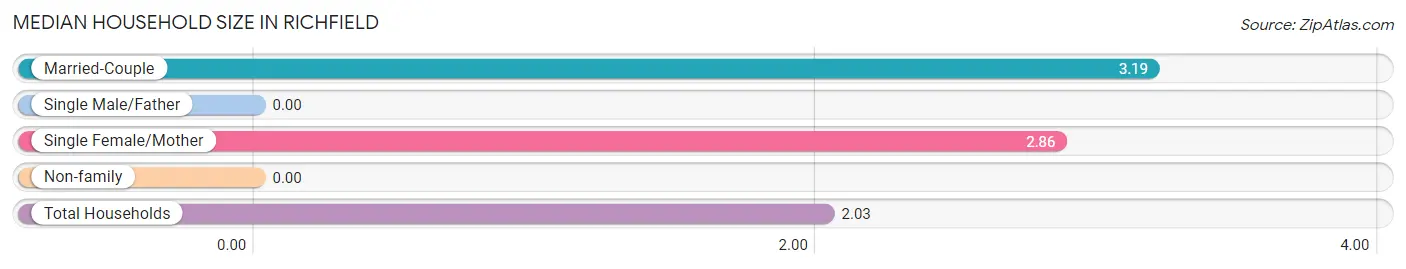
| Household Type | # Households | Household Size |
| Married-Couple | 27 (38.6%) | 3.19 |
| Single Male/Father | 0 (0.0%) | - |
| Single Female/Mother | 7 (10.0%) | 2.86 |
| Non-family | 36 (51.4%) | - |
| Total Households | 70 (100.0%) | 2.03 |
Household Size by Marriage Status in Richfield
Out of a total of 70 households in Richfield, 34 (48.6%) are family households, while 36 (51.4%) are nonfamily households. The most numerous type of family households are 2-person households, comprising 12, and the most common type of nonfamily households are 1-person households, comprising 36.
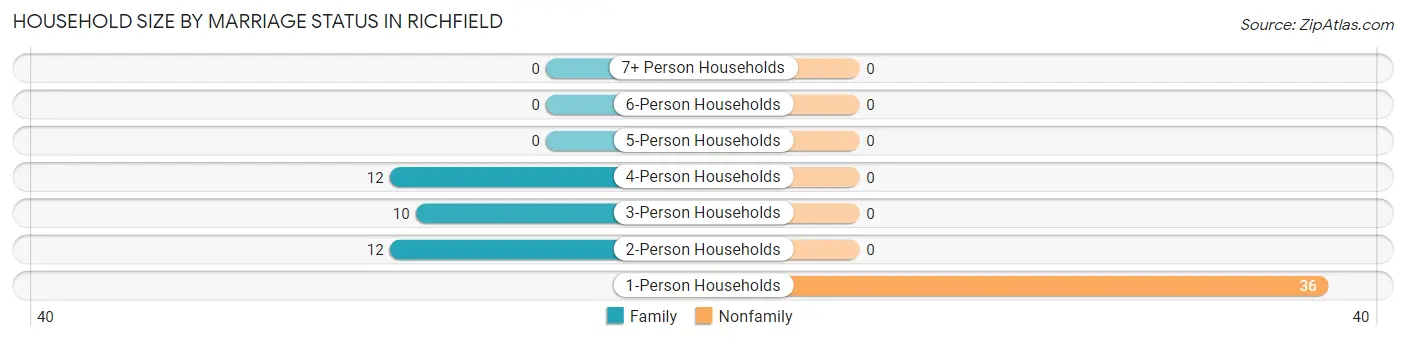
| Household Size | Family Households | Nonfamily Households |
| 1-Person Households | - | 36 (51.4%) |
| 2-Person Households | 12 (17.1%) | 0 (0.0%) |
| 3-Person Households | 10 (14.3%) | 0 (0.0%) |
| 4-Person Households | 12 (17.1%) | 0 (0.0%) |
| 5-Person Households | 0 (0.0%) | 0 (0.0%) |
| 6-Person Households | 0 (0.0%) | 0 (0.0%) |
| 7+ Person Households | 0 (0.0%) | 0 (0.0%) |
| Total | 34 (48.6%) | 36 (51.4%) |
Female Fertility in Richfield
Fertility by Age in Richfield
| Age Bracket | Women with Births | Births / 1,000 Women |
| 15 to 19 years | 0 (0.0%) | 0.0 |
| 20 to 34 years | 0 (0.0%) | 0.0 |
| 35 to 50 years | 0 (0.0%) | 0.0 |
| Total | 0 (0.0%) | 0.0 |
Fertility by Age by Marriage Status in Richfield
| Age Bracket | Married | Unmarried |
| 15 to 19 years | 0 (0.0%) | 0 (0.0%) |
| 20 to 34 years | 0 (0.0%) | 0 (0.0%) |
| 35 to 50 years | 0 (0.0%) | 0 (0.0%) |
| Total | 0 (0.0%) | 0 (0.0%) |
Fertility by Education in Richfield
| Educational Attainment | Women with Births | Births / 1,000 Women |
| Less than High School | 0 (0.0%) | 0.0 |
| High School Diploma | 0 (0.0%) | 0.0 |
| College or Associate's Degree | 0 (0.0%) | 0.0 |
| Bachelor's Degree | 0 (0.0%) | 0.0 |
| Graduate Degree | 0 (0.0%) | 0.0 |
| Total | 0 (0.0%) | 0.0 |
Fertility by Education by Marriage Status in Richfield
| Educational Attainment | Married | Unmarried |
| Less than High School | 0 (0.0%) | 0 (0.0%) |
| High School Diploma | 0 (0.0%) | 0 (0.0%) |
| College or Associate's Degree | 0 (0.0%) | 0 (0.0%) |
| Bachelor's Degree | 0 (0.0%) | 0 (0.0%) |
| Graduate Degree | 0 (0.0%) | 0 (0.0%) |
| Total | 0 (0.0%) | 0 (0.0%) |
Employment Characteristics in Richfield
Employment by Class of Employer in Richfield
Among the 52 employed individuals in Richfield, self-employed (not incorporated) (18 | 34.6%), private company employees (13 | 25.0%), and local government employees (10 | 19.2%) make up the most common classes of employment.
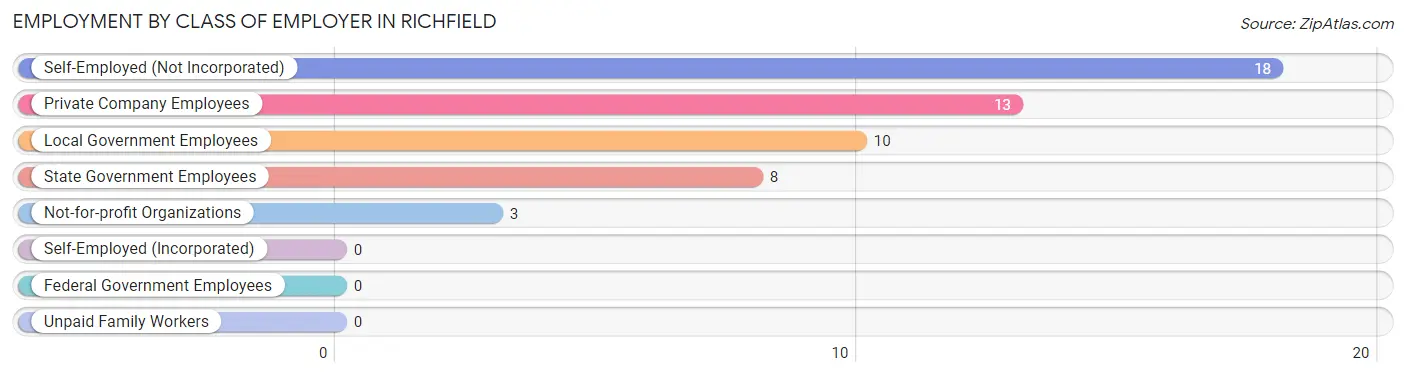
| Employer Class | # Employees | % Employees |
| Private Company Employees | 13 | 25.0% |
| Self-Employed (Incorporated) | 0 | 0.0% |
| Self-Employed (Not Incorporated) | 18 | 34.6% |
| Not-for-profit Organizations | 3 | 5.8% |
| Local Government Employees | 10 | 19.2% |
| State Government Employees | 8 | 15.4% |
| Federal Government Employees | 0 | 0.0% |
| Unpaid Family Workers | 0 | 0.0% |
| Total | 52 | 100.0% |
Employment Status by Age in Richfield
According to the labor force statistics for Richfield, out of the total population over 16 years of age (122), 50.0% or 61 individuals are in the labor force, with 14.8% or 9 of them unemployed. The age group with the highest labor force participation rate is 20 to 24 years, with 100.0% or 3 individuals in the labor force. Within the labor force, the 16 to 19 years age range has the highest percentage of unemployed individuals, with 100.0% or 4 of them being unemployed.
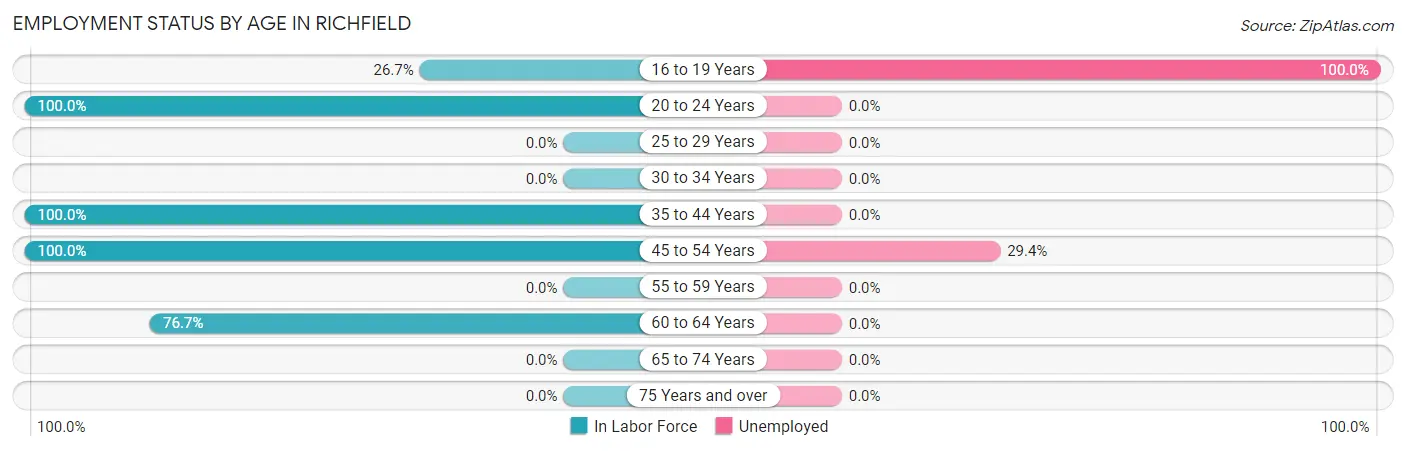
| Age Bracket | In Labor Force | Unemployed |
| 16 to 19 Years | 4 (26.7%) | 4 (100.0%) |
| 20 to 24 Years | 3 (100.0%) | 0 (0.0%) |
| 25 to 29 Years | 0 (0.0%) | 0 (0.0%) |
| 30 to 34 Years | 0 (0.0%) | 0 (0.0%) |
| 35 to 44 Years | 14 (100.0%) | 0 (0.0%) |
| 45 to 54 Years | 17 (100.0%) | 5 (29.4%) |
| 55 to 59 Years | 0 (0.0%) | 0 (0.0%) |
| 60 to 64 Years | 23 (76.7%) | 0 (0.0%) |
| 65 to 74 Years | 0 (0.0%) | 0 (0.0%) |
| 75 Years and over | 0 (0.0%) | 0 (0.0%) |
| Total | 61 (50.0%) | 9 (14.8%) |
Employment Status by Educational Attainment in Richfield
According to labor force statistics for Richfield, 83.1% of individuals (54) out of the total population between 25 and 64 years of age (65) are in the labor force, with 9.3% or 5 of them being unemployed. The group with the highest labor force participation rate are those with the educational attainment of high school diploma, with 100.0% or 28 individuals in the labor force. Within the labor force, individuals with college / associate degree education have the highest percentage of unemployment, with 41.7% or 5 of them being unemployed.
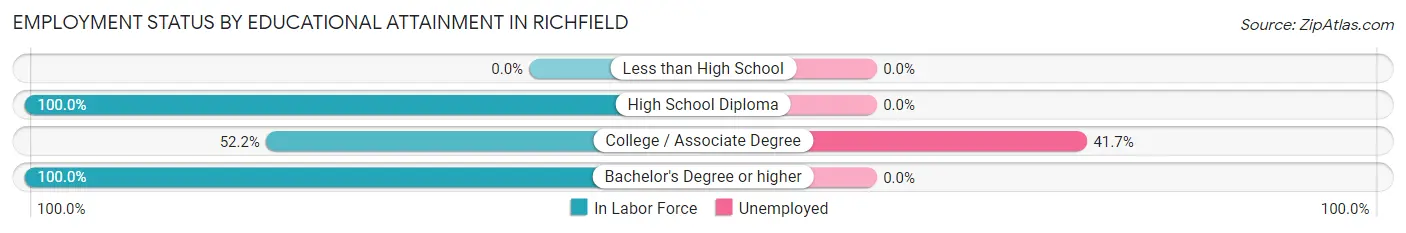
| Educational Attainment | In Labor Force | Unemployed |
| Less than High School | 0 (0.0%) | 0 (0.0%) |
| High School Diploma | 28 (100.0%) | 0 (0.0%) |
| College / Associate Degree | 12 (52.2%) | 10 (41.7%) |
| Bachelor's Degree or higher | 14 (100.0%) | 0 (0.0%) |
| Total | 54 (83.1%) | 6 (9.3%) |
Employment Occupations by Sex in Richfield
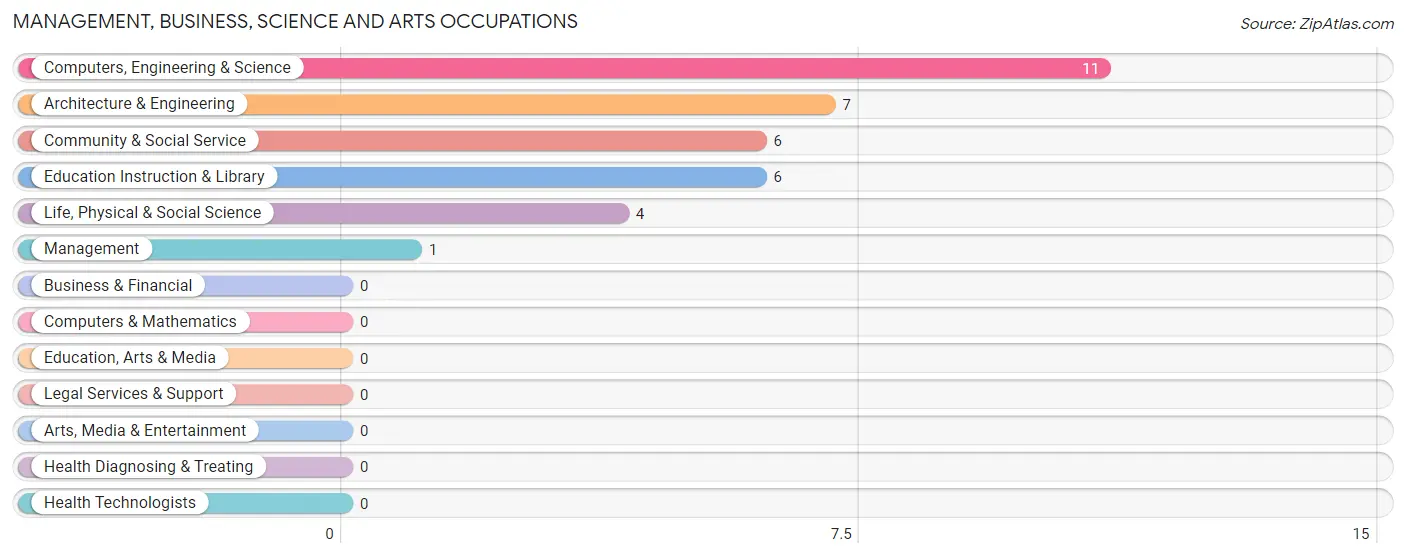
Management, Business, Science and Arts Occupations
The most common Management, Business, Science and Arts occupations in Richfield are Computers, Engineering & Science (11 | 21.1%), Architecture & Engineering (7 | 13.5%), Community & Social Service (6 | 11.5%), Education Instruction & Library (6 | 11.5%), and Life, Physical & Social Science (4 | 7.7%).
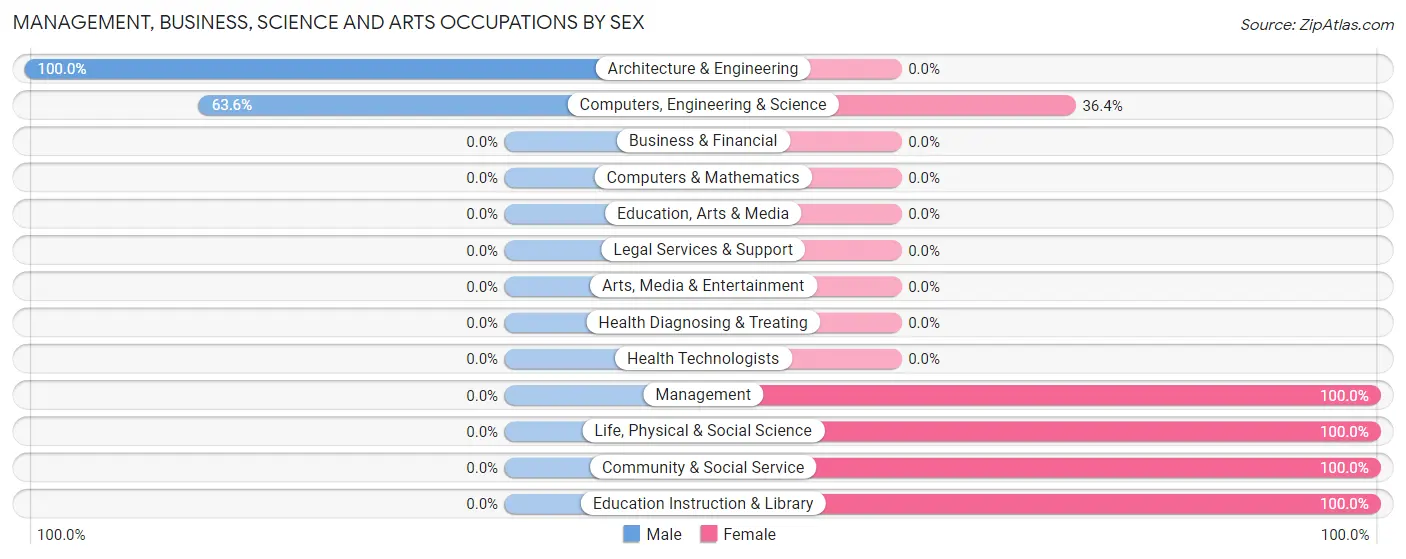
Management, Business, Science and Arts Occupations by Sex
Within the Management, Business, Science and Arts occupations in Richfield, the most male-oriented occupations are Architecture & Engineering (100.0%), and Computers, Engineering & Science (63.6%), while the most female-oriented occupations are Management (100.0%), Life, Physical & Social Science (100.0%), and Community & Social Service (100.0%).
| Occupation | Male | Female |
| Management | 0 (0.0%) | 1 (100.0%) |
| Business & Financial | 0 (0.0%) | 0 (0.0%) |
| Computers, Engineering & Science | 7 (63.6%) | 4 (36.4%) |
| Computers & Mathematics | 0 (0.0%) | 0 (0.0%) |
| Architecture & Engineering | 7 (100.0%) | 0 (0.0%) |
| Life, Physical & Social Science | 0 (0.0%) | 4 (100.0%) |
| Community & Social Service | 0 (0.0%) | 6 (100.0%) |
| Education, Arts & Media | 0 (0.0%) | 0 (0.0%) |
| Legal Services & Support | 0 (0.0%) | 0 (0.0%) |
| Education Instruction & Library | 0 (0.0%) | 6 (100.0%) |
| Arts, Media & Entertainment | 0 (0.0%) | 0 (0.0%) |
| Health Diagnosing & Treating | 0 (0.0%) | 0 (0.0%) |
| Health Technologists | 0 (0.0%) | 0 (0.0%) |
| Total (Category) | 7 (38.9%) | 11 (61.1%) |
| Total (Overall) | 31 (59.6%) | 21 (40.4%) |
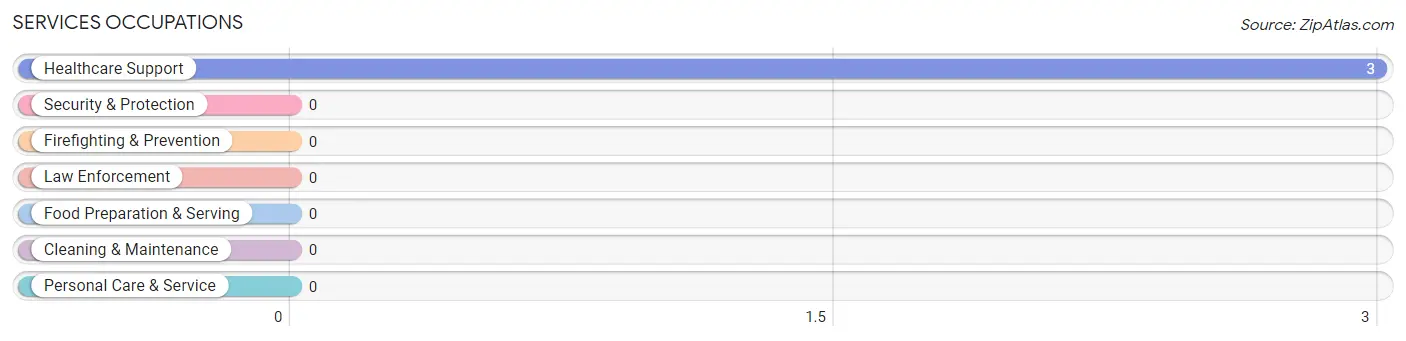
Services Occupations
The most common Services occupations in Richfield are , and Healthcare Support (3 | 5.8%).
Services Occupations by Sex
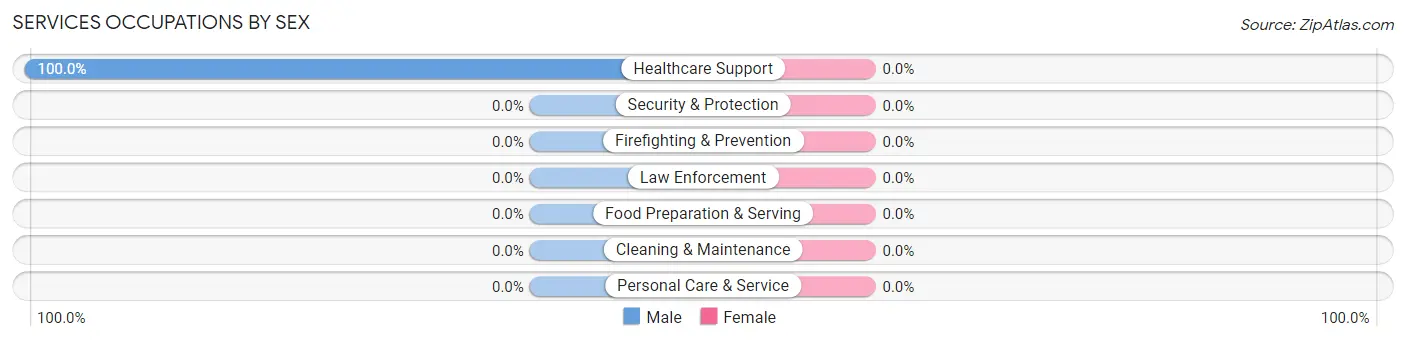
| Occupation | Male | Female |
| Healthcare Support | 3 (100.0%) | 0 (0.0%) |
| Security & Protection | 0 (0.0%) | 0 (0.0%) |
| Firefighting & Prevention | 0 (0.0%) | 0 (0.0%) |
| Law Enforcement | 0 (0.0%) | 0 (0.0%) |
| Food Preparation & Serving | 0 (0.0%) | 0 (0.0%) |
| Cleaning & Maintenance | 0 (0.0%) | 0 (0.0%) |
| Personal Care & Service | 0 (0.0%) | 0 (0.0%) |
| Total (Category) | 3 (100.0%) | 0 (0.0%) |
| Total (Overall) | 31 (59.6%) | 21 (40.4%) |
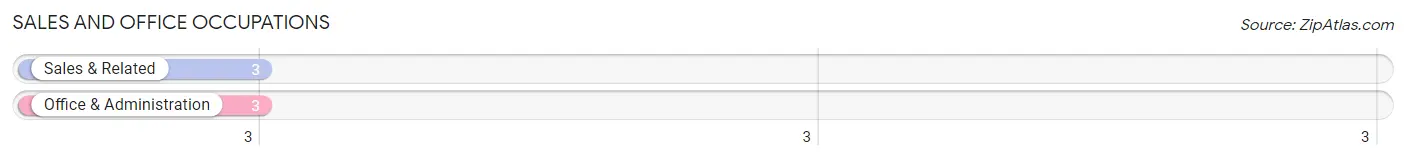
Sales and Office Occupations
The most common Sales and Office occupations in Richfield are Sales & Related (3 | 5.8%), and Office & Administration (3 | 5.8%).
Sales and Office Occupations by Sex
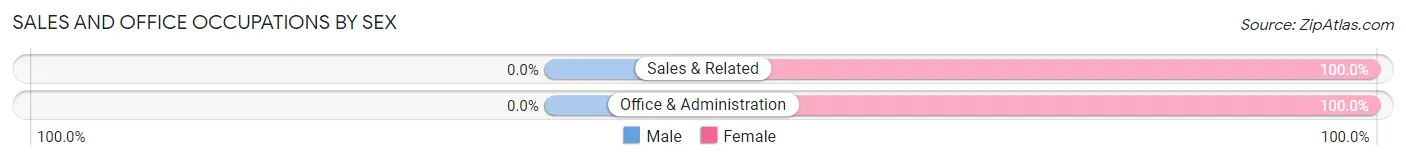
| Occupation | Male | Female |
| Sales & Related | 0 (0.0%) | 3 (100.0%) |
| Office & Administration | 0 (0.0%) | 3 (100.0%) |
| Total (Category) | 0 (0.0%) | 6 (100.0%) |
| Total (Overall) | 31 (59.6%) | 21 (40.4%) |
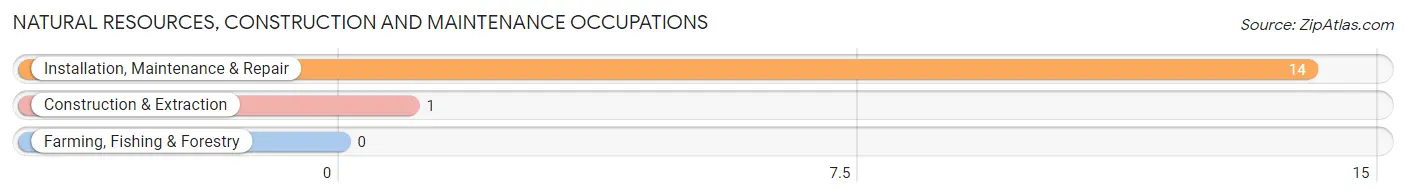
Natural Resources, Construction and Maintenance Occupations
The most common Natural Resources, Construction and Maintenance occupations in Richfield are Installation, Maintenance & Repair (14 | 26.9%), and Construction & Extraction (1 | 1.9%).
Natural Resources, Construction and Maintenance Occupations by Sex
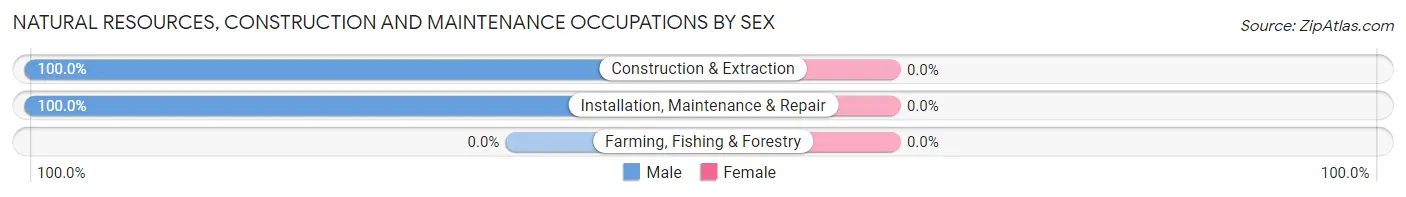
| Occupation | Male | Female |
| Farming, Fishing & Forestry | 0 (0.0%) | 0 (0.0%) |
| Construction & Extraction | 1 (100.0%) | 0 (0.0%) |
| Installation, Maintenance & Repair | 14 (100.0%) | 0 (0.0%) |
| Total (Category) | 15 (100.0%) | 0 (0.0%) |
| Total (Overall) | 31 (59.6%) | 21 (40.4%) |
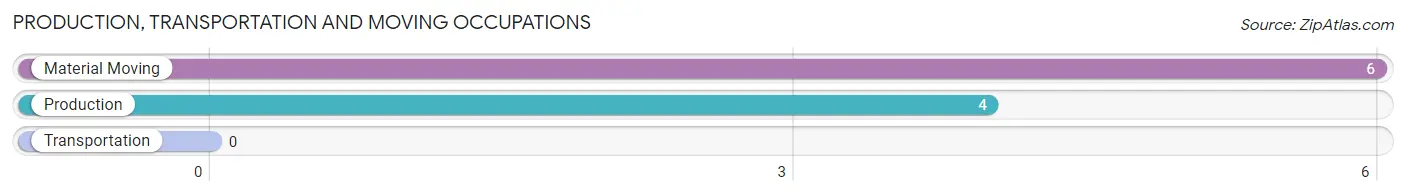
Production, Transportation and Moving Occupations
The most common Production, Transportation and Moving occupations in Richfield are Material Moving (6 | 11.5%), and Production (4 | 7.7%).
Production, Transportation and Moving Occupations by Sex
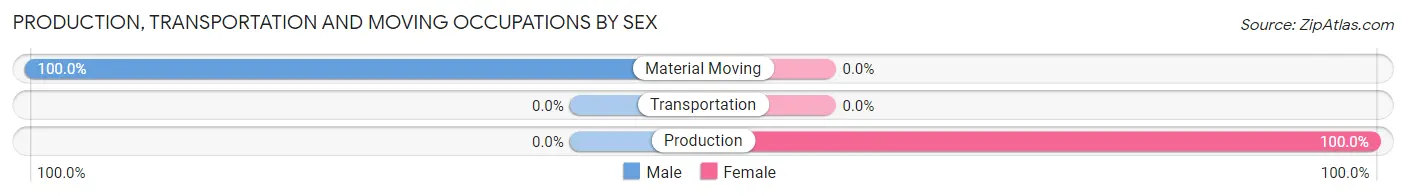
| Occupation | Male | Female |
| Production | 0 (0.0%) | 4 (100.0%) |
| Transportation | 0 (0.0%) | 0 (0.0%) |
| Material Moving | 6 (100.0%) | 0 (0.0%) |
| Total (Category) | 6 (60.0%) | 4 (40.0%) |
| Total (Overall) | 31 (59.6%) | 21 (40.4%) |
Employment Industries by Sex in Richfield
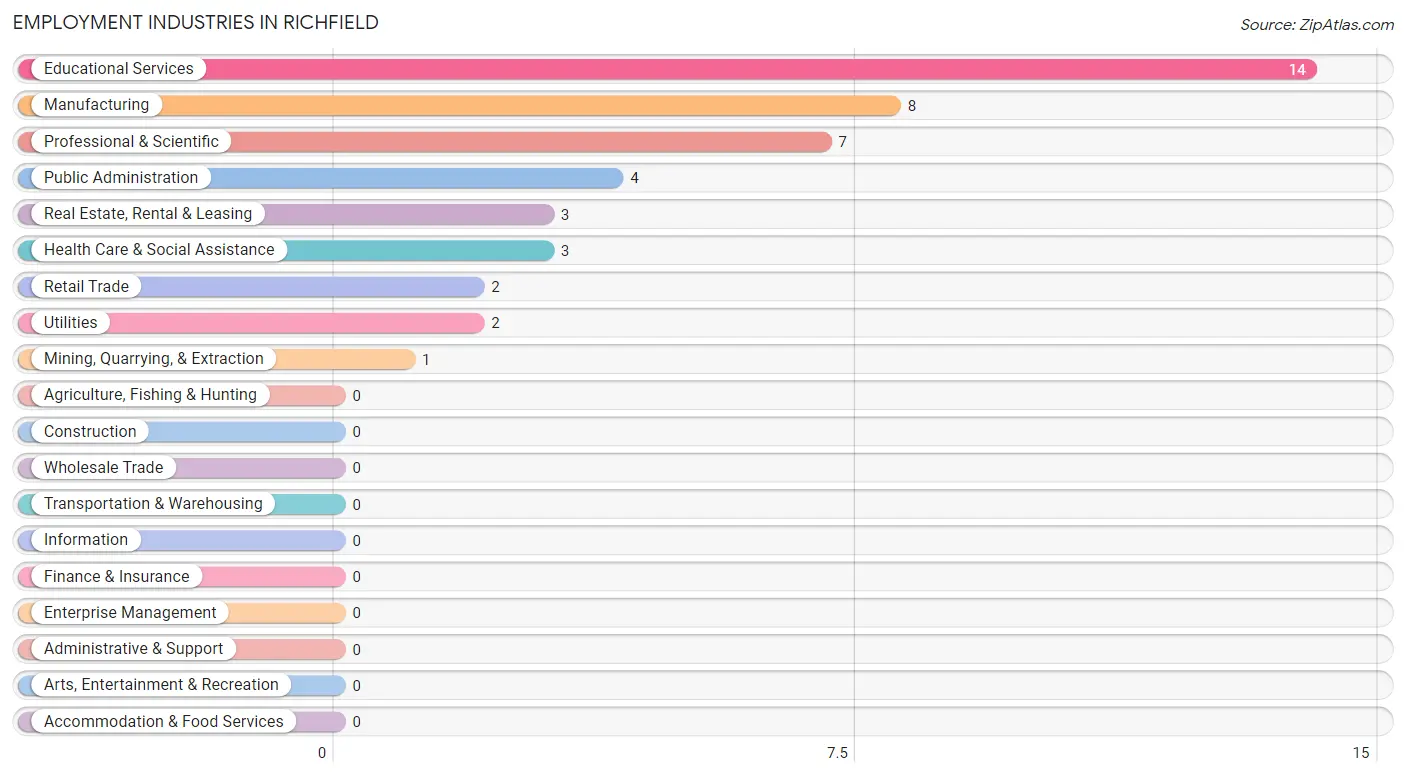
Employment Industries in Richfield
The major employment industries in Richfield include Educational Services (14 | 26.9%), Manufacturing (8 | 15.4%), Professional & Scientific (7 | 13.5%), Public Administration (4 | 7.7%), and Real Estate, Rental & Leasing (3 | 5.8%).
Employment Industries by Sex in Richfield
The Richfield industries that see more men than women are Mining, Quarrying, & Extraction (100.0%), Retail Trade (100.0%), and Utilities (100.0%), whereas the industries that tend to have a higher number of women are Real Estate, Rental & Leasing (100.0%), Educational Services (100.0%), and Manufacturing (50.0%).
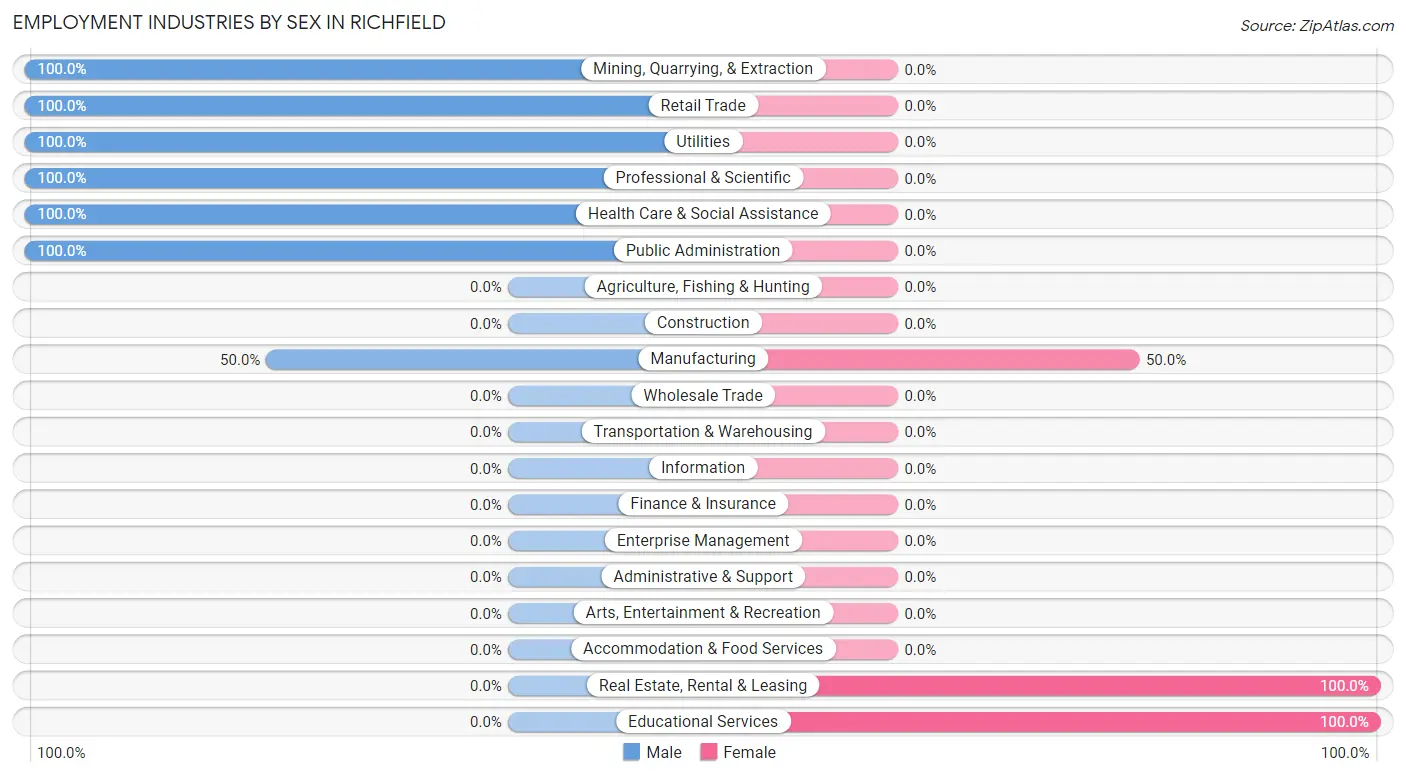
| Industry | Male | Female |
| Agriculture, Fishing & Hunting | 0 (0.0%) | 0 (0.0%) |
| Mining, Quarrying, & Extraction | 1 (100.0%) | 0 (0.0%) |
| Construction | 0 (0.0%) | 0 (0.0%) |
| Manufacturing | 4 (50.0%) | 4 (50.0%) |
| Wholesale Trade | 0 (0.0%) | 0 (0.0%) |
| Retail Trade | 2 (100.0%) | 0 (0.0%) |
| Transportation & Warehousing | 0 (0.0%) | 0 (0.0%) |
| Utilities | 2 (100.0%) | 0 (0.0%) |
| Information | 0 (0.0%) | 0 (0.0%) |
| Finance & Insurance | 0 (0.0%) | 0 (0.0%) |
| Real Estate, Rental & Leasing | 0 (0.0%) | 3 (100.0%) |
| Professional & Scientific | 7 (100.0%) | 0 (0.0%) |
| Enterprise Management | 0 (0.0%) | 0 (0.0%) |
| Administrative & Support | 0 (0.0%) | 0 (0.0%) |
| Educational Services | 0 (0.0%) | 14 (100.0%) |
| Health Care & Social Assistance | 3 (100.0%) | 0 (0.0%) |
| Arts, Entertainment & Recreation | 0 (0.0%) | 0 (0.0%) |
| Accommodation & Food Services | 0 (0.0%) | 0 (0.0%) |
| Public Administration | 4 (100.0%) | 0 (0.0%) |
| Total | 31 (59.6%) | 21 (40.4%) |
Education in Richfield
School Enrollment in Richfield
The most common levels of schooling among the 29 students in Richfield are elementary school (6 | 20.7%), middle school (6 | 20.7%), and college / undergraduate (6 | 20.7%).
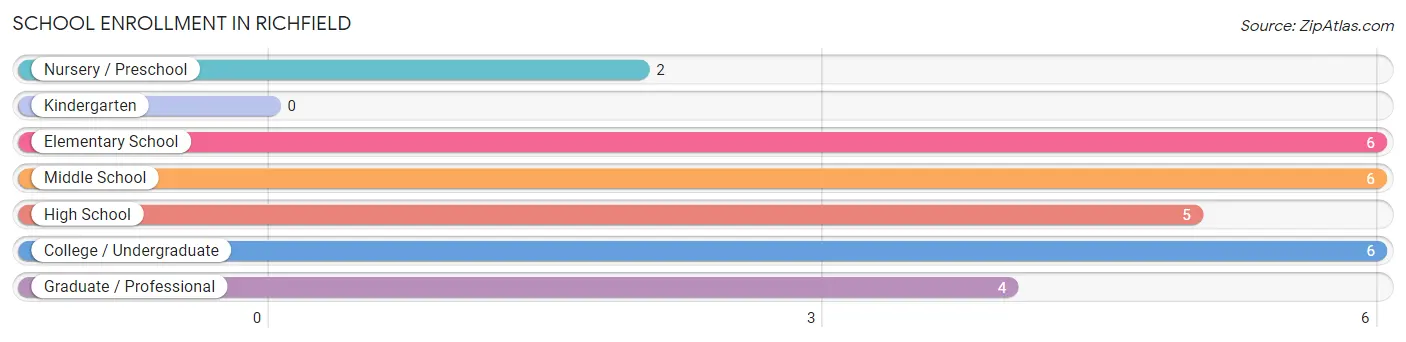
| School Level | # Students | % Students |
| Nursery / Preschool | 2 | 6.9% |
| Kindergarten | 0 | 0.0% |
| Elementary School | 6 | 20.7% |
| Middle School | 6 | 20.7% |
| High School | 5 | 17.2% |
| College / Undergraduate | 6 | 20.7% |
| Graduate / Professional | 4 | 13.8% |
| Total | 29 | 100.0% |
School Enrollment by Age by Funding Source in Richfield
Out of a total of 29 students who are enrolled in schools in Richfield, 2 (6.9%) attend a private institution, while the remaining 27 (93.1%) are enrolled in public schools. The age group of 3 to 4 year olds has the highest likelihood of being enrolled in private schools, with 2 (100.0% in the age bracket) enrolled. Conversely, the age group of 5 to 9 year old has the lowest likelihood of being enrolled in a private school, with 6 (100.0% in the age bracket) attending a public institution.
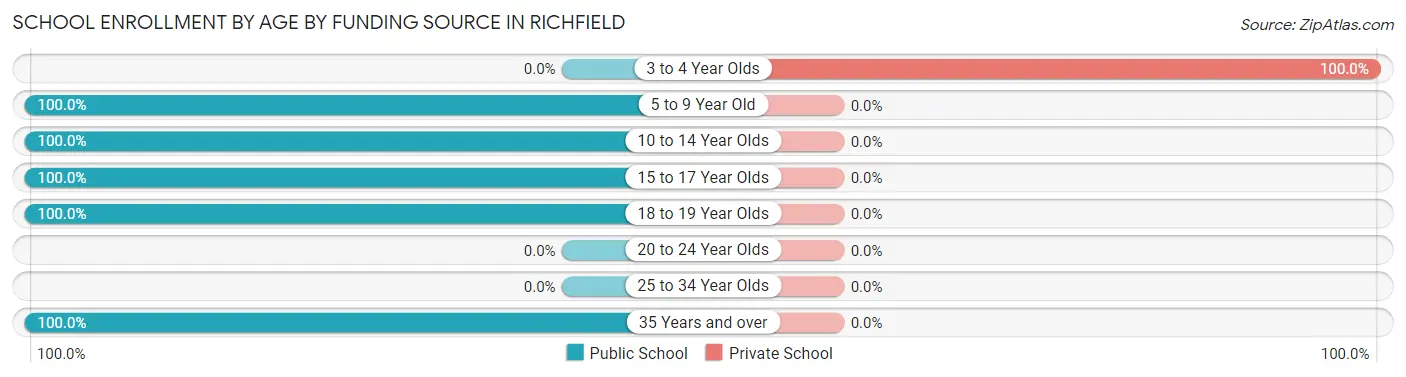
| Age Bracket | Public School | Private School |
| 3 to 4 Year Olds | 0 (0.0%) | 2 (100.0%) |
| 5 to 9 Year Old | 6 (100.0%) | 0 (0.0%) |
| 10 to 14 Year Olds | 6 (100.0%) | 0 (0.0%) |
| 15 to 17 Year Olds | 5 (100.0%) | 0 (0.0%) |
| 18 to 19 Year Olds | 6 (100.0%) | 0 (0.0%) |
| 20 to 24 Year Olds | 0 (0.0%) | 0 (0.0%) |
| 25 to 34 Year Olds | 0 (0.0%) | 0 (0.0%) |
| 35 Years and over | 4 (100.0%) | 0 (0.0%) |
| Total | 27 (93.1%) | 2 (6.9%) |
Educational Attainment by Field of Study in Richfield
Bio, nature & agricultural (6 | 22.2%), arts & humanities (6 | 22.2%), psychology (5 | 18.5%), social sciences (5 | 18.5%), and education (5 | 18.5%) are the most common fields of study among 27 individuals in Richfield who have obtained a bachelor's degree or higher.
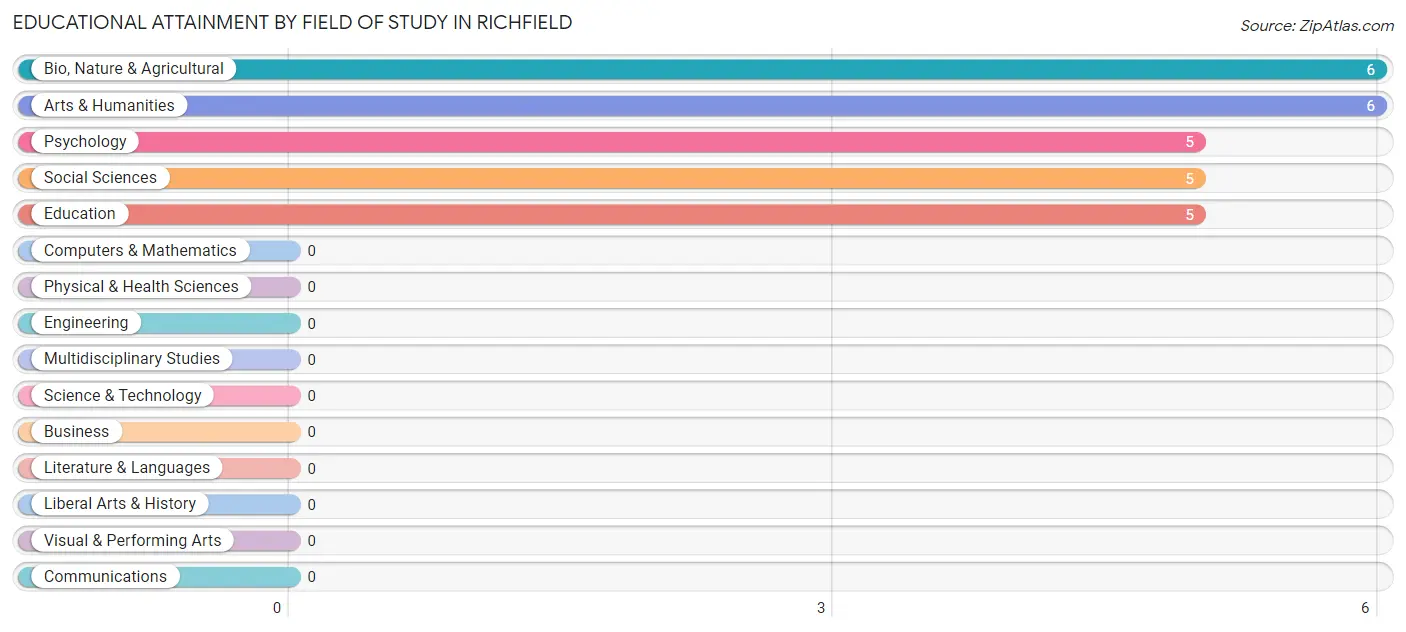
| Field of Study | # Graduates | % Graduates |
| Computers & Mathematics | 0 | 0.0% |
| Bio, Nature & Agricultural | 6 | 22.2% |
| Physical & Health Sciences | 0 | 0.0% |
| Psychology | 5 | 18.5% |
| Social Sciences | 5 | 18.5% |
| Engineering | 0 | 0.0% |
| Multidisciplinary Studies | 0 | 0.0% |
| Science & Technology | 0 | 0.0% |
| Business | 0 | 0.0% |
| Education | 5 | 18.5% |
| Literature & Languages | 0 | 0.0% |
| Liberal Arts & History | 0 | 0.0% |
| Visual & Performing Arts | 0 | 0.0% |
| Communications | 0 | 0.0% |
| Arts & Humanities | 6 | 22.2% |
| Total | 27 | 100.0% |
Transportation & Commute in Richfield
Vehicle Availability by Sex in Richfield
The most prevalent vehicle ownership categories in Richfield are males with 3 vehicles (14, accounting for 45.2%) and females with 3 vehicles (9, making up 66.7%).
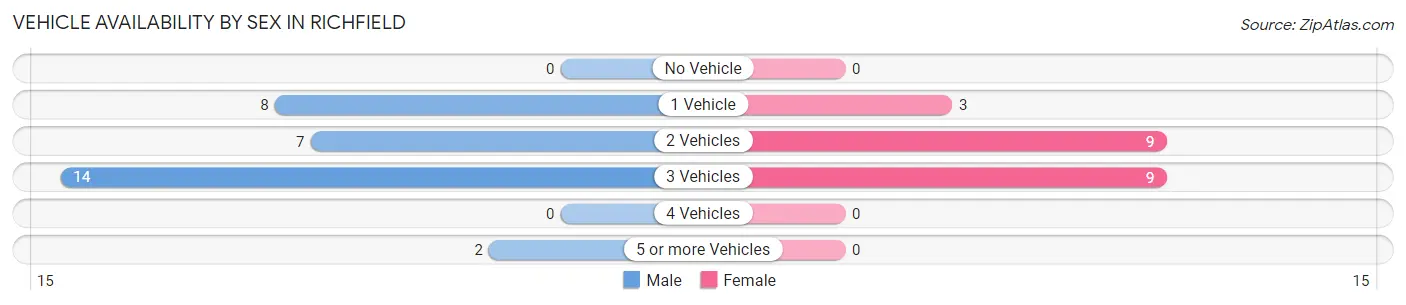
| Vehicles Available | Male | Female |
| No Vehicle | 0 (0.0%) | 0 (0.0%) |
| 1 Vehicle | 8 (25.8%) | 3 (14.3%) |
| 2 Vehicles | 7 (22.6%) | 9 (42.9%) |
| 3 Vehicles | 14 (45.2%) | 9 (42.9%) |
| 4 Vehicles | 0 (0.0%) | 0 (0.0%) |
| 5 or more Vehicles | 2 (6.5%) | 0 (0.0%) |
| Total | 31 (100.0%) | 21 (100.0%) |
Commute Time in Richfield
The most frequently occuring commute durations in Richfield are 45 to 59 minutes (11 commuters, 24.4%), 5 to 9 minutes (10 commuters, 22.2%), and 10 to 14 minutes (8 commuters, 17.8%).
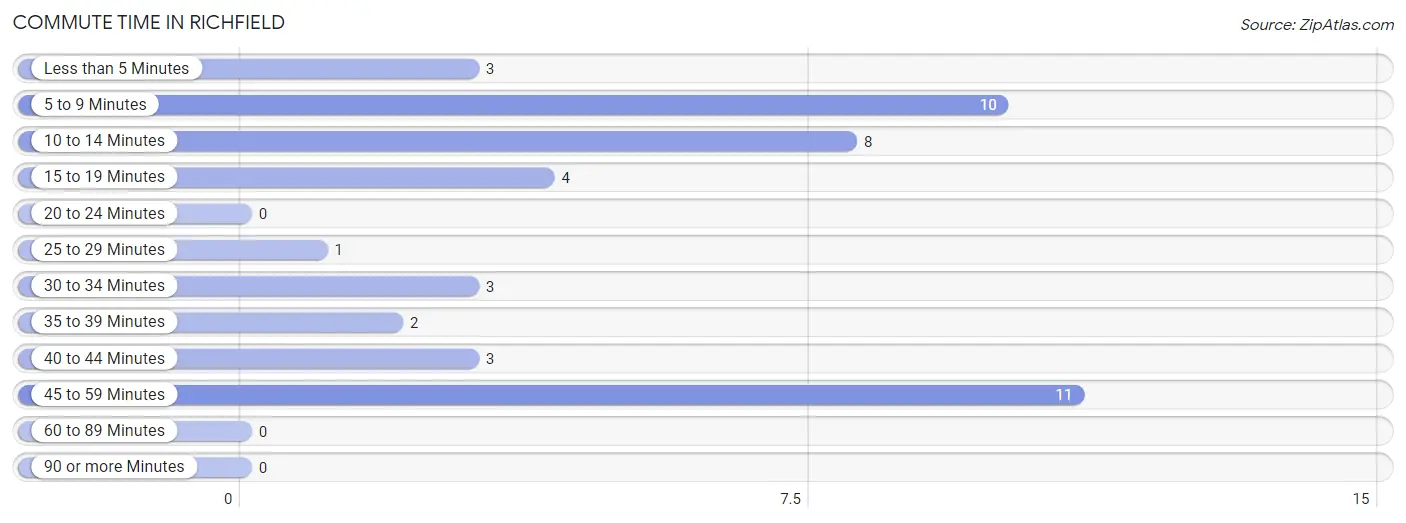
| Commute Time | # Commuters | % Commuters |
| Less than 5 Minutes | 3 | 6.7% |
| 5 to 9 Minutes | 10 | 22.2% |
| 10 to 14 Minutes | 8 | 17.8% |
| 15 to 19 Minutes | 4 | 8.9% |
| 20 to 24 Minutes | 0 | 0.0% |
| 25 to 29 Minutes | 1 | 2.2% |
| 30 to 34 Minutes | 3 | 6.7% |
| 35 to 39 Minutes | 2 | 4.4% |
| 40 to 44 Minutes | 3 | 6.7% |
| 45 to 59 Minutes | 11 | 24.4% |
| 60 to 89 Minutes | 0 | 0.0% |
| 90 or more Minutes | 0 | 0.0% |
Commute Time by Sex in Richfield
The most common commute times in Richfield are 10 to 14 minutes (8 commuters, 33.3%) for males and 5 to 9 minutes (6 commuters, 28.6%) for females.
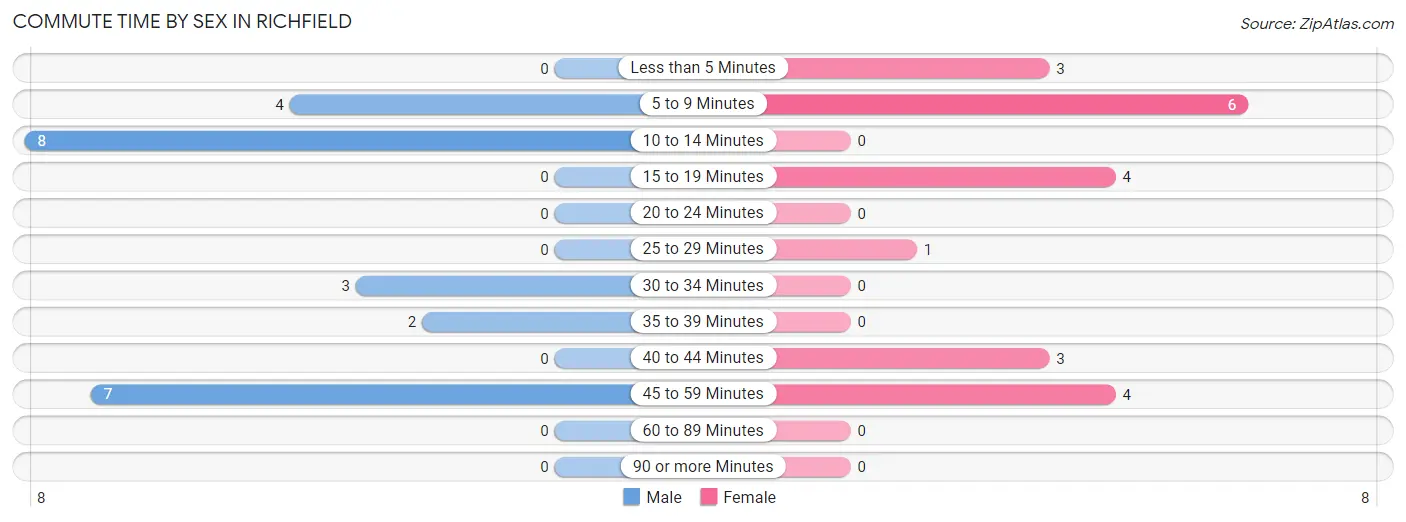
| Commute Time | Male | Female |
| Less than 5 Minutes | 0 (0.0%) | 3 (14.3%) |
| 5 to 9 Minutes | 4 (16.7%) | 6 (28.6%) |
| 10 to 14 Minutes | 8 (33.3%) | 0 (0.0%) |
| 15 to 19 Minutes | 0 (0.0%) | 4 (19.1%) |
| 20 to 24 Minutes | 0 (0.0%) | 0 (0.0%) |
| 25 to 29 Minutes | 0 (0.0%) | 1 (4.8%) |
| 30 to 34 Minutes | 3 (12.5%) | 0 (0.0%) |
| 35 to 39 Minutes | 2 (8.3%) | 0 (0.0%) |
| 40 to 44 Minutes | 0 (0.0%) | 3 (14.3%) |
| 45 to 59 Minutes | 7 (29.2%) | 4 (19.1%) |
| 60 to 89 Minutes | 0 (0.0%) | 0 (0.0%) |
| 90 or more Minutes | 0 (0.0%) | 0 (0.0%) |
Time of Departure to Work by Sex in Richfield
The most frequent times of departure to work in Richfield are 6:30 AM to 6:59 AM (8, 33.3%) for males and 7:30 AM to 7:59 AM (6, 28.6%) for females.
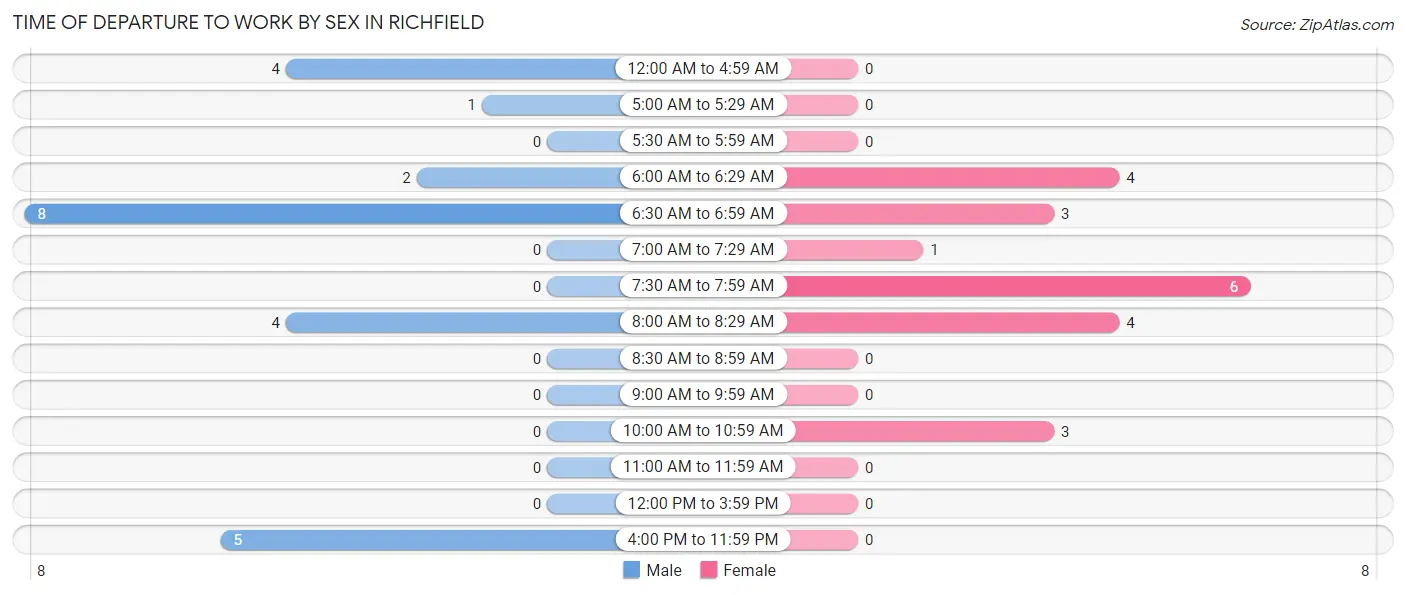
| Time of Departure | Male | Female |
| 12:00 AM to 4:59 AM | 4 (16.7%) | 0 (0.0%) |
| 5:00 AM to 5:29 AM | 1 (4.2%) | 0 (0.0%) |
| 5:30 AM to 5:59 AM | 0 (0.0%) | 0 (0.0%) |
| 6:00 AM to 6:29 AM | 2 (8.3%) | 4 (19.1%) |
| 6:30 AM to 6:59 AM | 8 (33.3%) | 3 (14.3%) |
| 7:00 AM to 7:29 AM | 0 (0.0%) | 1 (4.8%) |
| 7:30 AM to 7:59 AM | 0 (0.0%) | 6 (28.6%) |
| 8:00 AM to 8:29 AM | 4 (16.7%) | 4 (19.1%) |
| 8:30 AM to 8:59 AM | 0 (0.0%) | 0 (0.0%) |
| 9:00 AM to 9:59 AM | 0 (0.0%) | 0 (0.0%) |
| 10:00 AM to 10:59 AM | 0 (0.0%) | 3 (14.3%) |
| 11:00 AM to 11:59 AM | 0 (0.0%) | 0 (0.0%) |
| 12:00 PM to 3:59 PM | 0 (0.0%) | 0 (0.0%) |
| 4:00 PM to 11:59 PM | 5 (20.8%) | 0 (0.0%) |
| Total | 24 (100.0%) | 21 (100.0%) |
Housing Occupancy in Richfield
Occupancy by Ownership in Richfield
Of the total 70 dwellings in Richfield, owner-occupied units account for 47 (67.1%), while renter-occupied units make up 23 (32.9%).
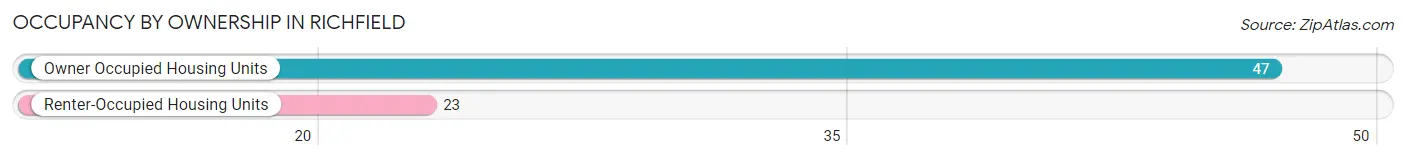
| Occupancy | # Housing Units | % Housing Units |
| Owner Occupied Housing Units | 47 | 67.1% |
| Renter-Occupied Housing Units | 23 | 32.9% |
| Total Occupied Housing Units | 70 | 100.0% |
Occupancy by Household Size in Richfield
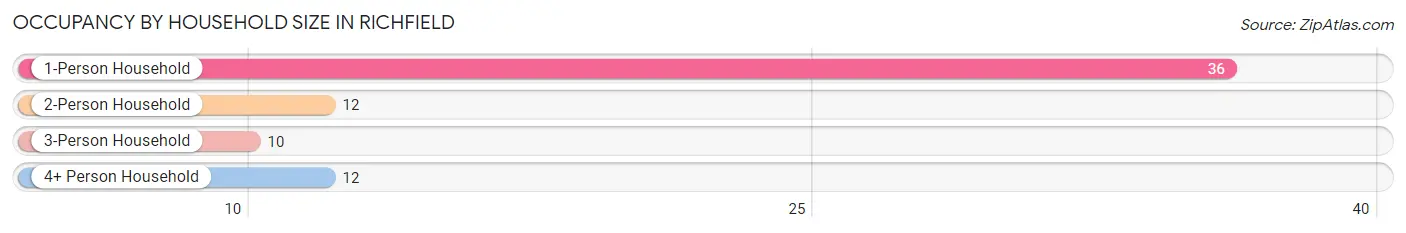
| Household Size | # Housing Units | % Housing Units |
| 1-Person Household | 36 | 51.4% |
| 2-Person Household | 12 | 17.1% |
| 3-Person Household | 10 | 14.3% |
| 4+ Person Household | 12 | 17.1% |
| Total Housing Units | 70 | 100.0% |
Occupancy by Ownership by Household Size in Richfield
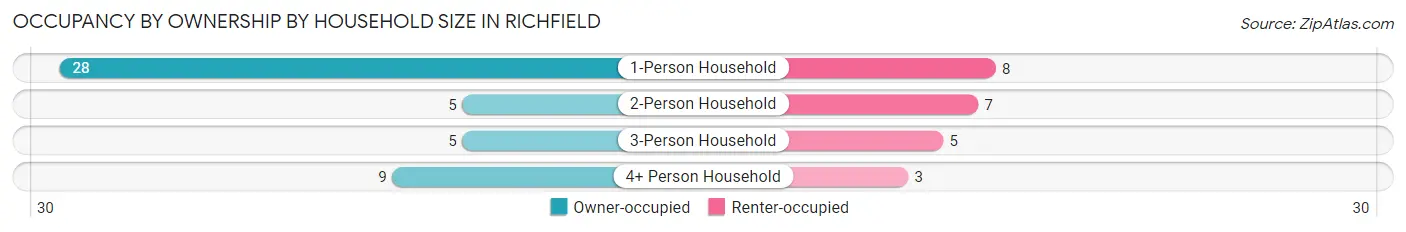
| Household Size | Owner-occupied | Renter-occupied |
| 1-Person Household | 28 (77.8%) | 8 (22.2%) |
| 2-Person Household | 5 (41.7%) | 7 (58.3%) |
| 3-Person Household | 5 (50.0%) | 5 (50.0%) |
| 4+ Person Household | 9 (75.0%) | 3 (25.0%) |
| Total Housing Units | 47 (67.1%) | 23 (32.9%) |
Occupancy by Educational Attainment in Richfield
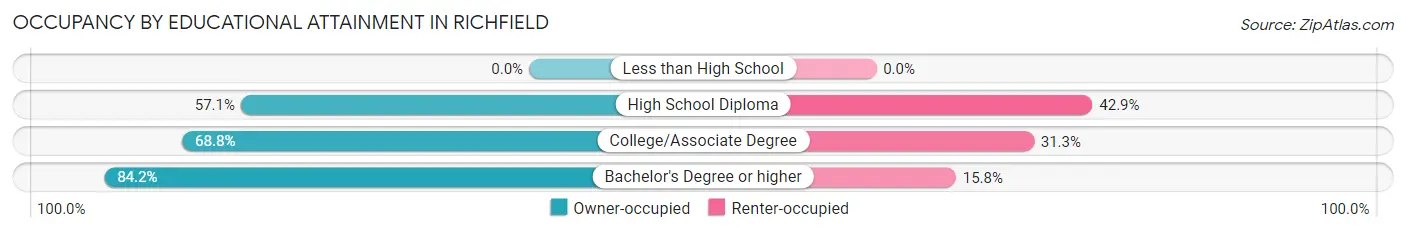
| Household Size | Owner-occupied | Renter-occupied |
| Less than High School | 0 (0.0%) | 0 (0.0%) |
| High School Diploma | 20 (57.1%) | 15 (42.9%) |
| College/Associate Degree | 11 (68.8%) | 5 (31.2%) |
| Bachelor's Degree or higher | 16 (84.2%) | 3 (15.8%) |
Occupancy by Age of Householder in Richfield
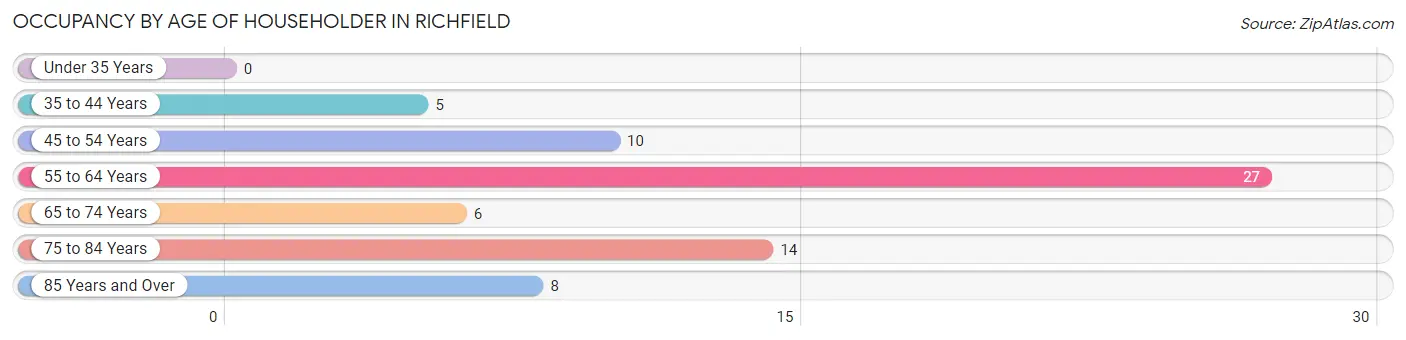
| Age Bracket | # Households | % Households |
| Under 35 Years | 0 | 0.0% |
| 35 to 44 Years | 5 | 7.1% |
| 45 to 54 Years | 10 | 14.3% |
| 55 to 64 Years | 27 | 38.6% |
| 65 to 74 Years | 6 | 8.6% |
| 75 to 84 Years | 14 | 20.0% |
| 85 Years and Over | 8 | 11.4% |
| Total | 70 | 100.0% |
Housing Finances in Richfield
Median Income by Occupancy in Richfield
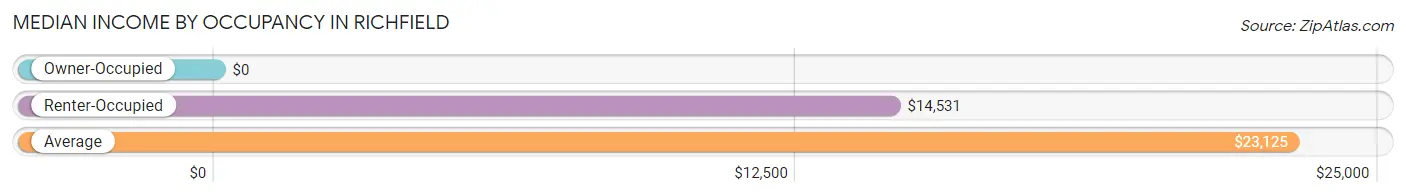
| Occupancy Type | # Households | Median Income |
| Owner-Occupied | 47 (67.1%) | $0 |
| Renter-Occupied | 23 (32.9%) | $14,531 |
| Average | 70 (100.0%) | $23,125 |
Occupancy by Householder Income Bracket in Richfield
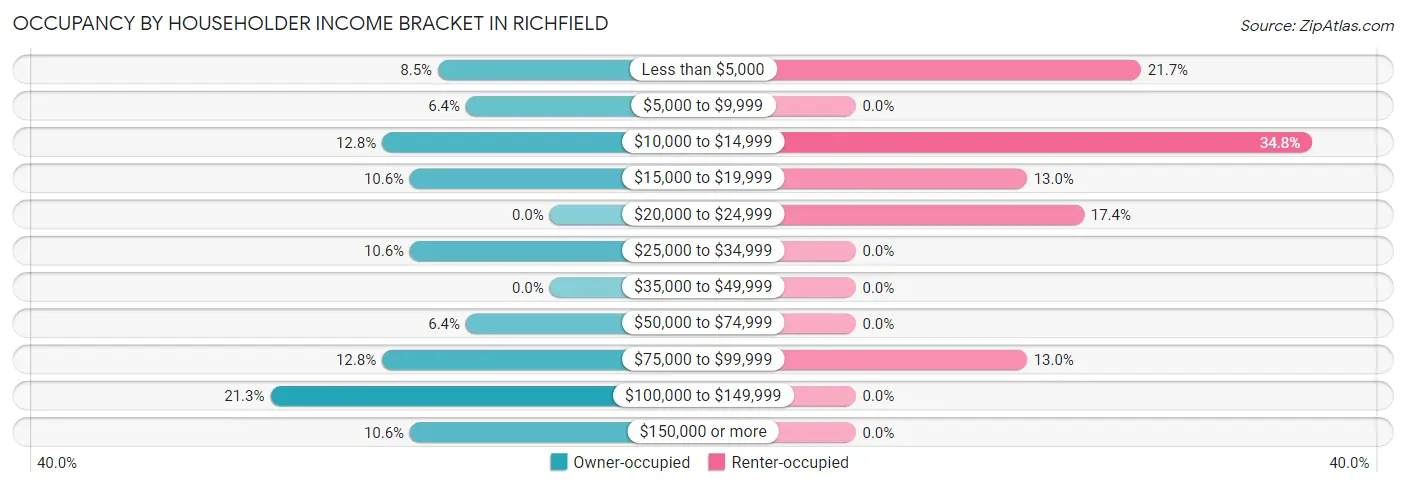
| Income Bracket | Owner-occupied | Renter-occupied |
| Less than $5,000 | 4 (8.5%) | 5 (21.7%) |
| $5,000 to $9,999 | 3 (6.4%) | 0 (0.0%) |
| $10,000 to $14,999 | 6 (12.8%) | 8 (34.8%) |
| $15,000 to $19,999 | 5 (10.6%) | 3 (13.0%) |
| $20,000 to $24,999 | 0 (0.0%) | 4 (17.4%) |
| $25,000 to $34,999 | 5 (10.6%) | 0 (0.0%) |
| $35,000 to $49,999 | 0 (0.0%) | 0 (0.0%) |
| $50,000 to $74,999 | 3 (6.4%) | 0 (0.0%) |
| $75,000 to $99,999 | 6 (12.8%) | 3 (13.0%) |
| $100,000 to $149,999 | 10 (21.3%) | 0 (0.0%) |
| $150,000 or more | 5 (10.6%) | 0 (0.0%) |
| Total | 47 (100.0%) | 23 (100.0%) |
Monthly Housing Cost Tiers in Richfield
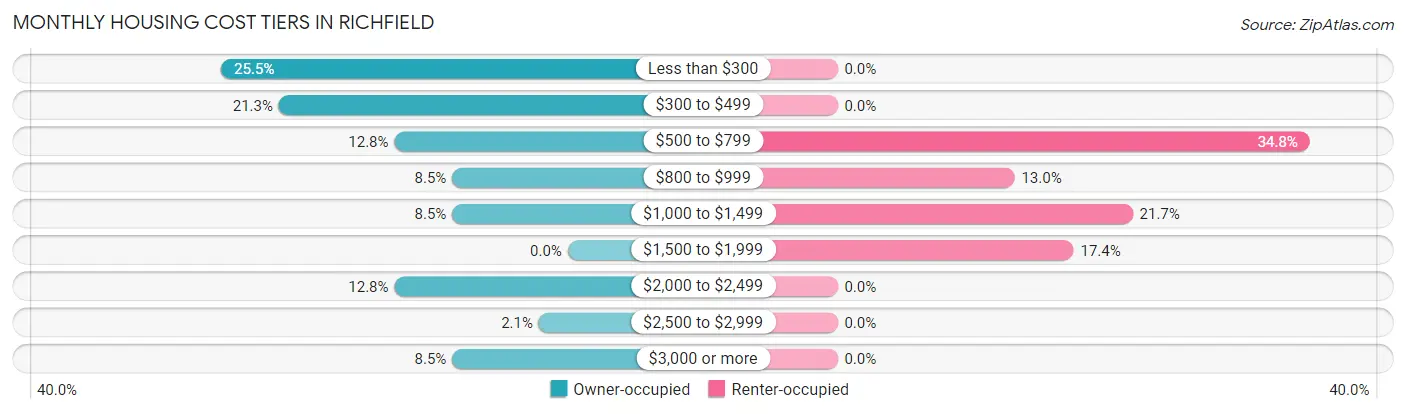
| Monthly Cost | Owner-occupied | Renter-occupied |
| Less than $300 | 12 (25.5%) | 0 (0.0%) |
| $300 to $499 | 10 (21.3%) | 0 (0.0%) |
| $500 to $799 | 6 (12.8%) | 8 (34.8%) |
| $800 to $999 | 4 (8.5%) | 3 (13.0%) |
| $1,000 to $1,499 | 4 (8.5%) | 5 (21.7%) |
| $1,500 to $1,999 | 0 (0.0%) | 4 (17.4%) |
| $2,000 to $2,499 | 6 (12.8%) | 0 (0.0%) |
| $2,500 to $2,999 | 1 (2.1%) | 0 (0.0%) |
| $3,000 or more | 4 (8.5%) | 0 (0.0%) |
| Total | 47 (100.0%) | 23 (100.0%) |
Physical Housing Characteristics in Richfield
Housing Structures in Richfield
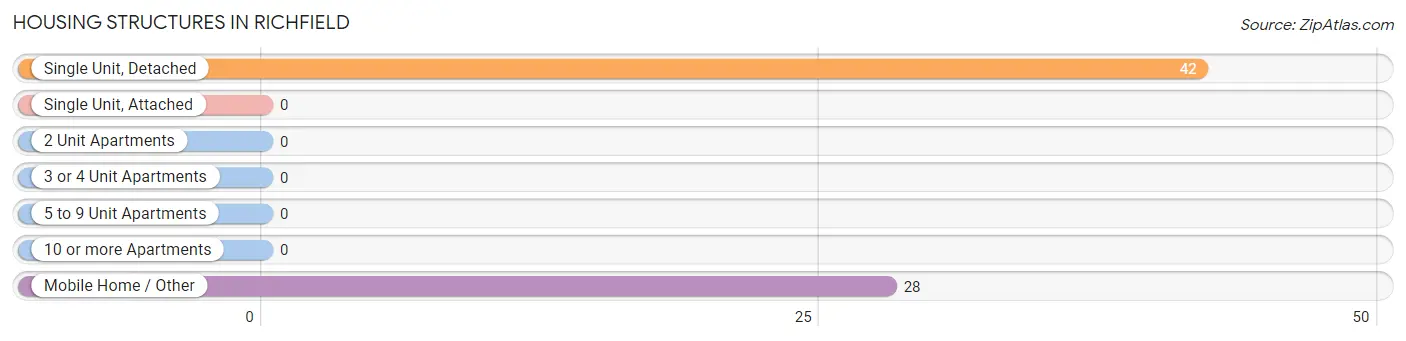
| Structure Type | # Housing Units | % Housing Units |
| Single Unit, Detached | 42 | 60.0% |
| Single Unit, Attached | 0 | 0.0% |
| 2 Unit Apartments | 0 | 0.0% |
| 3 or 4 Unit Apartments | 0 | 0.0% |
| 5 to 9 Unit Apartments | 0 | 0.0% |
| 10 or more Apartments | 0 | 0.0% |
| Mobile Home / Other | 28 | 40.0% |
| Total | 70 | 100.0% |
Housing Structures by Occupancy in Richfield
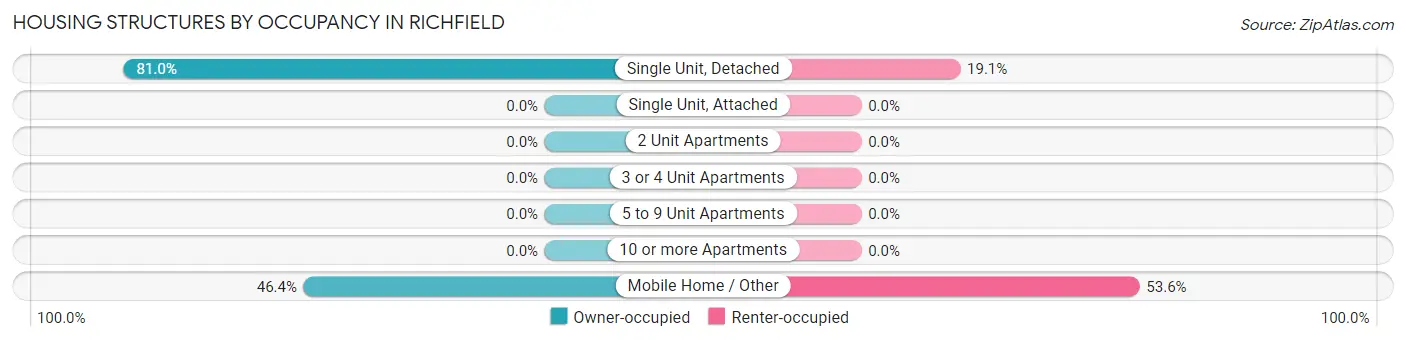
| Structure Type | Owner-occupied | Renter-occupied |
| Single Unit, Detached | 34 (80.9%) | 8 (19.1%) |
| Single Unit, Attached | 0 (0.0%) | 0 (0.0%) |
| 2 Unit Apartments | 0 (0.0%) | 0 (0.0%) |
| 3 or 4 Unit Apartments | 0 (0.0%) | 0 (0.0%) |
| 5 to 9 Unit Apartments | 0 (0.0%) | 0 (0.0%) |
| 10 or more Apartments | 0 (0.0%) | 0 (0.0%) |
| Mobile Home / Other | 13 (46.4%) | 15 (53.6%) |
| Total | 47 (67.1%) | 23 (32.9%) |
Housing Structures by Number of Rooms in Richfield
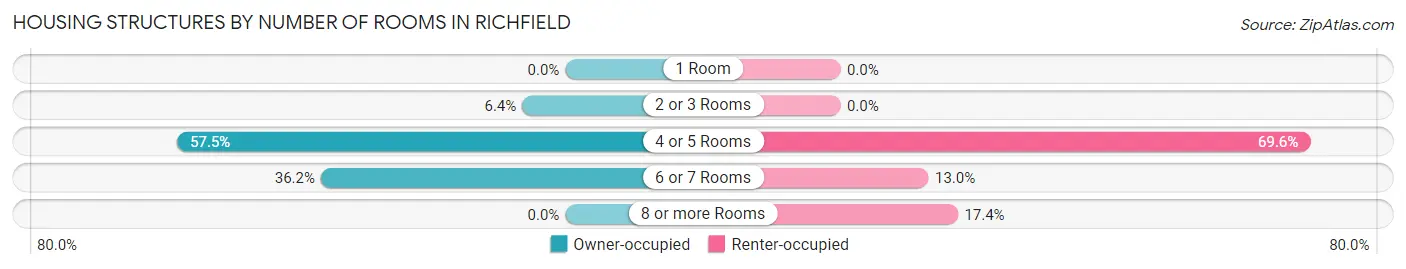
| Number of Rooms | Owner-occupied | Renter-occupied |
| 1 Room | 0 (0.0%) | 0 (0.0%) |
| 2 or 3 Rooms | 3 (6.4%) | 0 (0.0%) |
| 4 or 5 Rooms | 27 (57.5%) | 16 (69.6%) |
| 6 or 7 Rooms | 17 (36.2%) | 3 (13.0%) |
| 8 or more Rooms | 0 (0.0%) | 4 (17.4%) |
| Total | 47 (100.0%) | 23 (100.0%) |
Housing Structure by Heating Type in Richfield
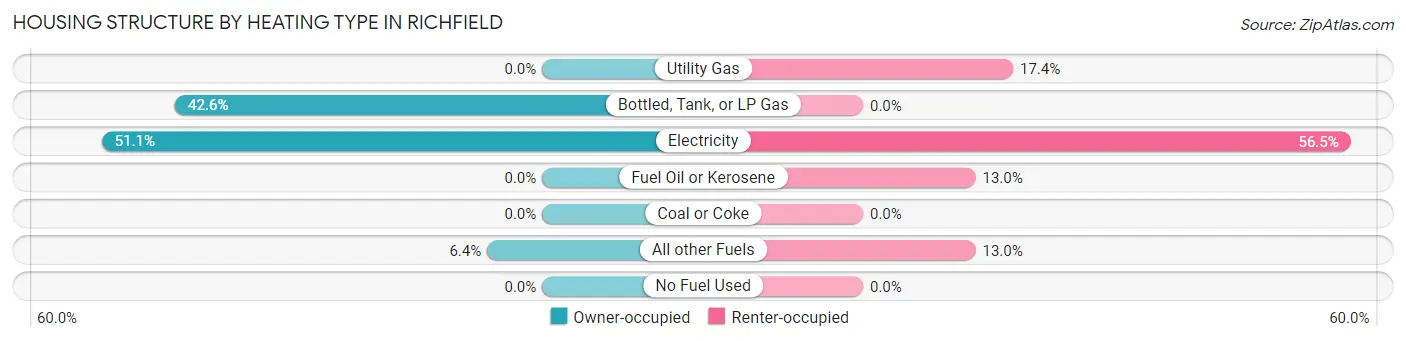
| Heating Type | Owner-occupied | Renter-occupied |
| Utility Gas | 0 (0.0%) | 4 (17.4%) |
| Bottled, Tank, or LP Gas | 20 (42.5%) | 0 (0.0%) |
| Electricity | 24 (51.1%) | 13 (56.5%) |
| Fuel Oil or Kerosene | 0 (0.0%) | 3 (13.0%) |
| Coal or Coke | 0 (0.0%) | 0 (0.0%) |
| All other Fuels | 3 (6.4%) | 3 (13.0%) |
| No Fuel Used | 0 (0.0%) | 0 (0.0%) |
| Total | 47 (100.0%) | 23 (100.0%) |
Household Vehicle Usage in Richfield
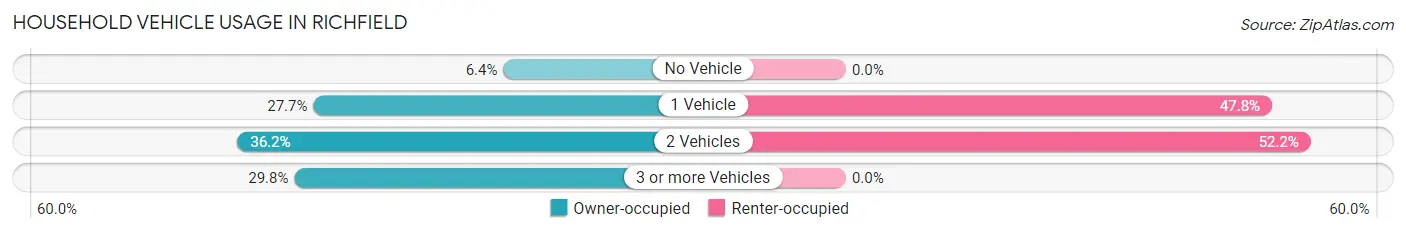
| Vehicles per Household | Owner-occupied | Renter-occupied |
| No Vehicle | 3 (6.4%) | 0 (0.0%) |
| 1 Vehicle | 13 (27.7%) | 11 (47.8%) |
| 2 Vehicles | 17 (36.2%) | 12 (52.2%) |
| 3 or more Vehicles | 14 (29.8%) | 0 (0.0%) |
| Total | 47 (100.0%) | 23 (100.0%) |
Real Estate & Mortgages in Richfield
Real Estate and Mortgage Overview in Richfield
| Characteristic | Without Mortgage | With Mortgage |
| Housing Units | 28 | 19 |
| Median Property Value | $171,900 | $295,800 |
| Median Household Income | - | - |
| Monthly Housing Costs | $364 | $4 |
| Real Estate Taxes | $1,313 | $0 |
Property Value by Mortgage Status in Richfield
| Property Value | Without Mortgage | With Mortgage |
| Less than $50,000 | 0 (0.0%) | 0 (0.0%) |
| $50,000 to $99,999 | 7 (25.0%) | 0 (0.0%) |
| $100,000 to $299,999 | 21 (75.0%) | 10 (52.6%) |
| $300,000 to $499,999 | 0 (0.0%) | 8 (42.1%) |
| $500,000 to $749,999 | 0 (0.0%) | 1 (5.3%) |
| $750,000 to $999,999 | 0 (0.0%) | 0 (0.0%) |
| $1,000,000 or more | 0 (0.0%) | 0 (0.0%) |
| Total | 28 (100.0%) | 19 (100.0%) |
Household Income by Mortgage Status in Richfield
| Household Income | Without Mortgage | With Mortgage |
| Less than $10,000 | 0 (0.0%) | 0 (0.0%) |
| $10,000 to $24,999 | 11 (39.3%) | 7 (36.8%) |
| $25,000 to $34,999 | 4 (14.3%) | 0 (0.0%) |
| $35,000 to $49,999 | 0 (0.0%) | 1 (5.3%) |
| $50,000 to $74,999 | 3 (10.7%) | 0 (0.0%) |
| $75,000 to $99,999 | 2 (7.1%) | 0 (0.0%) |
| $100,000 to $149,999 | 8 (28.6%) | 4 (21.0%) |
| $150,000 or more | 0 (0.0%) | 2 (10.5%) |
| Total | 28 (100.0%) | 19 (100.0%) |
Property Value to Household Income Ratio in Richfield
| Value-to-Income Ratio | Without Mortgage | With Mortgage |
| Less than 2.0x | 11 (39.3%) | 0 (0.0%) |
| 2.0x to 2.9x | 6 (21.4%) | 4 (21.0%) |
| 3.0x to 3.9x | 0 (0.0%) | 6 (31.6%) |
| 4.0x or more | 11 (39.3%) | 1 (5.3%) |
| Total | 28 (100.0%) | 19 (100.0%) |
Real Estate Taxes by Mortgage Status in Richfield
| Property Taxes | Without Mortgage | With Mortgage |
| Less than $800 | 5 (17.9%) | 0 (0.0%) |
| $800 to $1,499 | 12 (42.9%) | 0 (0.0%) |
| $800 to $1,499 | 11 (39.3%) | 8 (42.1%) |
| Total | 28 (100.0%) | 19 (100.0%) |
Health & Disability in Richfield
Health Insurance Coverage by Age in Richfield
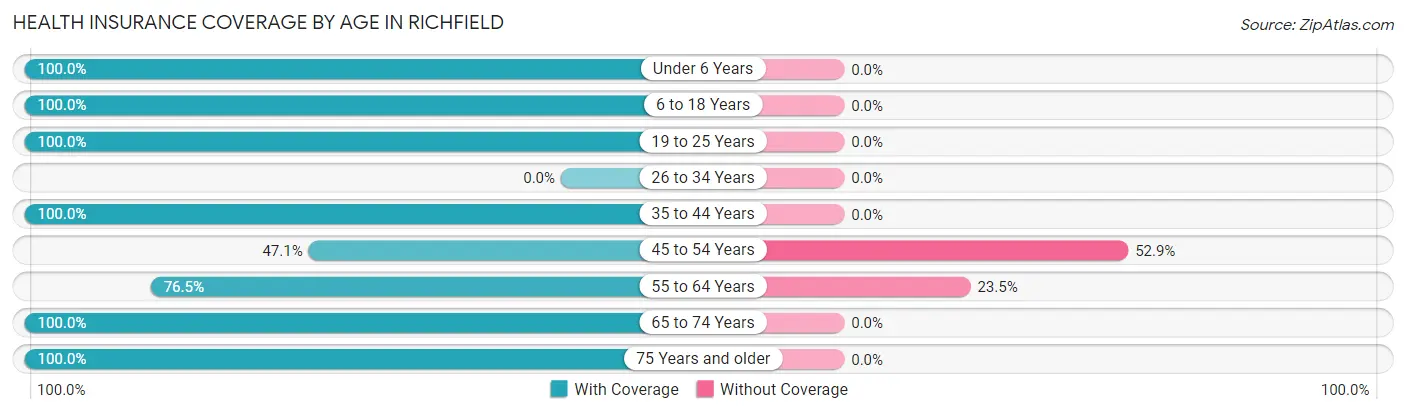
| Age Bracket | With Coverage | Without Coverage |
| Under 6 Years | 8 (100.0%) | 0 (0.0%) |
| 6 to 18 Years | 27 (100.0%) | 0 (0.0%) |
| 19 to 25 Years | 3 (100.0%) | 0 (0.0%) |
| 26 to 34 Years | 0 (0.0%) | 0 (0.0%) |
| 35 to 44 Years | 14 (100.0%) | 0 (0.0%) |
| 45 to 54 Years | 8 (47.1%) | 9 (52.9%) |
| 55 to 64 Years | 26 (76.5%) | 8 (23.5%) |
| 65 to 74 Years | 6 (100.0%) | 0 (0.0%) |
| 75 Years and older | 33 (100.0%) | 0 (0.0%) |
| Total | 125 (88.0%) | 17 (12.0%) |
Health Insurance Coverage by Citizenship Status in Richfield
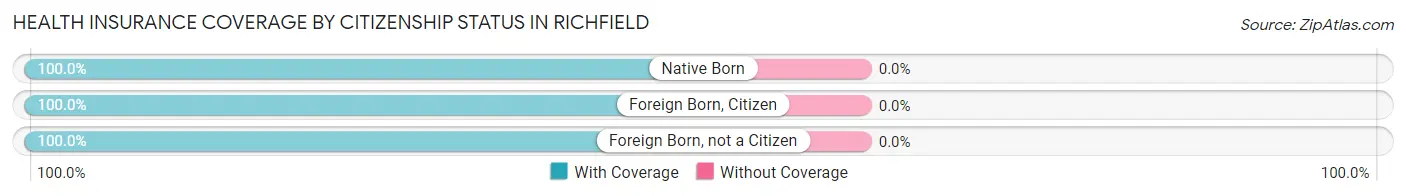
| Citizenship Status | With Coverage | Without Coverage |
| Native Born | 8 (100.0%) | 0 (0.0%) |
| Foreign Born, Citizen | 27 (100.0%) | 0 (0.0%) |
| Foreign Born, not a Citizen | 3 (100.0%) | 0 (0.0%) |
Health Insurance Coverage by Household Income in Richfield
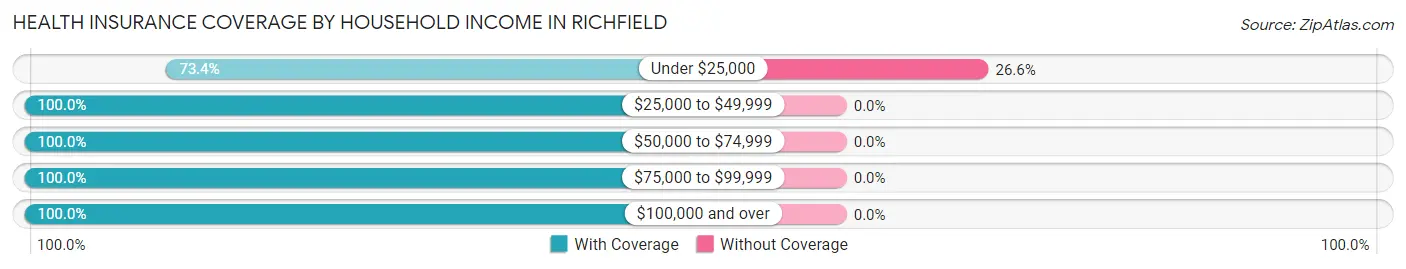
| Household Income | With Coverage | Without Coverage |
| Under $25,000 | 47 (73.4%) | 17 (26.6%) |
| $25,000 to $49,999 | 5 (100.0%) | 0 (0.0%) |
| $50,000 to $74,999 | 7 (100.0%) | 0 (0.0%) |
| $75,000 to $99,999 | 21 (100.0%) | 0 (0.0%) |
| $100,000 and over | 45 (100.0%) | 0 (0.0%) |
Public vs Private Health Insurance Coverage by Age in Richfield
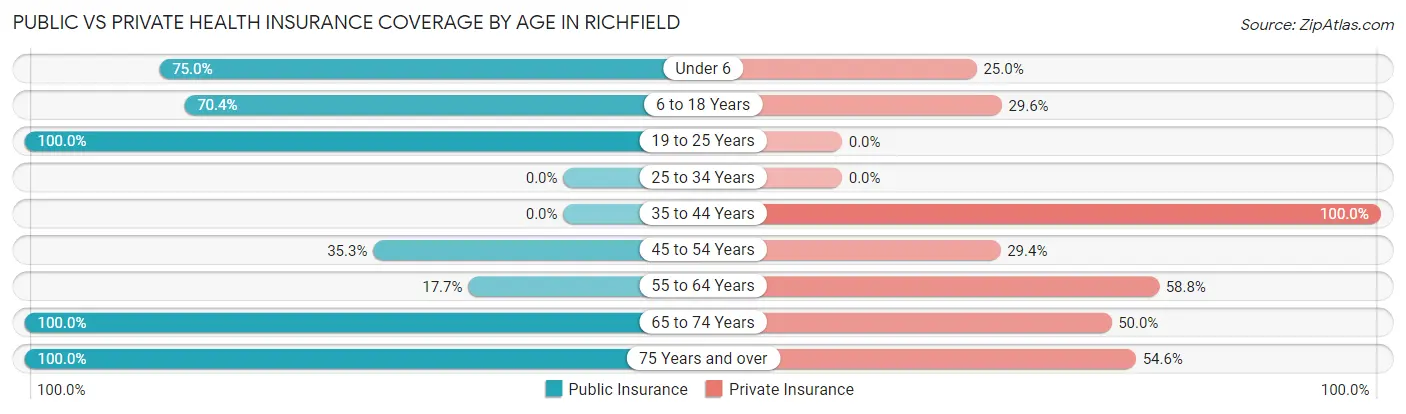
| Age Bracket | Public Insurance | Private Insurance |
| Under 6 | 6 (75.0%) | 2 (25.0%) |
| 6 to 18 Years | 19 (70.4%) | 8 (29.6%) |
| 19 to 25 Years | 3 (100.0%) | 0 (0.0%) |
| 25 to 34 Years | 0 (0.0%) | 0 (0.0%) |
| 35 to 44 Years | 0 (0.0%) | 14 (100.0%) |
| 45 to 54 Years | 6 (35.3%) | 5 (29.4%) |
| 55 to 64 Years | 6 (17.6%) | 20 (58.8%) |
| 65 to 74 Years | 6 (100.0%) | 3 (50.0%) |
| 75 Years and over | 33 (100.0%) | 18 (54.5%) |
| Total | 79 (55.6%) | 70 (49.3%) |
Disability Status by Sex by Age in Richfield
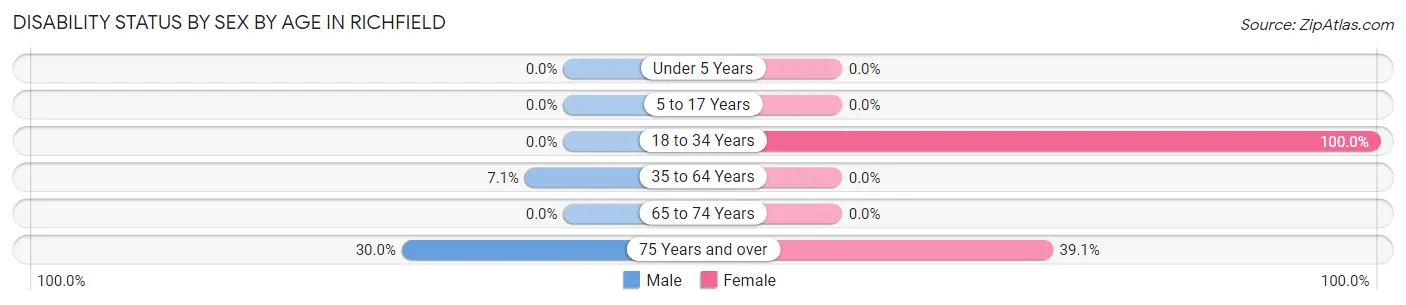
| Age Bracket | Male | Female |
| Under 5 Years | 0 (0.0%) | 0 (0.0%) |
| 5 to 17 Years | 0 (0.0%) | 0 (0.0%) |
| 18 to 34 Years | 0 (0.0%) | 4 (100.0%) |
| 35 to 64 Years | 2 (7.1%) | 0 (0.0%) |
| 65 to 74 Years | 0 (0.0%) | 0 (0.0%) |
| 75 Years and over | 3 (30.0%) | 9 (39.1%) |
Disability Class by Sex by Age in Richfield
Disability Class: Hearing Difficulty
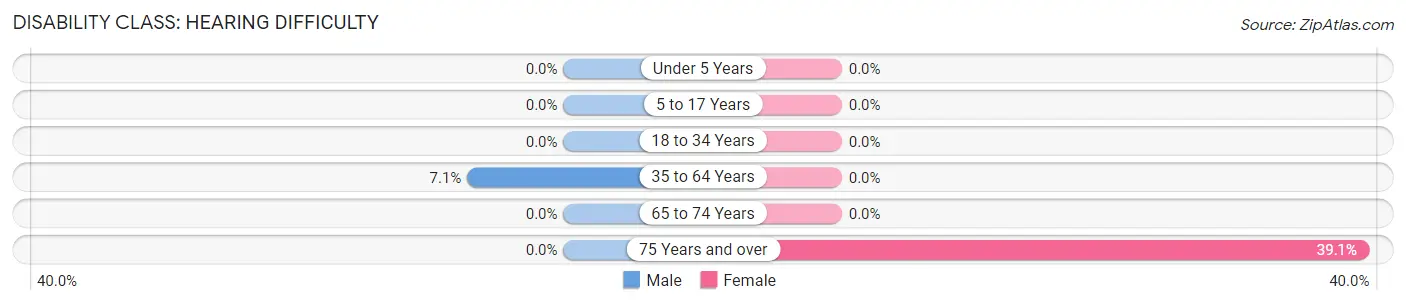
| Age Bracket | Male | Female |
| Under 5 Years | 0 (0.0%) | 0 (0.0%) |
| 5 to 17 Years | 0 (0.0%) | 0 (0.0%) |
| 18 to 34 Years | 0 (0.0%) | 0 (0.0%) |
| 35 to 64 Years | 2 (7.1%) | 0 (0.0%) |
| 65 to 74 Years | 0 (0.0%) | 0 (0.0%) |
| 75 Years and over | 0 (0.0%) | 9 (39.1%) |
Disability Class: Vision Difficulty
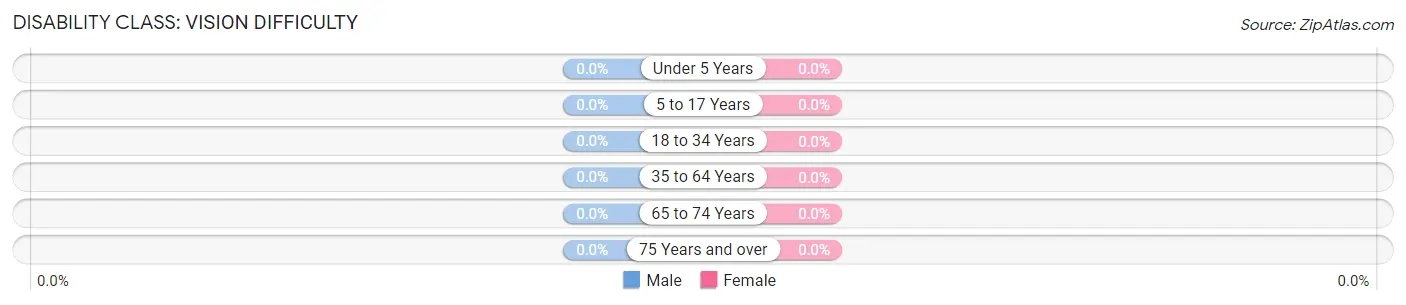
| Age Bracket | Male | Female |
| Under 5 Years | 0 (0.0%) | 0 (0.0%) |
| 5 to 17 Years | 0 (0.0%) | 0 (0.0%) |
| 18 to 34 Years | 0 (0.0%) | 0 (0.0%) |
| 35 to 64 Years | 0 (0.0%) | 0 (0.0%) |
| 65 to 74 Years | 0 (0.0%) | 0 (0.0%) |
| 75 Years and over | 0 (0.0%) | 0 (0.0%) |
Disability Class: Cognitive Difficulty
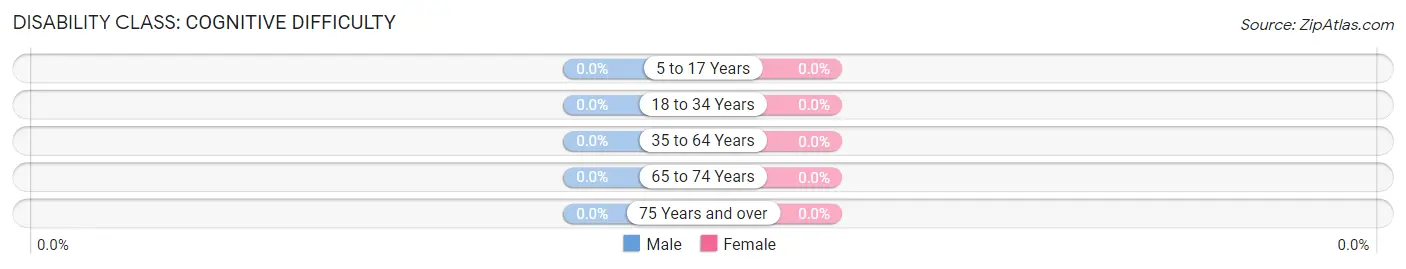
| Age Bracket | Male | Female |
| 5 to 17 Years | 0 (0.0%) | 0 (0.0%) |
| 18 to 34 Years | 0 (0.0%) | 0 (0.0%) |
| 35 to 64 Years | 0 (0.0%) | 0 (0.0%) |
| 65 to 74 Years | 0 (0.0%) | 0 (0.0%) |
| 75 Years and over | 0 (0.0%) | 0 (0.0%) |
Disability Class: Ambulatory Difficulty
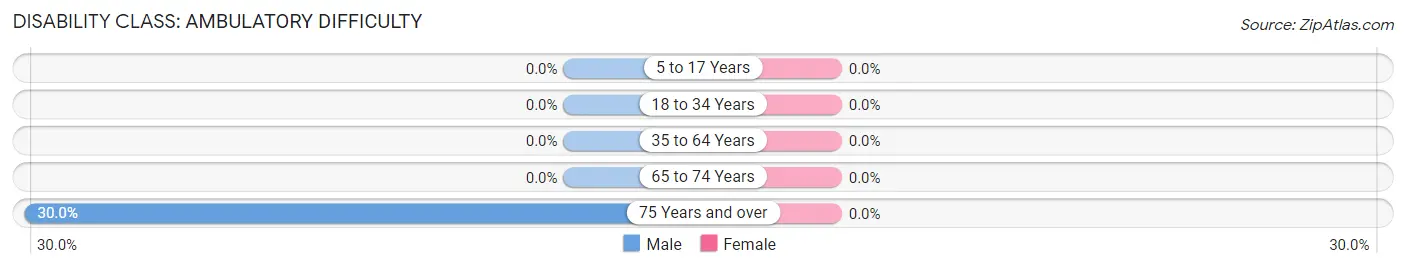
| Age Bracket | Male | Female |
| 5 to 17 Years | 0 (0.0%) | 0 (0.0%) |
| 18 to 34 Years | 0 (0.0%) | 0 (0.0%) |
| 35 to 64 Years | 0 (0.0%) | 0 (0.0%) |
| 65 to 74 Years | 0 (0.0%) | 0 (0.0%) |
| 75 Years and over | 3 (30.0%) | 0 (0.0%) |
Disability Class: Self-Care Difficulty
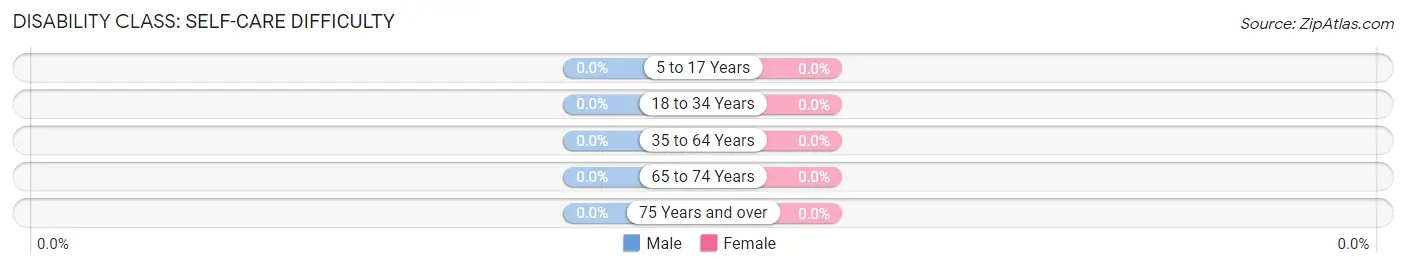
| Age Bracket | Male | Female |
| 5 to 17 Years | 0 (0.0%) | 0 (0.0%) |
| 18 to 34 Years | 0 (0.0%) | 0 (0.0%) |
| 35 to 64 Years | 0 (0.0%) | 0 (0.0%) |
| 65 to 74 Years | 0 (0.0%) | 0 (0.0%) |
| 75 Years and over | 0 (0.0%) | 0 (0.0%) |
Technology Access in Richfield
Computing Device Access in Richfield
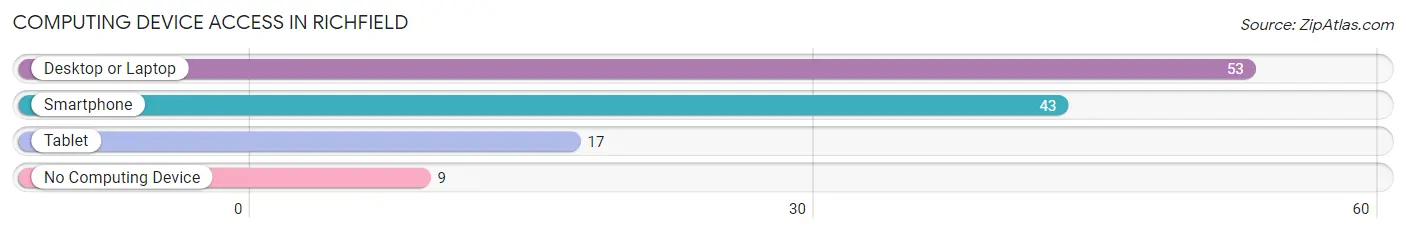
| Device Type | # Households | % Households |
| Desktop or Laptop | 53 | 75.7% |
| Smartphone | 43 | 61.4% |
| Tablet | 17 | 24.3% |
| No Computing Device | 9 | 12.9% |
| Total | 70 | 100.0% |
Internet Access in Richfield
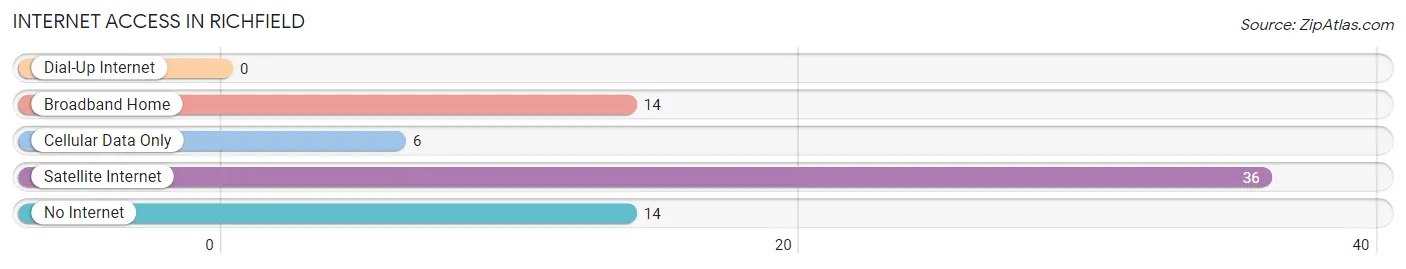
| Internet Type | # Households | % Households |
| Dial-Up Internet | 0 | 0.0% |
| Broadband Home | 14 | 20.0% |
| Cellular Data Only | 6 | 8.6% |
| Satellite Internet | 36 | 51.4% |
| No Internet | 14 | 20.0% |
| Total | 70 | 100.0% |
Richfield Summary
Richfield is a small unincorporated community located in Fresno County, California. It is situated in the San Joaquin Valley, approximately 10 miles south of the city of Fresno. Richfield is a rural community with a population of approximately 1,000 people.
History
Richfield was founded in 1891 by a group of settlers from the Midwest. The settlers were attracted to the area by the fertile soil and the abundance of water from the nearby Kings River. The settlers named the town after the rich soil in the area.
The town grew slowly but steadily over the years, and by the early 1900s, it had become a thriving agricultural community. The main crops grown in the area were cotton, wheat, and alfalfa. The town also had a few small businesses, including a general store, a blacksmith shop, and a post office.
In the 1920s, Richfield began to experience a period of growth and prosperity. The town was connected to the outside world by the Southern Pacific Railroad, and the population increased to over 1,000 people. The town also had a number of businesses, including a bank, a hotel, a movie theater, and a variety of stores.
In the 1950s, Richfield began to decline as the population moved away to larger cities. The town’s economy was further weakened by the closure of the Southern Pacific Railroad in the 1960s. By the 1970s, the population had dropped to less than 500 people.
Geography
Richfield is located in the San Joaquin Valley, approximately 10 miles south of the city of Fresno. The town is situated on the Kings River, which provides a source of irrigation for the surrounding agricultural land. The town is surrounded by rolling hills and is located at an elevation of approximately 300 feet.
The climate in Richfield is hot and dry in the summer months, with temperatures reaching up to 100 degrees Fahrenheit. The winters are mild, with temperatures rarely dropping below freezing.
Economy
The economy of Richfield is largely based on agriculture. The main crops grown in the area are cotton, wheat, and alfalfa. The town also has a few small businesses, including a general store, a blacksmith shop, and a post office.
Demographics
As of the 2010 census, the population of Richfield was 1,000 people. The racial makeup of the town was 94.2% White, 0.7% African American, 0.7% Native American, 0.7% Asian, 0.7% Pacific Islander, and 2.7% from other races. The median household income was $37,500, and the median family income was $41,250.
Conclusion
Richfield is a small unincorporated community located in Fresno County, California. It is situated in the San Joaquin Valley, approximately 10 miles south of the city of Fresno. Richfield is a rural community with a population of approximately 1,000 people. The economy of Richfield is largely based on agriculture, and the main crops grown in the area are cotton, wheat, and alfalfa. The racial makeup of the town is 94.2% White, 0.7% African American, 0.7% Native American, 0.7% Asian, 0.7% Pacific Islander, and 2.7% from other races. The median household income was $37,500, and the median family income was $41,250.
Common Questions
What is Per Capita Income in Richfield?
Per Capita income in Richfield is $27,874.
What is the Median Household income in Richfield?
Median Household Income in Richfield is $23,125.
What is Inequality or Gini Index in Richfield?
Inequality or Gini Index in Richfield is 0.56.
What is the Total Population of Richfield?
Total Population of Richfield is 142.
What is the Total Male Population of Richfield?
Total Male Population of Richfield is 57.
What is the Total Female Population of Richfield?
Total Female Population of Richfield is 85.
What is the Ratio of Males per 100 Females in Richfield?
There are 67.06 Males per 100 Females in Richfield.
What is the Ratio of Females per 100 Males in Richfield?
There are 149.12 Females per 100 Males in Richfield.
What is the Median Population Age in Richfield?
Median Population Age in Richfield is 59.5 Years.
What is the Average Family Size in Richfield
Average Family Size in Richfield is 3.1 People.
What is the Average Household Size in Richfield
Average Household Size in Richfield is 2.0 People.
How Large is the Labor Force in Richfield?
There are 61 People in the Labor Forcein in Richfield.
What is the Percentage of People in the Labor Force in Richfield?
50.0% of People are in the Labor Force in Richfield.
What is the Unemployment Rate in Richfield?
Unemployment Rate in Richfield is 14.8%.