Fort Dick, CA Map & Demographics
Fort Dick Map
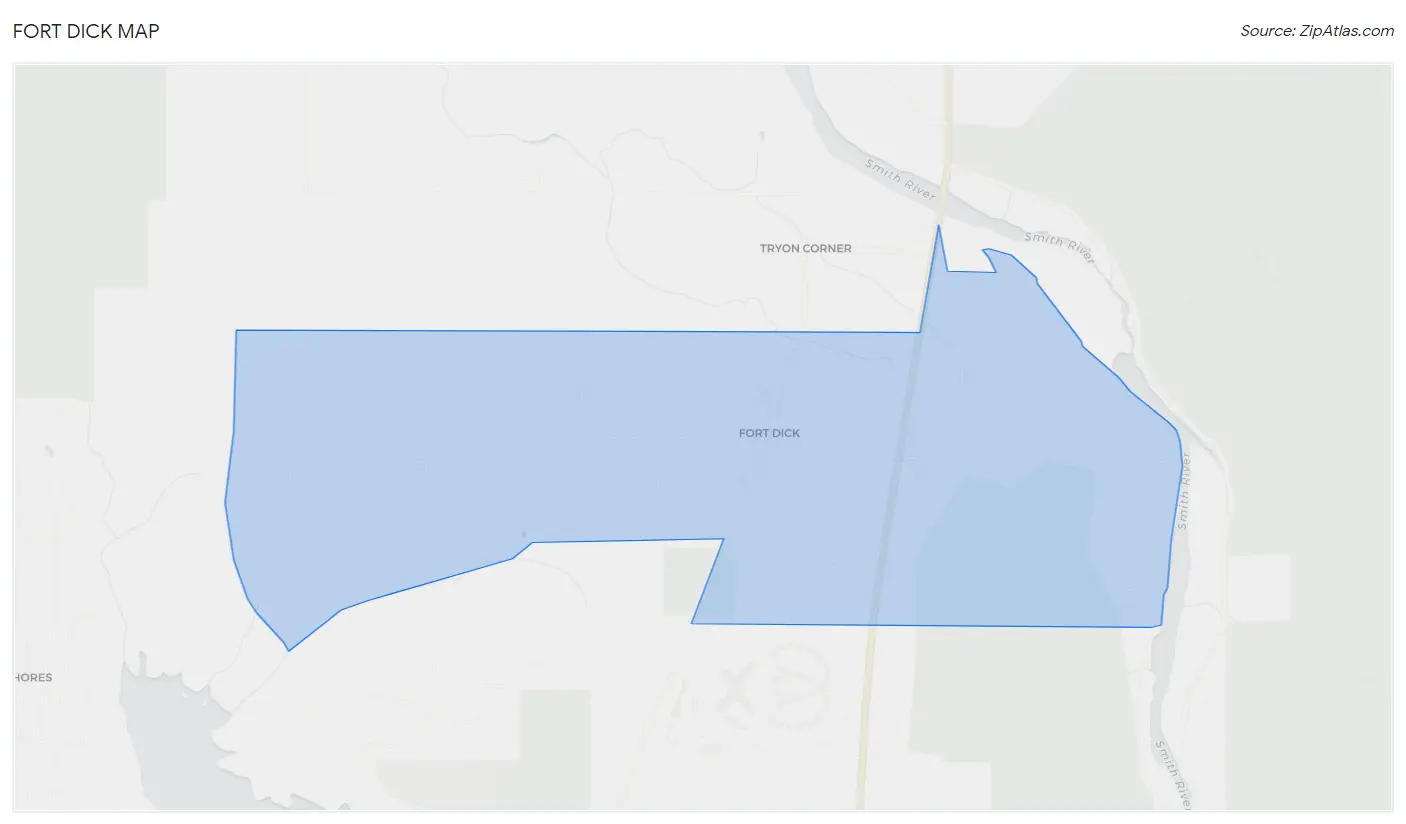
Fort Dick Overview
$33,808
PER CAPITA INCOME
$82,031
AVG FAMILY INCOME
$74,297
AVG HOUSEHOLD INCOME
32.5%
WAGE / INCOME GAP [ % ]
67.5¢/ $1
WAGE / INCOME GAP [ $ ]
0.31
INEQUALITY / GINI INDEX
1,295
TOTAL POPULATION
628
MALE POPULATION
667
FEMALE POPULATION
94.15
MALES / 100 FEMALES
106.21
FEMALES / 100 MALES
54.9
MEDIAN AGE
2.9
AVG FAMILY SIZE
2.5
AVG HOUSEHOLD SIZE
458
LABOR FORCE [ PEOPLE ]
39.9%
PERCENT IN LABOR FORCE
6.3%
UNEMPLOYMENT RATE
Fort Dick Zip Codes
Fort Dick Area Codes
Income in Fort Dick
Income Overview in Fort Dick
Per Capita Income in Fort Dick is $33,808, while median incomes of families and households are $82,031 and $74,297 respectively.
| Characteristic | Number | Measure |
| Per Capita Income | 1,295 | $33,808 |
| Median Family Income | 393 | $82,031 |
| Mean Family Income | 393 | $93,490 |
| Median Household Income | 508 | $74,297 |
| Mean Household Income | 508 | $81,802 |
| Income Deficit | 393 | $0 |
| Wage / Income Gap (%) | 1,295 | 32.54% |
| Wage / Income Gap ($) | 1,295 | 67.46¢ per $1 |
| Gini / Inequality Index | 1,295 | 0.31 |
Earnings by Sex in Fort Dick
Average Earnings in Fort Dick are $34,250, $32,688 for men and $48,456 for women, a difference of 32.5%.
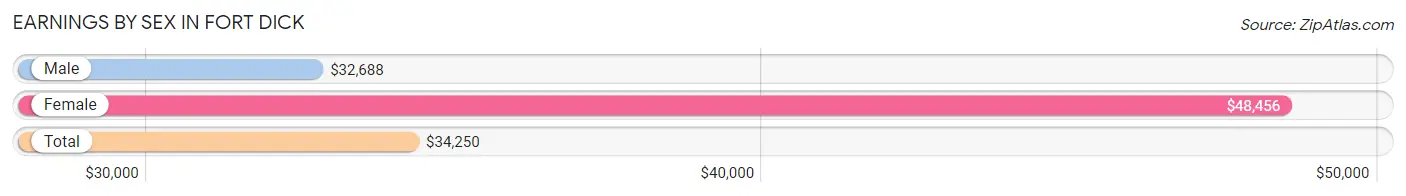
| Sex | Number | Average Earnings |
| Male | 243 (45.3%) | $32,688 |
| Female | 293 (54.7%) | $48,456 |
| Total | 536 (100.0%) | $34,250 |
Earnings by Sex by Income Bracket in Fort Dick
The most common earnings brackets in Fort Dick are $22,500 to $24,999 for men (58 | 23.9%) and $75,000 to $99,999 for women (80 | 27.3%).
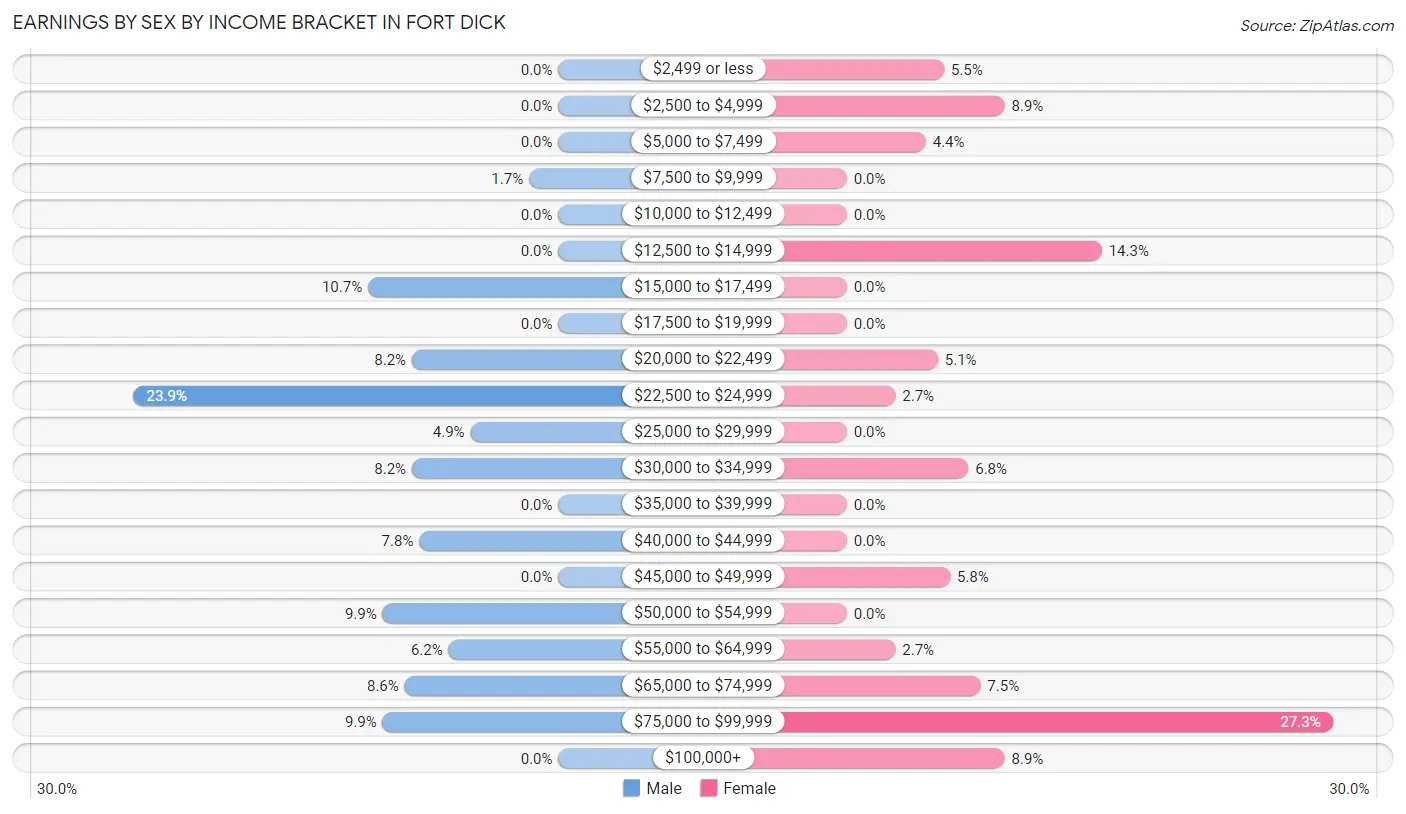
| Income | Male | Female |
| $2,499 or less | 0 (0.0%) | 16 (5.5%) |
| $2,500 to $4,999 | 0 (0.0%) | 26 (8.9%) |
| $5,000 to $7,499 | 0 (0.0%) | 13 (4.4%) |
| $7,500 to $9,999 | 4 (1.7%) | 0 (0.0%) |
| $10,000 to $12,499 | 0 (0.0%) | 0 (0.0%) |
| $12,500 to $14,999 | 0 (0.0%) | 42 (14.3%) |
| $15,000 to $17,499 | 26 (10.7%) | 0 (0.0%) |
| $17,500 to $19,999 | 0 (0.0%) | 0 (0.0%) |
| $20,000 to $22,499 | 20 (8.2%) | 15 (5.1%) |
| $22,500 to $24,999 | 58 (23.9%) | 8 (2.7%) |
| $25,000 to $29,999 | 12 (4.9%) | 0 (0.0%) |
| $30,000 to $34,999 | 20 (8.2%) | 20 (6.8%) |
| $35,000 to $39,999 | 0 (0.0%) | 0 (0.0%) |
| $40,000 to $44,999 | 19 (7.8%) | 0 (0.0%) |
| $45,000 to $49,999 | 0 (0.0%) | 17 (5.8%) |
| $50,000 to $54,999 | 24 (9.9%) | 0 (0.0%) |
| $55,000 to $64,999 | 15 (6.2%) | 8 (2.7%) |
| $65,000 to $74,999 | 21 (8.6%) | 22 (7.5%) |
| $75,000 to $99,999 | 24 (9.9%) | 80 (27.3%) |
| $100,000+ | 0 (0.0%) | 26 (8.9%) |
| Total | 243 (100.0%) | 293 (100.0%) |
Earnings by Sex by Educational Attainment in Fort Dick
Average earnings in Fort Dick are $32,688 for men and $49,412 for women, a difference of 33.9%. Men with an educational attainment of college or associate's degree enjoy the highest average annual earnings of $51,667, while those with college or associate's degree education earn the least with $51,667. Women with an educational attainment of bachelor's degree earn the most with the average annual earnings of $82,292, while those with bachelor's degree education have the smallest earnings of $82,292.
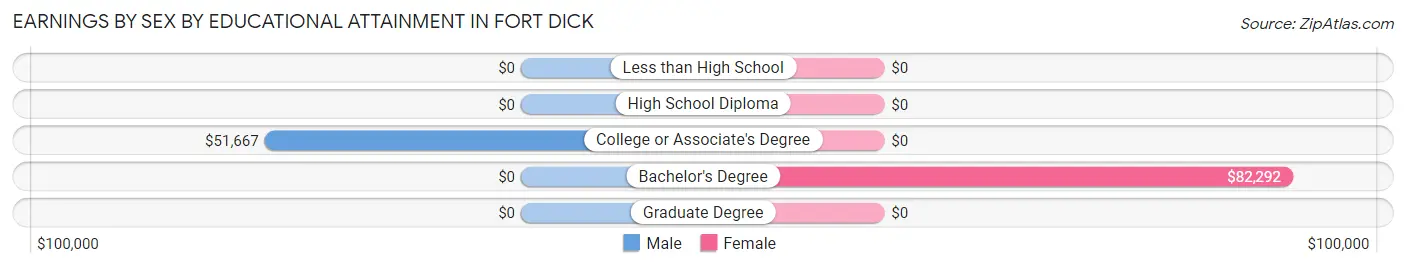
| Educational Attainment | Male Income | Female Income |
| Less than High School | - | - |
| High School Diploma | - | - |
| College or Associate's Degree | $51,667 | $0 |
| Bachelor's Degree | - | - |
| Graduate Degree | - | - |
| Total | $32,688 | $49,412 |
Family Income in Fort Dick
Family Income Brackets in Fort Dick
According to the Fort Dick family income data, there are 165 families falling into the $50,000 to $74,999 income range, which is the most common income bracket and makes up 42.0% of all families.
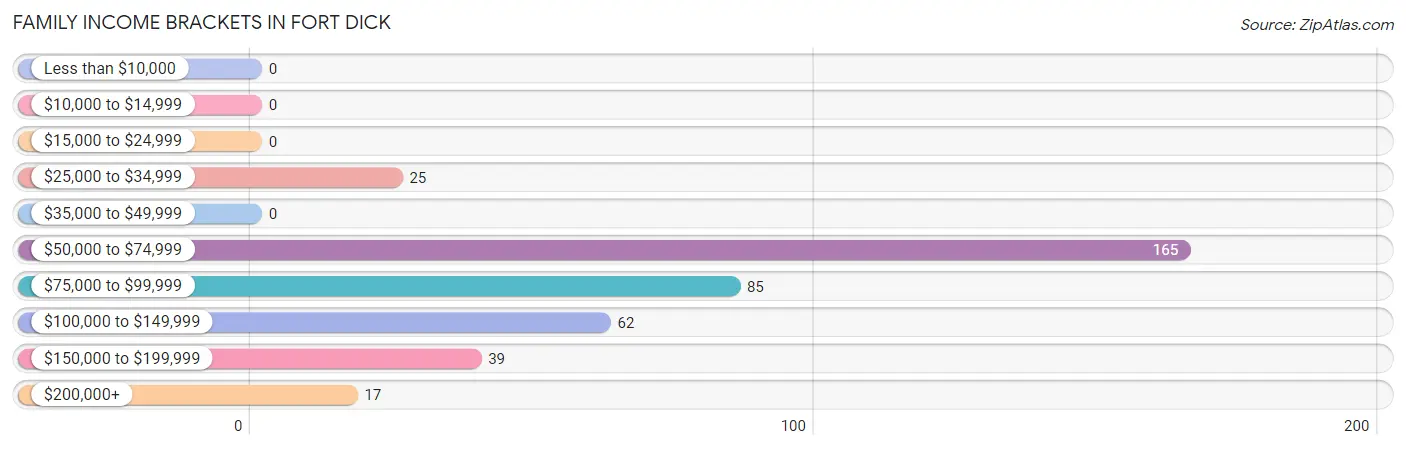
| Income Bracket | # Families | % Families |
| Less than $10,000 | 0 | 0.0% |
| $10,000 to $14,999 | 0 | 0.0% |
| $15,000 to $24,999 | 0 | 0.0% |
| $25,000 to $34,999 | 25 | 6.4% |
| $35,000 to $49,999 | 0 | 0.0% |
| $50,000 to $74,999 | 165 | 42.0% |
| $75,000 to $99,999 | 85 | 21.6% |
| $100,000 to $149,999 | 62 | 15.8% |
| $150,000 to $199,999 | 39 | 9.9% |
| $200,000+ | 17 | 4.3% |
Family Income by Famaliy Size in Fort Dick
4-person families (100 | 25.5%) account for the highest median family income in Fort Dick with $150,577 per family, while 4-person families (100 | 25.5%) have the highest median income of $37,644 per family member.
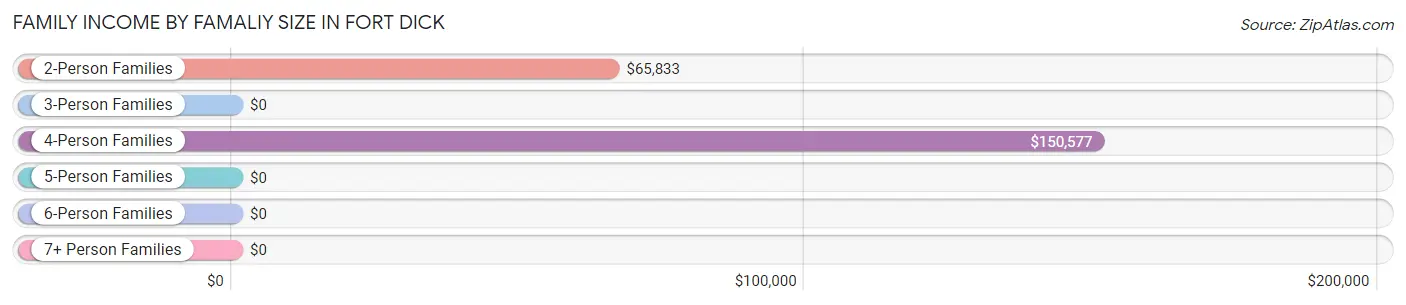
| Income Bracket | # Families | Median Income |
| 2-Person Families | 230 (58.5%) | $65,833 |
| 3-Person Families | 52 (13.2%) | $0 |
| 4-Person Families | 100 (25.5%) | $150,577 |
| 5-Person Families | 0 (0.0%) | $0 |
| 6-Person Families | 11 (2.8%) | $0 |
| 7+ Person Families | 0 (0.0%) | $0 |
| Total | 393 (100.0%) | $82,031 |
Family Income by Number of Earners in Fort Dick
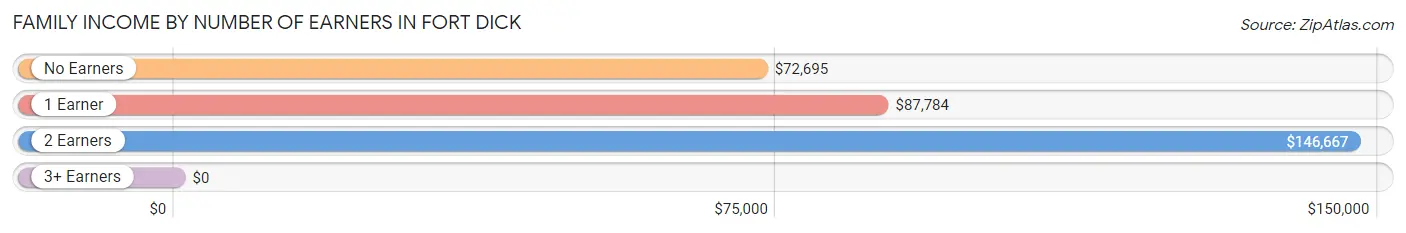
| Number of Earners | # Families | Median Income |
| No Earners | 167 (42.5%) | $72,695 |
| 1 Earner | 39 (9.9%) | $87,784 |
| 2 Earners | 120 (30.5%) | $146,667 |
| 3+ Earners | 67 (17.1%) | $0 |
| Total | 393 (100.0%) | $82,031 |
Household Income in Fort Dick
Household Income Brackets in Fort Dick
With 165 households falling in the category, the $50,000 to $74,999 income range is the most frequent in Fort Dick, accounting for 32.5% of all households.
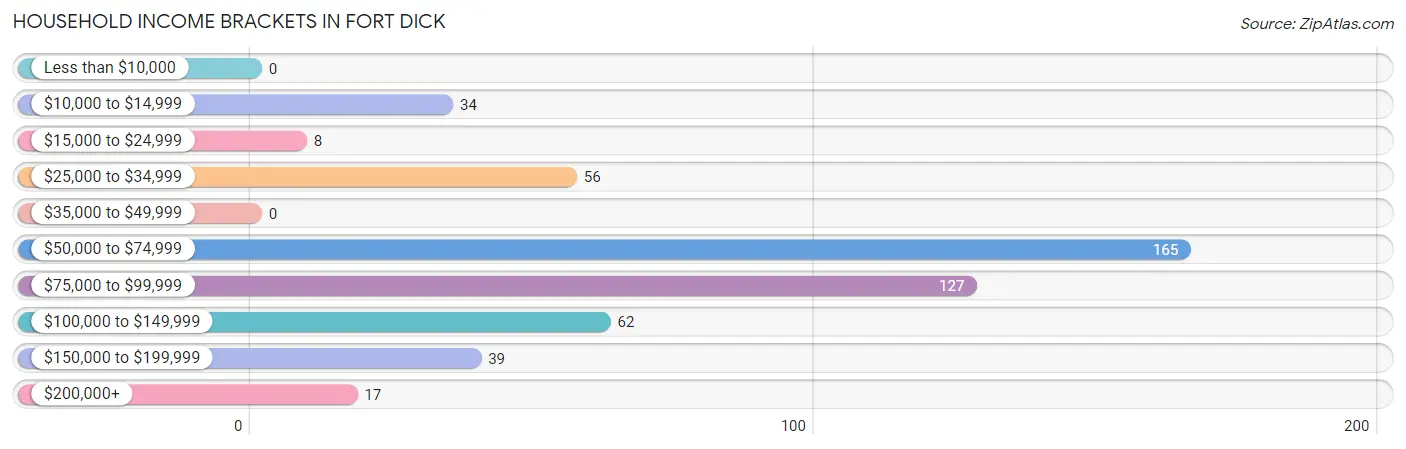
| Income Bracket | # Households | % Households |
| Less than $10,000 | 0 | 0.0% |
| $10,000 to $14,999 | 34 | 6.7% |
| $15,000 to $24,999 | 8 | 1.6% |
| $25,000 to $34,999 | 56 | 11.0% |
| $35,000 to $49,999 | 0 | 0.0% |
| $50,000 to $74,999 | 165 | 32.5% |
| $75,000 to $99,999 | 127 | 25.0% |
| $100,000 to $149,999 | 62 | 12.2% |
| $150,000 to $199,999 | 39 | 7.7% |
| $200,000+ | 17 | 3.3% |
Household Income by Householder Age in Fort Dick
The median household income in Fort Dick is $74,297, with the highest median household income of $150,192 found in the 25 to 44 years age bracket for the primary householder. A total of 48 households (9.5%) fall into this category.
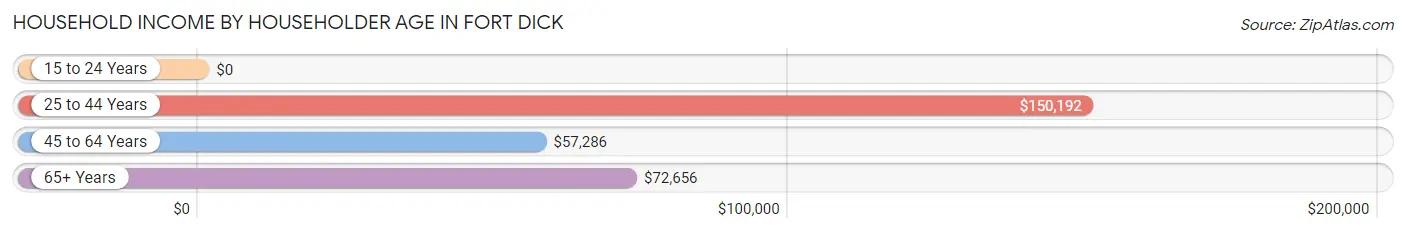
| Income Bracket | # Households | Median Income |
| 15 to 24 Years | 0 (0.0%) | $0 |
| 25 to 44 Years | 48 (9.5%) | $150,192 |
| 45 to 64 Years | 244 (48.0%) | $57,286 |
| 65+ Years | 216 (42.5%) | $72,656 |
| Total | 508 (100.0%) | $74,297 |
Poverty in Fort Dick
Income Below Poverty by Sex and Age in Fort Dick
With 11.6% poverty level for males and 7.6% for females among the residents of Fort Dick, 45 to 54 year old males and 55 to 64 year old females are the most vulnerable to poverty, with 73 males (49.0%) and 34 females (35.0%) in their respective age groups living below the poverty level.
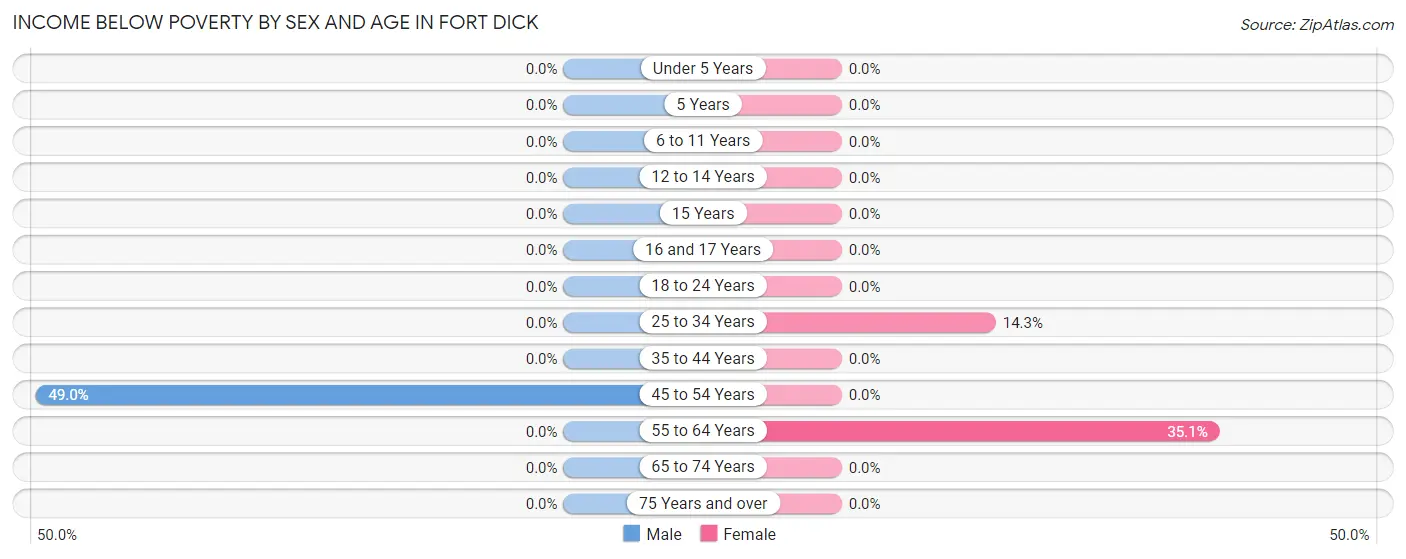
| Age Bracket | Male | Female |
| Under 5 Years | 0 (0.0%) | 0 (0.0%) |
| 5 Years | 0 (0.0%) | 0 (0.0%) |
| 6 to 11 Years | 0 (0.0%) | 0 (0.0%) |
| 12 to 14 Years | 0 (0.0%) | 0 (0.0%) |
| 15 Years | 0 (0.0%) | 0 (0.0%) |
| 16 and 17 Years | 0 (0.0%) | 0 (0.0%) |
| 18 to 24 Years | 0 (0.0%) | 0 (0.0%) |
| 25 to 34 Years | 0 (0.0%) | 17 (14.3%) |
| 35 to 44 Years | 0 (0.0%) | 0 (0.0%) |
| 45 to 54 Years | 73 (49.0%) | 0 (0.0%) |
| 55 to 64 Years | 0 (0.0%) | 34 (35.0%) |
| 65 to 74 Years | 0 (0.0%) | 0 (0.0%) |
| 75 Years and over | 0 (0.0%) | 0 (0.0%) |
| Total | 73 (11.6%) | 51 (7.6%) |
Income Above Poverty by Sex and Age in Fort Dick
According to the poverty statistics in Fort Dick, males aged under 5 years and females aged under 5 years are the age groups that are most secure financially, with 100.0% of males and 100.0% of females in these age groups living above the poverty line.
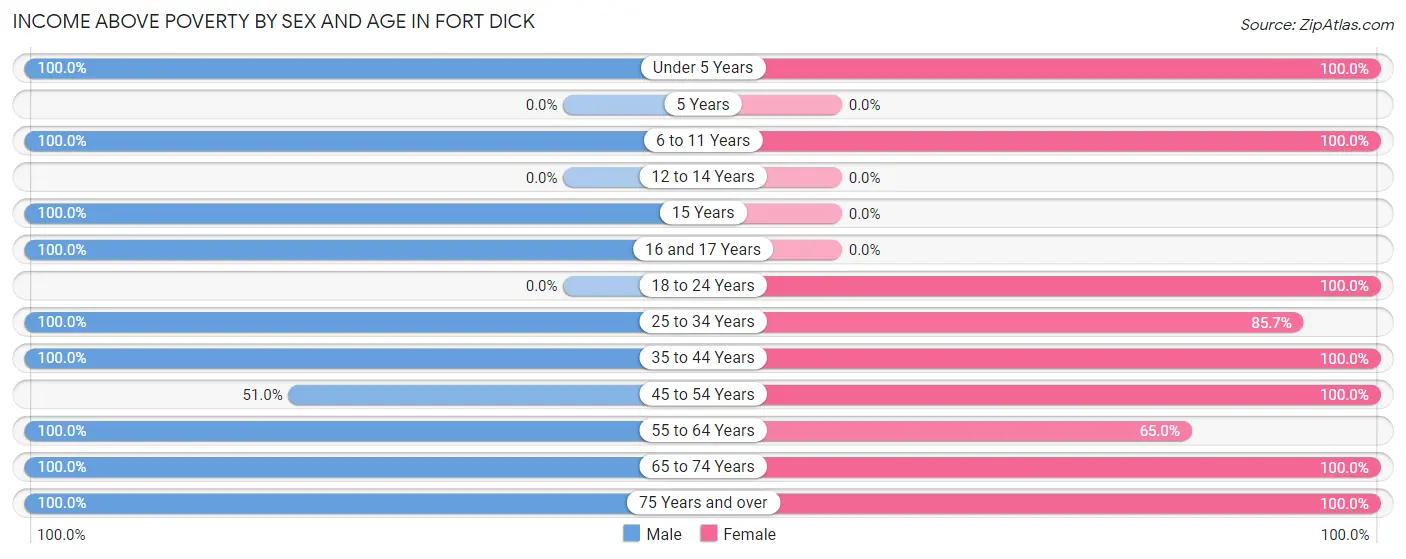
| Age Bracket | Male | Female |
| Under 5 Years | 17 (100.0%) | 21 (100.0%) |
| 5 Years | 0 (0.0%) | 0 (0.0%) |
| 6 to 11 Years | 19 (100.0%) | 55 (100.0%) |
| 12 to 14 Years | 0 (0.0%) | 0 (0.0%) |
| 15 Years | 35 (100.0%) | 0 (0.0%) |
| 16 and 17 Years | 10 (100.0%) | 0 (0.0%) |
| 18 to 24 Years | 0 (0.0%) | 13 (100.0%) |
| 25 to 34 Years | 35 (100.0%) | 102 (85.7%) |
| 35 to 44 Years | 45 (100.0%) | 48 (100.0%) |
| 45 to 54 Years | 76 (51.0%) | 83 (100.0%) |
| 55 to 64 Years | 87 (100.0%) | 63 (64.9%) |
| 65 to 74 Years | 73 (100.0%) | 51 (100.0%) |
| 75 Years and over | 158 (100.0%) | 180 (100.0%) |
| Total | 555 (88.4%) | 616 (92.3%) |
Income Below Poverty Among Married-Couple Families in Fort Dick
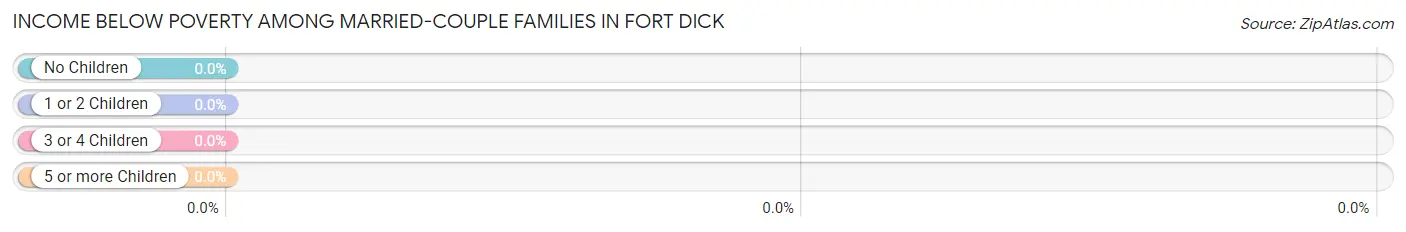
| Children | Above Poverty | Below Poverty |
| No Children | 253 (100.0%) | 0 (0.0%) |
| 1 or 2 Children | 48 (100.0%) | 0 (0.0%) |
| 3 or 4 Children | 11 (100.0%) | 0 (0.0%) |
| 5 or more Children | 0 (0.0%) | 0 (0.0%) |
| Total | 312 (100.0%) | 0 (0.0%) |
Income Below Poverty Among Single-Parent Households in Fort Dick
| Children | Single Father | Single Mother |
| No Children | 0 (0.0%) | 0 (0.0%) |
| 1 or 2 Children | 0 (0.0%) | 0 (0.0%) |
| 3 or 4 Children | 0 (0.0%) | 0 (0.0%) |
| 5 or more Children | 0 (0.0%) | 0 (0.0%) |
| Total | 0 (0.0%) | 0 (0.0%) |
Income Below Poverty Among Married-Couple vs Single-Parent Households in Fort Dick
| Children | Married-Couple Families | Single-Parent Households |
| No Children | 0 (0.0%) | 0 (0.0%) |
| 1 or 2 Children | 0 (0.0%) | 0 (0.0%) |
| 3 or 4 Children | 0 (0.0%) | 0 (0.0%) |
| 5 or more Children | 0 (0.0%) | 0 (0.0%) |
| Total | 0 (0.0%) | 0 (0.0%) |
Race in Fort Dick
The most populous races in Fort Dick are White / Caucasian (993 | 76.7%), Hispanic or Latino (142 | 11.0%), and Asian (113 | 8.7%).
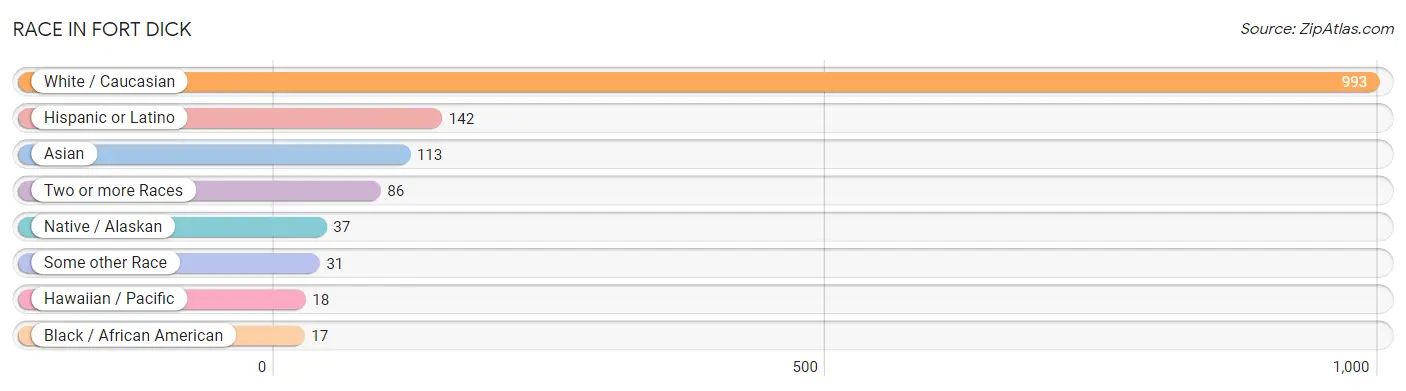
| Race | # Population | % Population |
| Asian | 113 | 8.7% |
| Black / African American | 17 | 1.3% |
| Hawaiian / Pacific | 18 | 1.4% |
| Hispanic or Latino | 142 | 11.0% |
| Native / Alaskan | 37 | 2.9% |
| White / Caucasian | 993 | 76.7% |
| Two or more Races | 86 | 6.6% |
| Some other Race | 31 | 2.4% |
| Total | 1,295 | 100.0% |
Ancestry in Fort Dick
The most populous ancestries reported in Fort Dick are English (222 | 17.1%), Burmese (113 | 8.7%), American (109 | 8.4%), Portuguese (101 | 7.8%), and German (86 | 6.6%), together accounting for 48.7% of all Fort Dick residents.
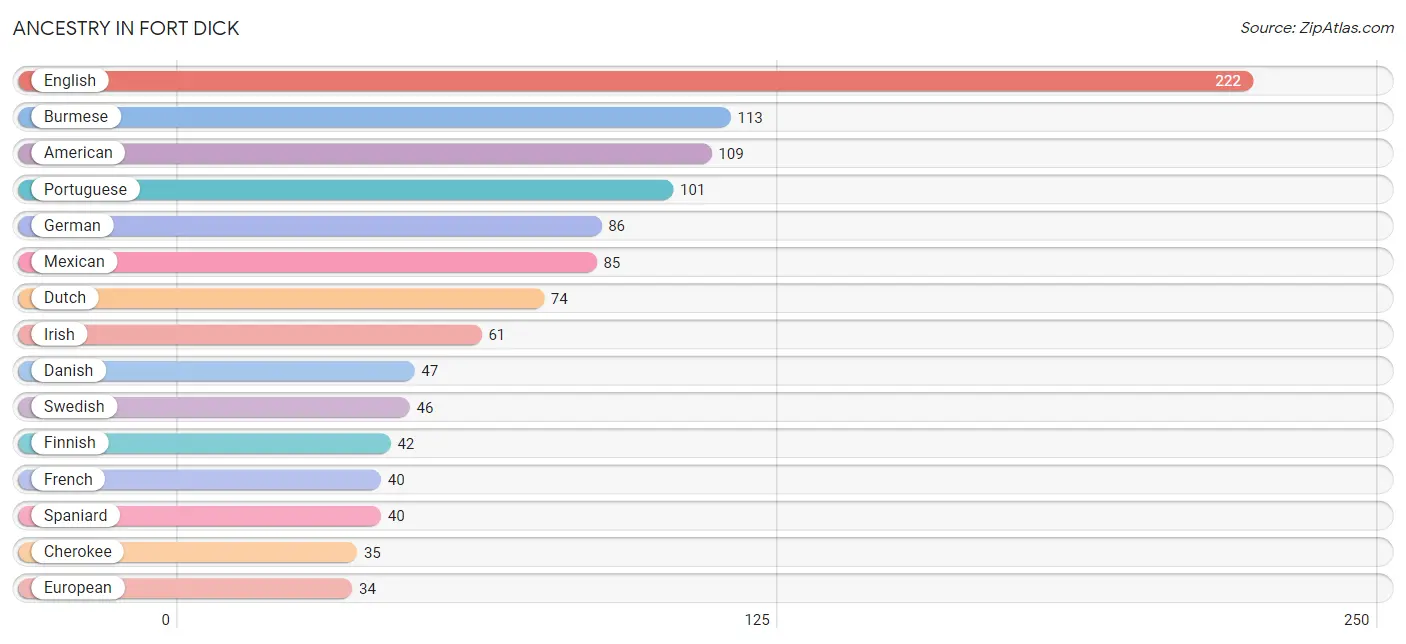
| Ancestry | # Population | % Population |
| American | 109 | 8.4% |
| Austrian | 4 | 0.3% |
| Blackfeet | 25 | 1.9% |
| Burmese | 113 | 8.7% |
| Cherokee | 35 | 2.7% |
| Czechoslovakian | 5 | 0.4% |
| Danish | 47 | 3.6% |
| Dutch | 74 | 5.7% |
| English | 222 | 17.1% |
| European | 34 | 2.6% |
| Finnish | 42 | 3.2% |
| French | 40 | 3.1% |
| German | 86 | 6.6% |
| Hungarian | 32 | 2.5% |
| Irish | 61 | 4.7% |
| Italian | 29 | 2.2% |
| Mexican | 85 | 6.6% |
| Mexican American Indian | 12 | 0.9% |
| Portuguese | 101 | 7.8% |
| Puerto Rican | 17 | 1.3% |
| Samoan | 18 | 1.4% |
| Scotch-Irish | 10 | 0.8% |
| Spaniard | 40 | 3.1% |
| Swedish | 46 | 3.5% | View All 24 Rows |
Immigrants in Fort Dick
The most numerous immigrant groups reported in Fort Dick came from Asia (55 | 4.3%), Eastern Asia (37 | 2.9%), Korea (37 | 2.9%), Philippines (18 | 1.4%), and South Eastern Asia (18 | 1.4%), together accounting for 12.8% of all Fort Dick residents.
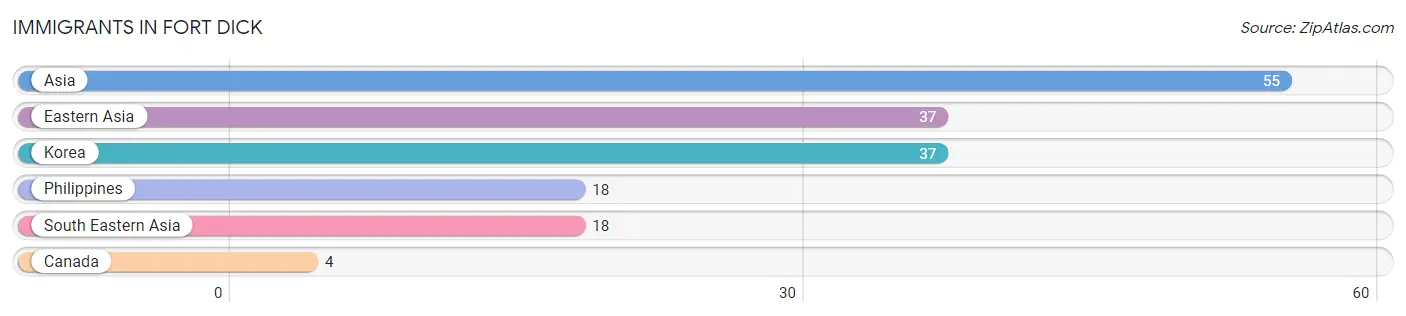
| Immigration Origin | # Population | % Population |
| Asia | 55 | 4.3% |
| Canada | 4 | 0.3% |
| Eastern Asia | 37 | 2.9% |
| Korea | 37 | 2.9% |
| Philippines | 18 | 1.4% |
| South Eastern Asia | 18 | 1.4% | View All 6 Rows |
Sex and Age in Fort Dick
Sex and Age in Fort Dick
The most populous age groups in Fort Dick are 75 to 79 Years (86 | 13.7%) for men and 75 to 79 Years (99 | 14.8%) for women.
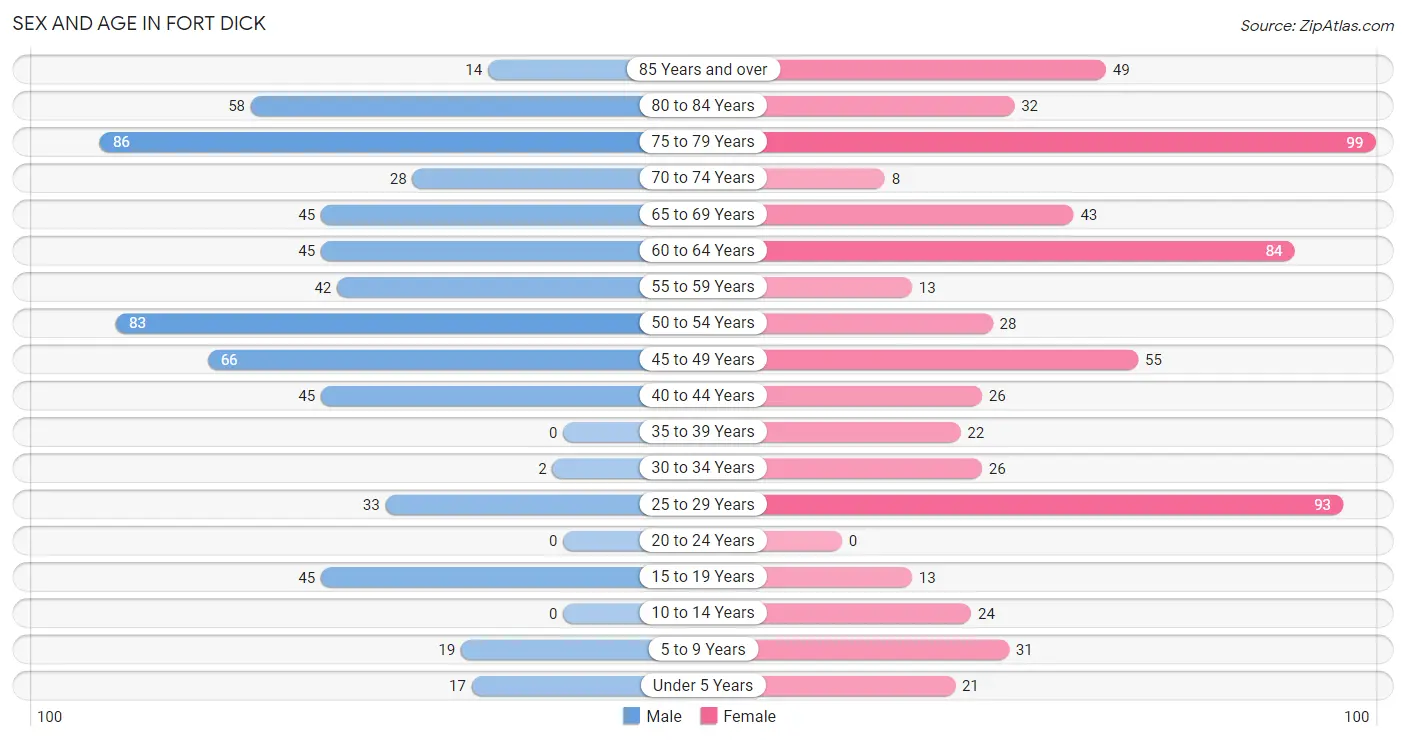
| Age Bracket | Male | Female |
| Under 5 Years | 17 (2.7%) | 21 (3.2%) |
| 5 to 9 Years | 19 (3.0%) | 31 (4.6%) |
| 10 to 14 Years | 0 (0.0%) | 24 (3.6%) |
| 15 to 19 Years | 45 (7.2%) | 13 (1.9%) |
| 20 to 24 Years | 0 (0.0%) | 0 (0.0%) |
| 25 to 29 Years | 33 (5.2%) | 93 (13.9%) |
| 30 to 34 Years | 2 (0.3%) | 26 (3.9%) |
| 35 to 39 Years | 0 (0.0%) | 22 (3.3%) |
| 40 to 44 Years | 45 (7.2%) | 26 (3.9%) |
| 45 to 49 Years | 66 (10.5%) | 55 (8.3%) |
| 50 to 54 Years | 83 (13.2%) | 28 (4.2%) |
| 55 to 59 Years | 42 (6.7%) | 13 (1.9%) |
| 60 to 64 Years | 45 (7.2%) | 84 (12.6%) |
| 65 to 69 Years | 45 (7.2%) | 43 (6.5%) |
| 70 to 74 Years | 28 (4.5%) | 8 (1.2%) |
| 75 to 79 Years | 86 (13.7%) | 99 (14.8%) |
| 80 to 84 Years | 58 (9.2%) | 32 (4.8%) |
| 85 Years and over | 14 (2.2%) | 49 (7.3%) |
| Total | 628 (100.0%) | 667 (100.0%) |
Families and Households in Fort Dick
Median Family Size in Fort Dick
The median family size in Fort Dick is 2.85 persons per family, with married-couple families (312 | 79.4%) accounting for the largest median family size of 3.07 persons per family. On the other hand, single male/father families (49 | 12.5%) represent the smallest median family size with 1.92 persons per family.
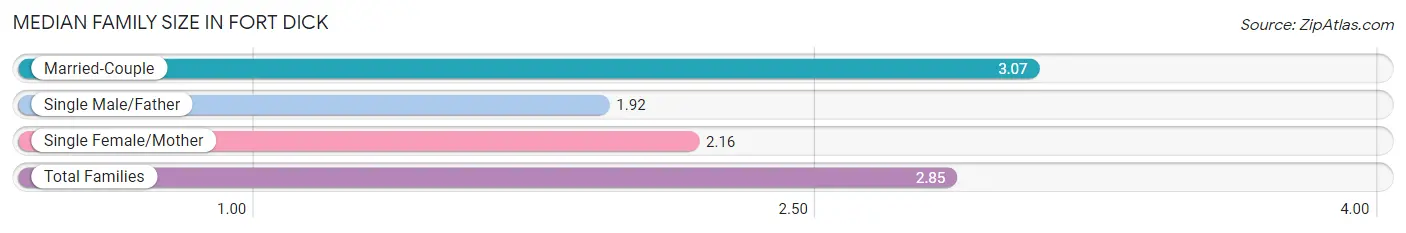
| Family Type | # Families | Family Size |
| Married-Couple | 312 (79.4%) | 3.07 |
| Single Male/Father | 49 (12.5%) | 1.92 |
| Single Female/Mother | 32 (8.1%) | 2.16 |
| Total Families | 393 (100.0%) | 2.85 |
Median Household Size in Fort Dick
The median household size in Fort Dick is 2.55 persons per household, with married-couple households (312 | 61.4%) accounting for the largest median household size of 3.07 persons per household. non-family households (115 | 22.6%) represent the smallest median household size with 1.51 persons per household.
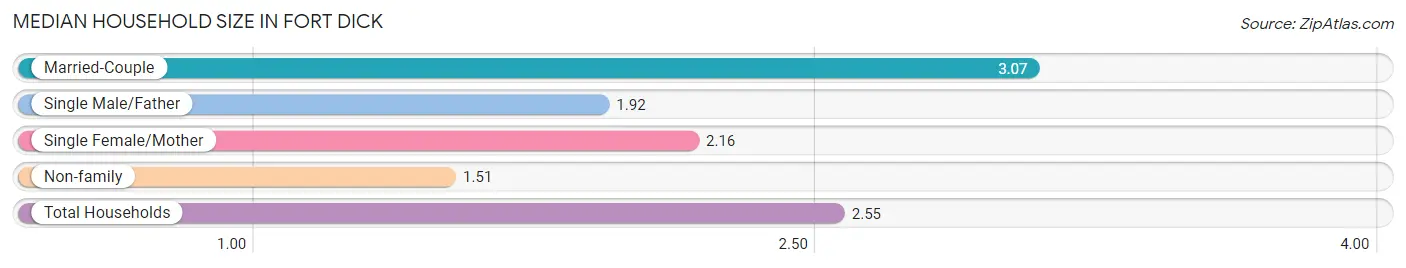
| Household Type | # Households | Household Size |
| Married-Couple | 312 (61.4%) | 3.07 |
| Single Male/Father | 49 (9.7%) | 1.92 |
| Single Female/Mother | 32 (6.3%) | 2.16 |
| Non-family | 115 (22.6%) | 1.51 |
| Total Households | 508 (100.0%) | 2.55 |
Household Size by Marriage Status in Fort Dick
Out of a total of 508 households in Fort Dick, 393 (77.4%) are family households, while 115 (22.6%) are nonfamily households. The most numerous type of family households are 2-person households, comprising 230, and the most common type of nonfamily households are 2-person households, comprising 65.
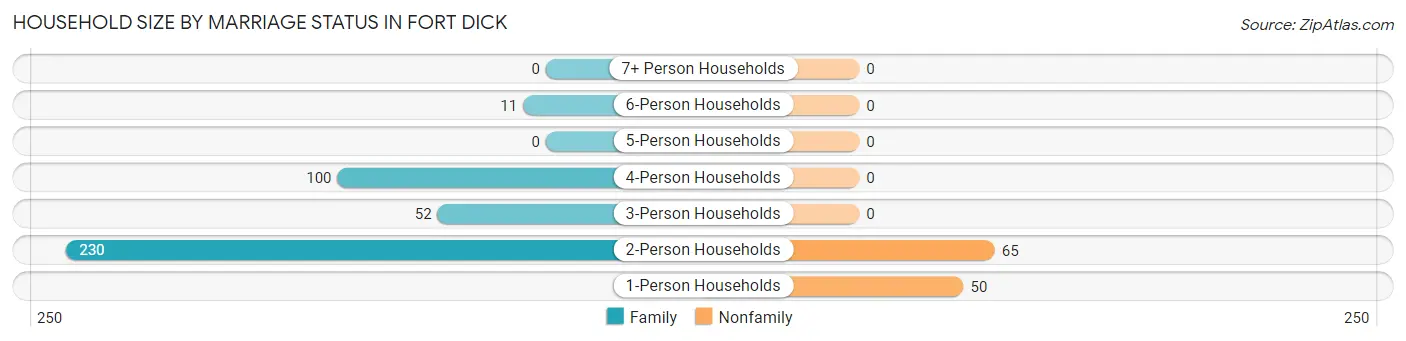
| Household Size | Family Households | Nonfamily Households |
| 1-Person Households | - | 50 (9.8%) |
| 2-Person Households | 230 (45.3%) | 65 (12.8%) |
| 3-Person Households | 52 (10.2%) | 0 (0.0%) |
| 4-Person Households | 100 (19.7%) | 0 (0.0%) |
| 5-Person Households | 0 (0.0%) | 0 (0.0%) |
| 6-Person Households | 11 (2.2%) | 0 (0.0%) |
| 7+ Person Households | 0 (0.0%) | 0 (0.0%) |
| Total | 393 (77.4%) | 115 (22.6%) |
Female Fertility in Fort Dick
Fertility by Age in Fort Dick
| Age Bracket | Women with Births | Births / 1,000 Women |
| 15 to 19 years | 0 (0.0%) | 0.0 |
| 20 to 34 years | 0 (0.0%) | 0.0 |
| 35 to 50 years | 0 (0.0%) | 0.0 |
| Total | 0 (0.0%) | 0.0 |
Fertility by Age by Marriage Status in Fort Dick
| Age Bracket | Married | Unmarried |
| 15 to 19 years | 0 (0.0%) | 0 (0.0%) |
| 20 to 34 years | 0 (0.0%) | 0 (0.0%) |
| 35 to 50 years | 0 (0.0%) | 0 (0.0%) |
| Total | 0 (0.0%) | 0 (0.0%) |
Fertility by Education in Fort Dick
| Educational Attainment | Women with Births | Births / 1,000 Women |
| Less than High School | 0 (0.0%) | 0.0 |
| High School Diploma | 0 (0.0%) | 0.0 |
| College or Associate's Degree | 0 (0.0%) | 0.0 |
| Bachelor's Degree | 0 (0.0%) | 0.0 |
| Graduate Degree | 0 (0.0%) | 0.0 |
| Total | 0 (0.0%) | 0.0 |
Fertility by Education by Marriage Status in Fort Dick
| Educational Attainment | Married | Unmarried |
| Less than High School | 0 (0.0%) | 0 (0.0%) |
| High School Diploma | 0 (0.0%) | 0 (0.0%) |
| College or Associate's Degree | 0 (0.0%) | 0 (0.0%) |
| Bachelor's Degree | 0 (0.0%) | 0 (0.0%) |
| Graduate Degree | 0 (0.0%) | 0 (0.0%) |
| Total | 0 (0.0%) | 0 (0.0%) |
Employment Characteristics in Fort Dick
Employment by Class of Employer in Fort Dick
Among the 414 employed individuals in Fort Dick, private company employees (204 | 49.3%), local government employees (78 | 18.8%), and self-employed (not incorporated) (61 | 14.7%) make up the most common classes of employment.
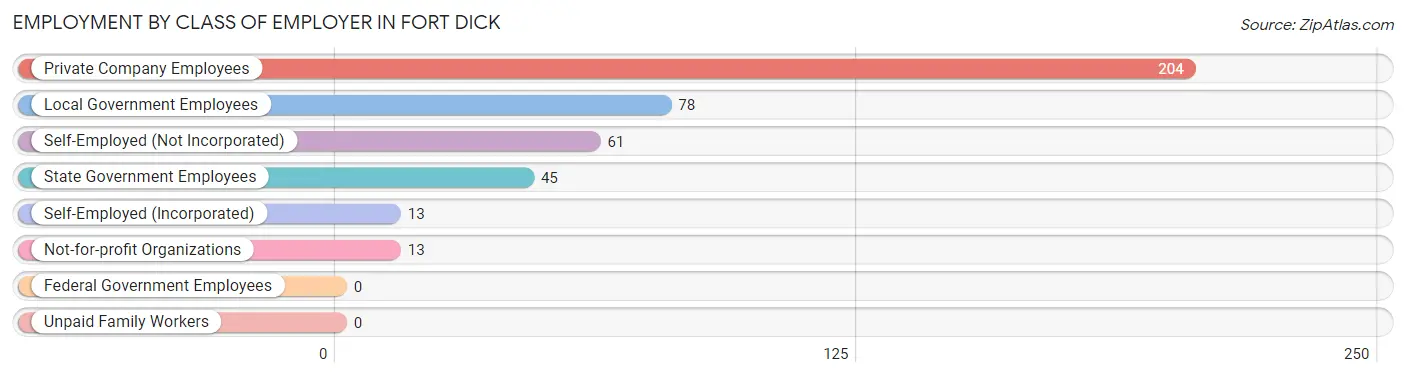
| Employer Class | # Employees | % Employees |
| Private Company Employees | 204 | 49.3% |
| Self-Employed (Incorporated) | 13 | 3.1% |
| Self-Employed (Not Incorporated) | 61 | 14.7% |
| Not-for-profit Organizations | 13 | 3.1% |
| Local Government Employees | 78 | 18.8% |
| State Government Employees | 45 | 10.9% |
| Federal Government Employees | 0 | 0.0% |
| Unpaid Family Workers | 0 | 0.0% |
| Total | 414 | 100.0% |
Employment Status by Age in Fort Dick
According to the labor force statistics for Fort Dick, out of the total population over 16 years of age (1,148), 39.9% or 458 individuals are in the labor force, with 6.3% or 29 of them unemployed. The age group with the highest labor force participation rate is 30 to 34 years, with 100.0% or 28 individuals in the labor force. Within the labor force, the 16 to 19 years age range has the highest percentage of unemployed individuals, with 100.0% or 13 of them being unemployed.
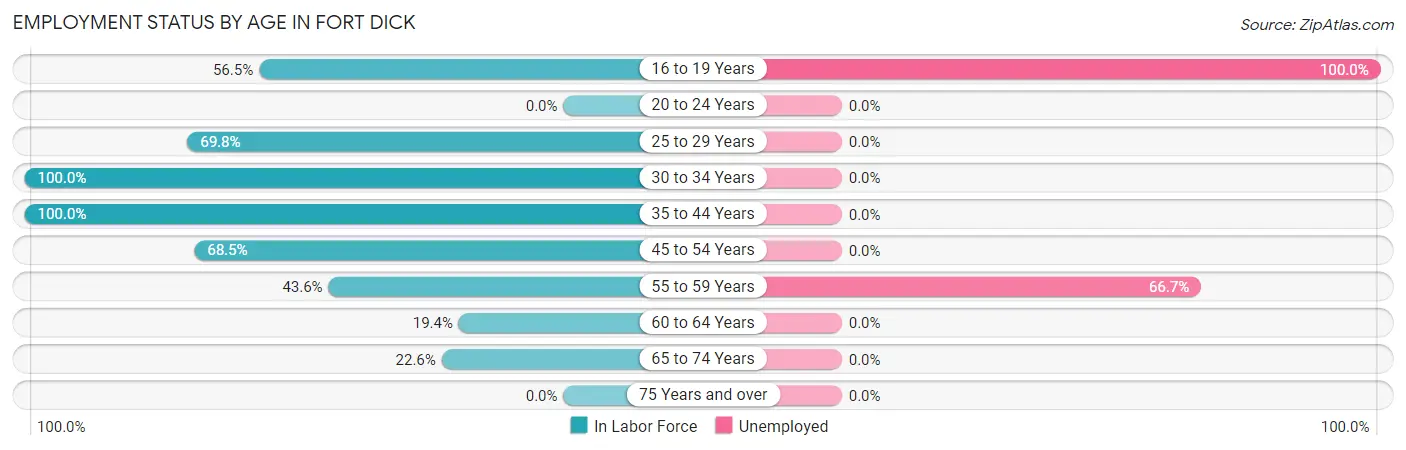
| Age Bracket | In Labor Force | Unemployed |
| 16 to 19 Years | 13 (56.5%) | 13 (100.0%) |
| 20 to 24 Years | 0 (0.0%) | 0 (0.0%) |
| 25 to 29 Years | 88 (69.8%) | 0 (0.0%) |
| 30 to 34 Years | 28 (100.0%) | 0 (0.0%) |
| 35 to 44 Years | 93 (100.0%) | 0 (0.0%) |
| 45 to 54 Years | 159 (68.5%) | 0 (0.0%) |
| 55 to 59 Years | 24 (43.6%) | 16 (66.7%) |
| 60 to 64 Years | 25 (19.4%) | 0 (0.0%) |
| 65 to 74 Years | 28 (22.6%) | 0 (0.0%) |
| 75 Years and over | 0 (0.0%) | 0 (0.0%) |
| Total | 458 (39.9%) | 29 (6.3%) |
Employment Status by Educational Attainment in Fort Dick
According to labor force statistics for Fort Dick, 62.9% of individuals (417) out of the total population between 25 and 64 years of age (663) are in the labor force, with 3.8% or 16 of them being unemployed. The group with the highest labor force participation rate are those with the educational attainment of college / associate degree, with 91.9% or 147 individuals in the labor force. Within the labor force, individuals with less than high school education have the highest percentage of unemployment, with 21.8% or 12 of them being unemployed.
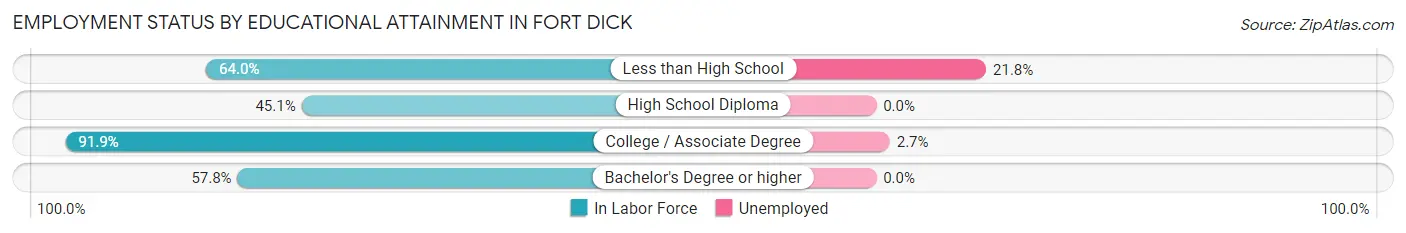
| Educational Attainment | In Labor Force | Unemployed |
| Less than High School | 55 (64.0%) | 19 (21.8%) |
| High School Diploma | 93 (45.1%) | 0 (0.0%) |
| College / Associate Degree | 147 (91.9%) | 4 (2.7%) |
| Bachelor's Degree or higher | 122 (57.8%) | 0 (0.0%) |
| Total | 417 (62.9%) | 25 (3.8%) |
Employment Occupations by Sex in Fort Dick
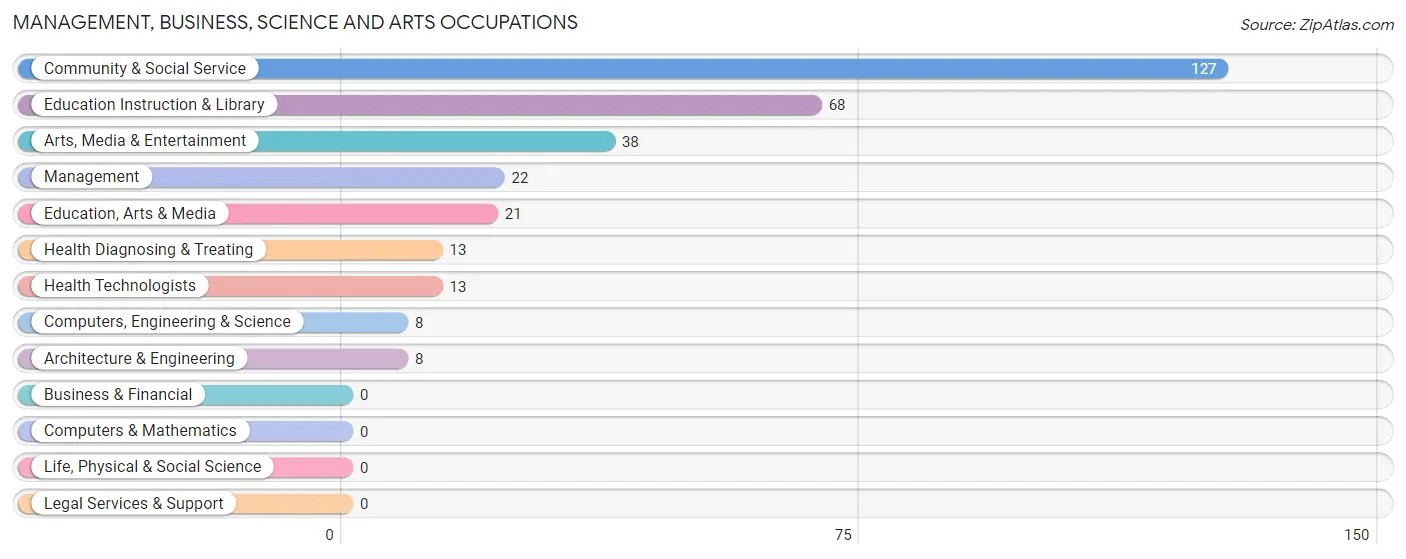
Management, Business, Science and Arts Occupations
The most common Management, Business, Science and Arts occupations in Fort Dick are Community & Social Service (127 | 29.6%), Education Instruction & Library (68 | 15.9%), Arts, Media & Entertainment (38 | 8.9%), Management (22 | 5.1%), and Education, Arts & Media (21 | 4.9%).
Management, Business, Science and Arts Occupations by Sex
Within the Management, Business, Science and Arts occupations in Fort Dick, the most male-oriented occupations are Computers, Engineering & Science (100.0%), and Architecture & Engineering (100.0%), while the most female-oriented occupations are Management (100.0%), Community & Social Service (100.0%), and Education, Arts & Media (100.0%).
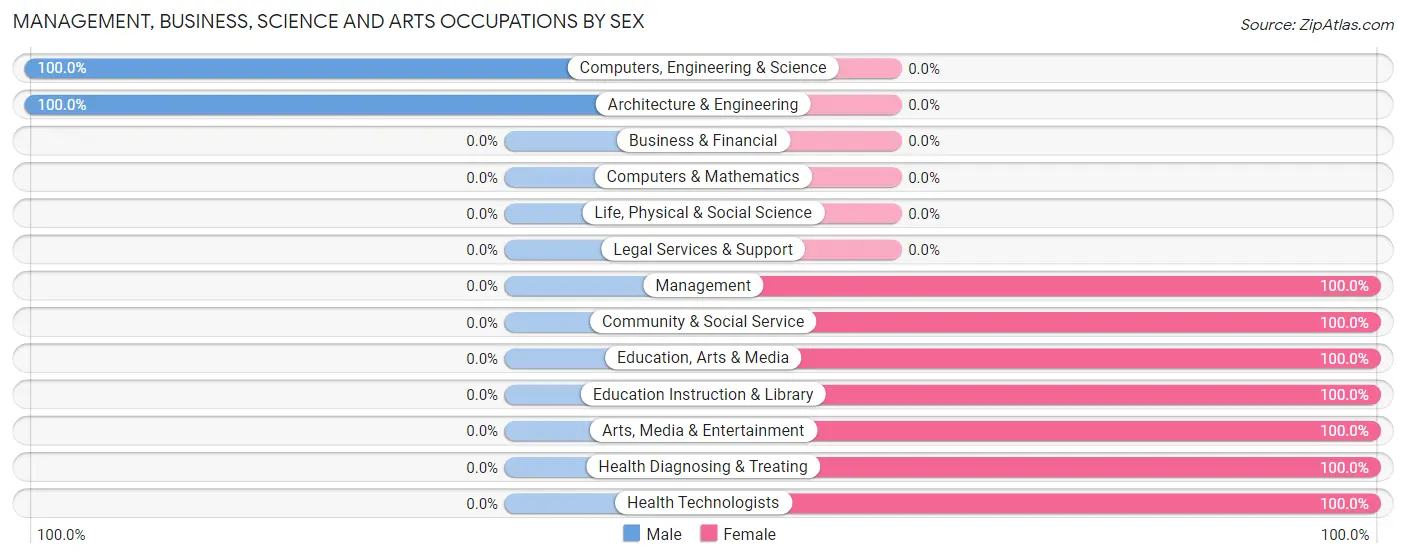
| Occupation | Male | Female |
| Management | 0 (0.0%) | 22 (100.0%) |
| Business & Financial | 0 (0.0%) | 0 (0.0%) |
| Computers, Engineering & Science | 8 (100.0%) | 0 (0.0%) |
| Computers & Mathematics | 0 (0.0%) | 0 (0.0%) |
| Architecture & Engineering | 8 (100.0%) | 0 (0.0%) |
| Life, Physical & Social Science | 0 (0.0%) | 0 (0.0%) |
| Community & Social Service | 0 (0.0%) | 127 (100.0%) |
| Education, Arts & Media | 0 (0.0%) | 21 (100.0%) |
| Legal Services & Support | 0 (0.0%) | 0 (0.0%) |
| Education Instruction & Library | 0 (0.0%) | 68 (100.0%) |
| Arts, Media & Entertainment | 0 (0.0%) | 38 (100.0%) |
| Health Diagnosing & Treating | 0 (0.0%) | 13 (100.0%) |
| Health Technologists | 0 (0.0%) | 13 (100.0%) |
| Total (Category) | 8 (4.7%) | 162 (95.3%) |
| Total (Overall) | 176 (41.0%) | 253 (59.0%) |
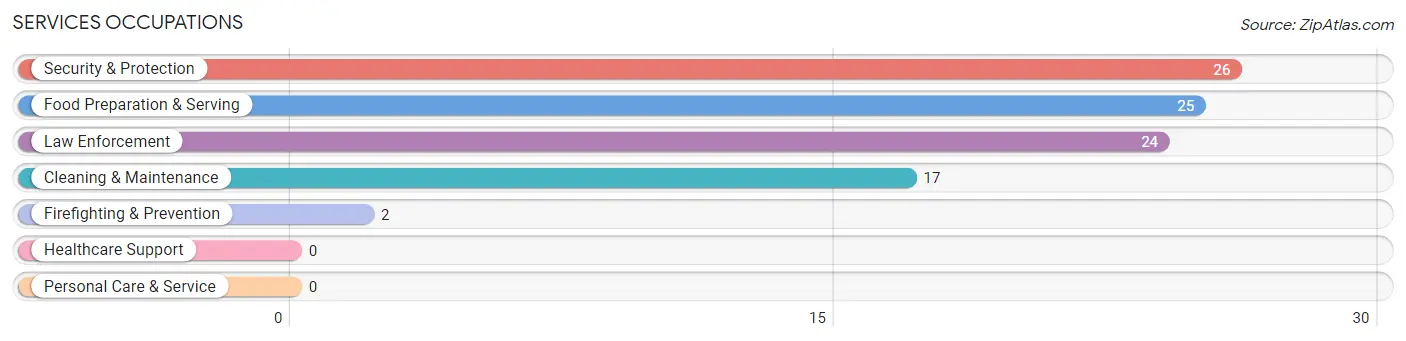
Services Occupations
The most common Services occupations in Fort Dick are Security & Protection (26 | 6.1%), Food Preparation & Serving (25 | 5.8%), Law Enforcement (24 | 5.6%), Cleaning & Maintenance (17 | 4.0%), and Firefighting & Prevention (2 | 0.5%).
Services Occupations by Sex
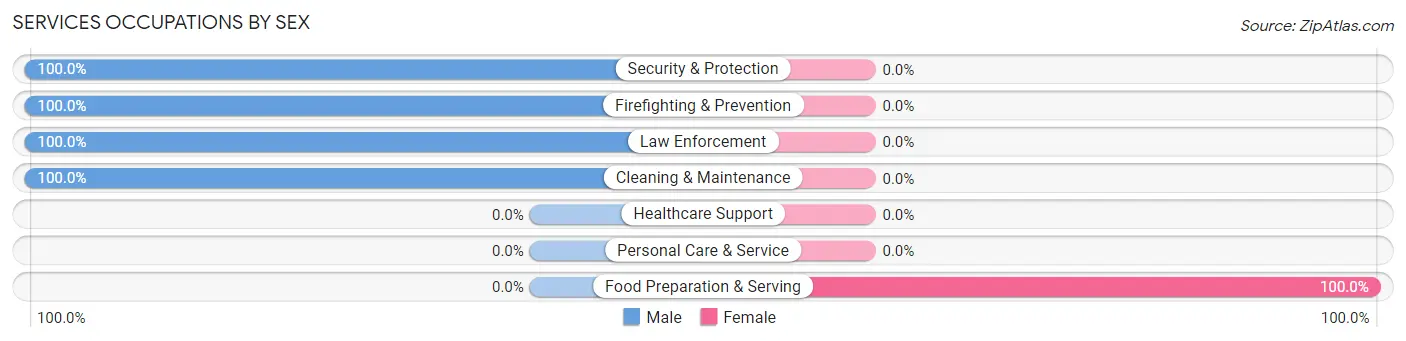
| Occupation | Male | Female |
| Healthcare Support | 0 (0.0%) | 0 (0.0%) |
| Security & Protection | 26 (100.0%) | 0 (0.0%) |
| Firefighting & Prevention | 2 (100.0%) | 0 (0.0%) |
| Law Enforcement | 24 (100.0%) | 0 (0.0%) |
| Food Preparation & Serving | 0 (0.0%) | 25 (100.0%) |
| Cleaning & Maintenance | 17 (100.0%) | 0 (0.0%) |
| Personal Care & Service | 0 (0.0%) | 0 (0.0%) |
| Total (Category) | 43 (63.2%) | 25 (36.8%) |
| Total (Overall) | 176 (41.0%) | 253 (59.0%) |
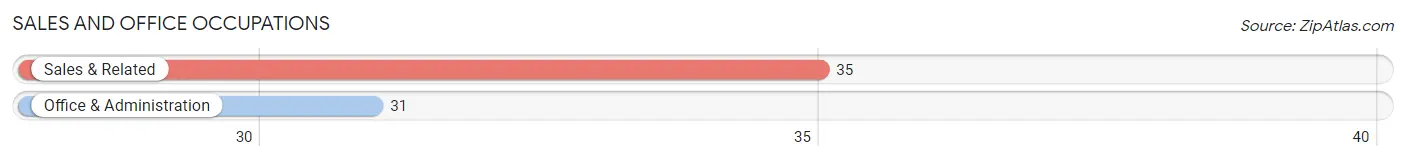
Sales and Office Occupations
The most common Sales and Office occupations in Fort Dick are Sales & Related (35 | 8.2%), and Office & Administration (31 | 7.2%).
Sales and Office Occupations by Sex
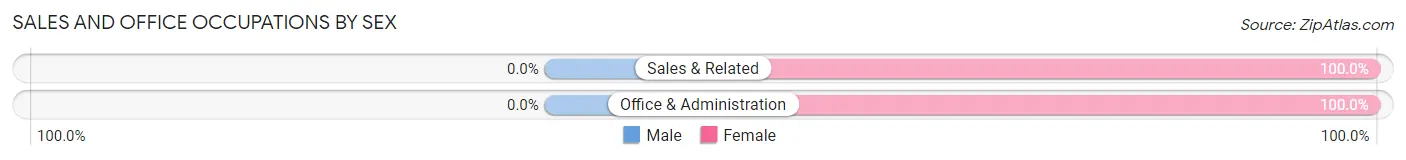
| Occupation | Male | Female |
| Sales & Related | 0 (0.0%) | 35 (100.0%) |
| Office & Administration | 0 (0.0%) | 31 (100.0%) |
| Total (Category) | 0 (0.0%) | 66 (100.0%) |
| Total (Overall) | 176 (41.0%) | 253 (59.0%) |
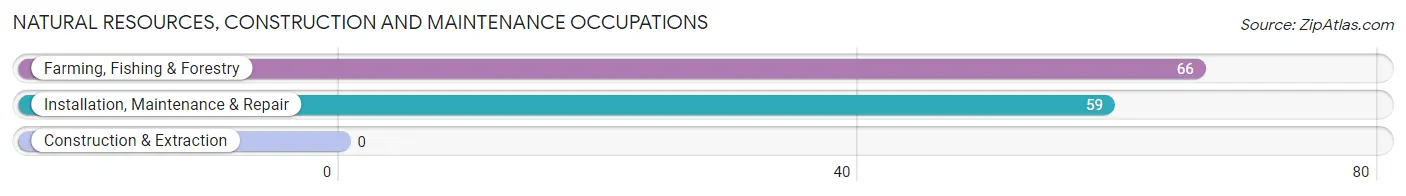
Natural Resources, Construction and Maintenance Occupations
The most common Natural Resources, Construction and Maintenance occupations in Fort Dick are Farming, Fishing & Forestry (66 | 15.4%), and Installation, Maintenance & Repair (59 | 13.8%).
Natural Resources, Construction and Maintenance Occupations by Sex
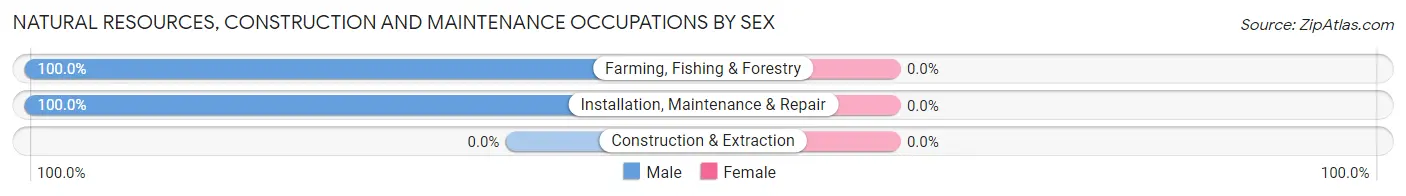
| Occupation | Male | Female |
| Farming, Fishing & Forestry | 66 (100.0%) | 0 (0.0%) |
| Construction & Extraction | 0 (0.0%) | 0 (0.0%) |
| Installation, Maintenance & Repair | 59 (100.0%) | 0 (0.0%) |
| Total (Category) | 125 (100.0%) | 0 (0.0%) |
| Total (Overall) | 176 (41.0%) | 253 (59.0%) |
Production, Transportation and Moving Occupations
Production, Transportation and Moving Occupations by Sex
| Occupation | Male | Female |
| Production | 0 (0.0%) | 0 (0.0%) |
| Transportation | 0 (0.0%) | 0 (0.0%) |
| Material Moving | 0 (0.0%) | 0 (0.0%) |
| Total (Category) | 0 (0.0%) | 0 (0.0%) |
| Total (Overall) | 176 (41.0%) | 253 (59.0%) |
Employment Industries by Sex in Fort Dick
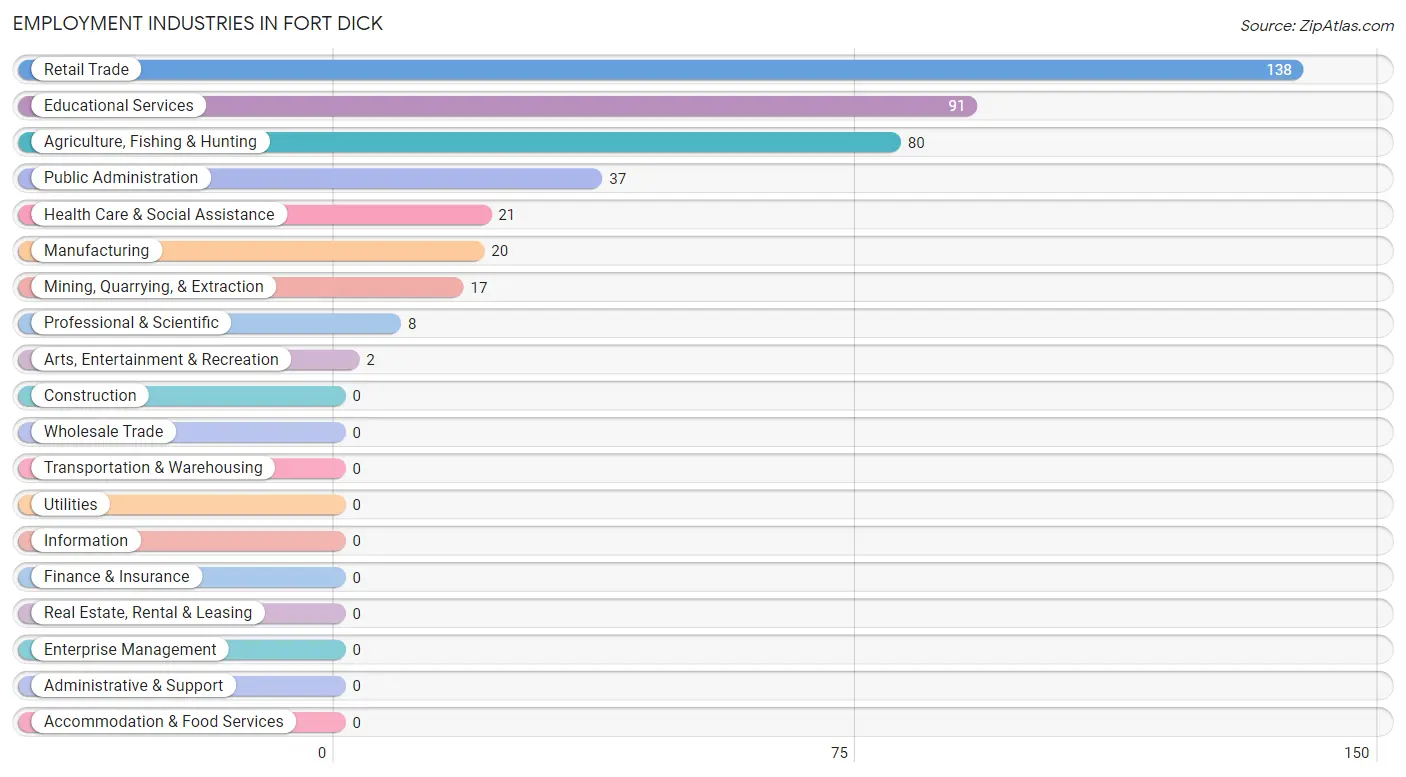
Employment Industries in Fort Dick
The major employment industries in Fort Dick include Retail Trade (138 | 32.2%), Educational Services (91 | 21.2%), Agriculture, Fishing & Hunting (80 | 18.6%), Public Administration (37 | 8.6%), and Health Care & Social Assistance (21 | 4.9%).
Employment Industries by Sex in Fort Dick
The Fort Dick industries that see more men than women are Mining, Quarrying, & Extraction (100.0%), Manufacturing (100.0%), and Professional & Scientific (100.0%), whereas the industries that tend to have a higher number of women are Educational Services (100.0%), Health Care & Social Assistance (100.0%), and Retail Trade (82.6%).
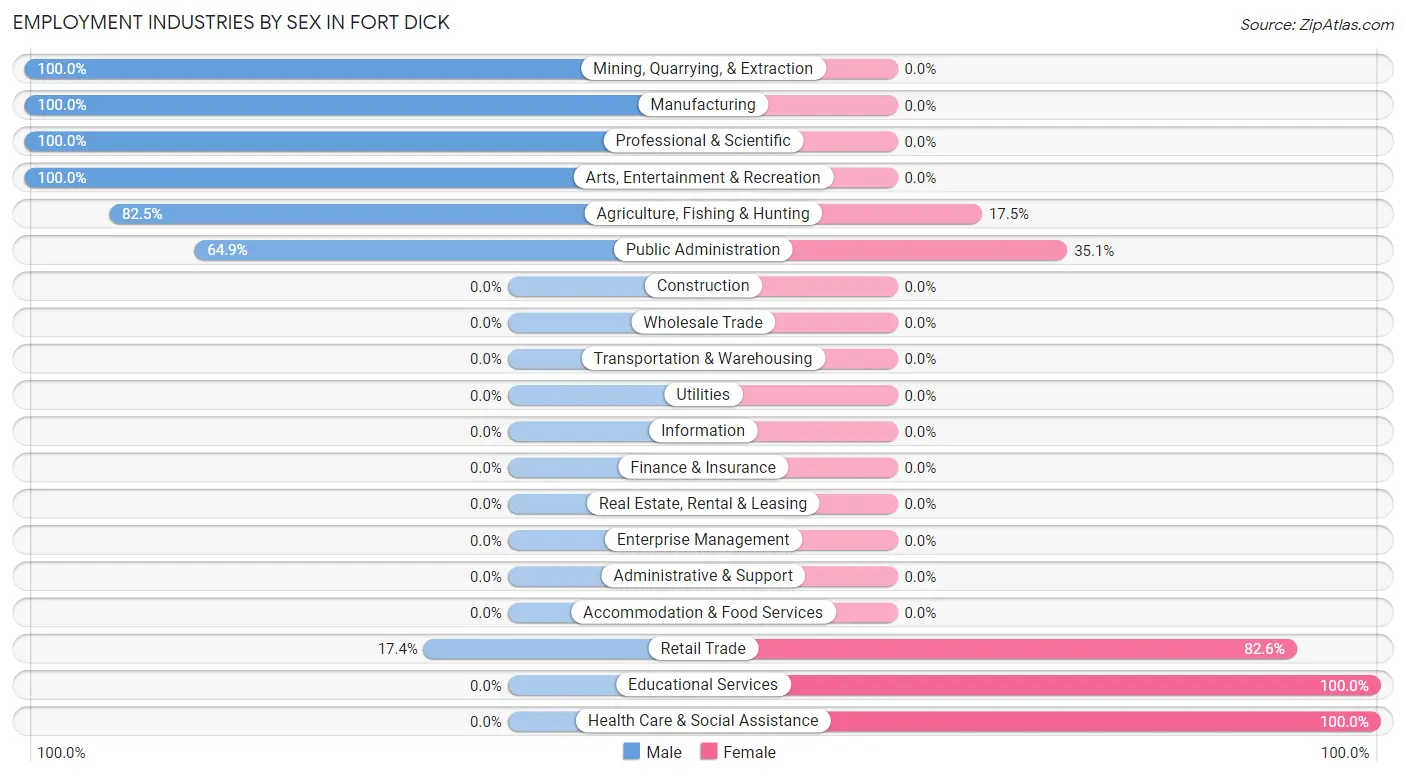
| Industry | Male | Female |
| Agriculture, Fishing & Hunting | 66 (82.5%) | 14 (17.5%) |
| Mining, Quarrying, & Extraction | 17 (100.0%) | 0 (0.0%) |
| Construction | 0 (0.0%) | 0 (0.0%) |
| Manufacturing | 20 (100.0%) | 0 (0.0%) |
| Wholesale Trade | 0 (0.0%) | 0 (0.0%) |
| Retail Trade | 24 (17.4%) | 114 (82.6%) |
| Transportation & Warehousing | 0 (0.0%) | 0 (0.0%) |
| Utilities | 0 (0.0%) | 0 (0.0%) |
| Information | 0 (0.0%) | 0 (0.0%) |
| Finance & Insurance | 0 (0.0%) | 0 (0.0%) |
| Real Estate, Rental & Leasing | 0 (0.0%) | 0 (0.0%) |
| Professional & Scientific | 8 (100.0%) | 0 (0.0%) |
| Enterprise Management | 0 (0.0%) | 0 (0.0%) |
| Administrative & Support | 0 (0.0%) | 0 (0.0%) |
| Educational Services | 0 (0.0%) | 91 (100.0%) |
| Health Care & Social Assistance | 0 (0.0%) | 21 (100.0%) |
| Arts, Entertainment & Recreation | 2 (100.0%) | 0 (0.0%) |
| Accommodation & Food Services | 0 (0.0%) | 0 (0.0%) |
| Public Administration | 24 (64.9%) | 13 (35.1%) |
| Total | 176 (41.0%) | 253 (59.0%) |
Education in Fort Dick
School Enrollment in Fort Dick
The most common levels of schooling among the 147 students in Fort Dick are high school (58 | 39.5%), elementary school (50 | 34.0%), and middle school (24 | 16.3%).
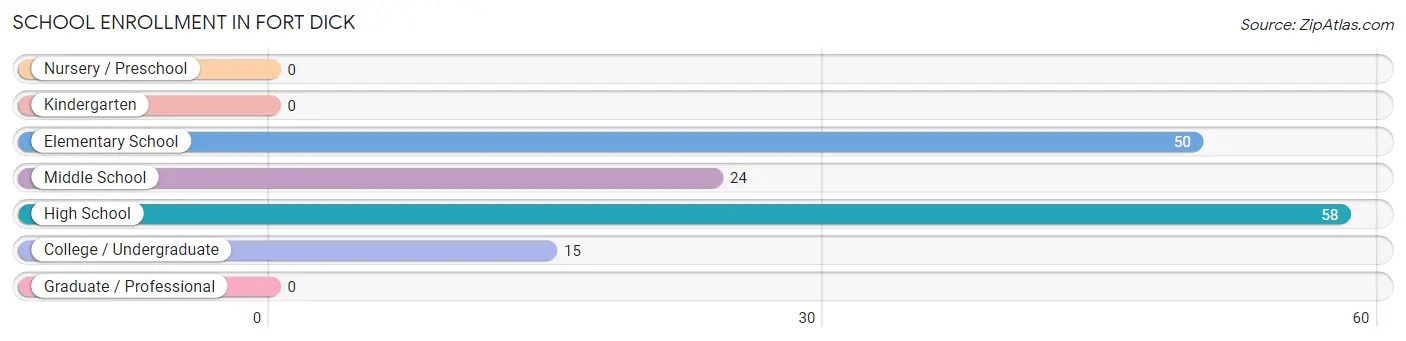
| School Level | # Students | % Students |
| Nursery / Preschool | 0 | 0.0% |
| Kindergarten | 0 | 0.0% |
| Elementary School | 50 | 34.0% |
| Middle School | 24 | 16.3% |
| High School | 58 | 39.5% |
| College / Undergraduate | 15 | 10.2% |
| Graduate / Professional | 0 | 0.0% |
| Total | 147 | 100.0% |
School Enrollment by Age by Funding Source in Fort Dick
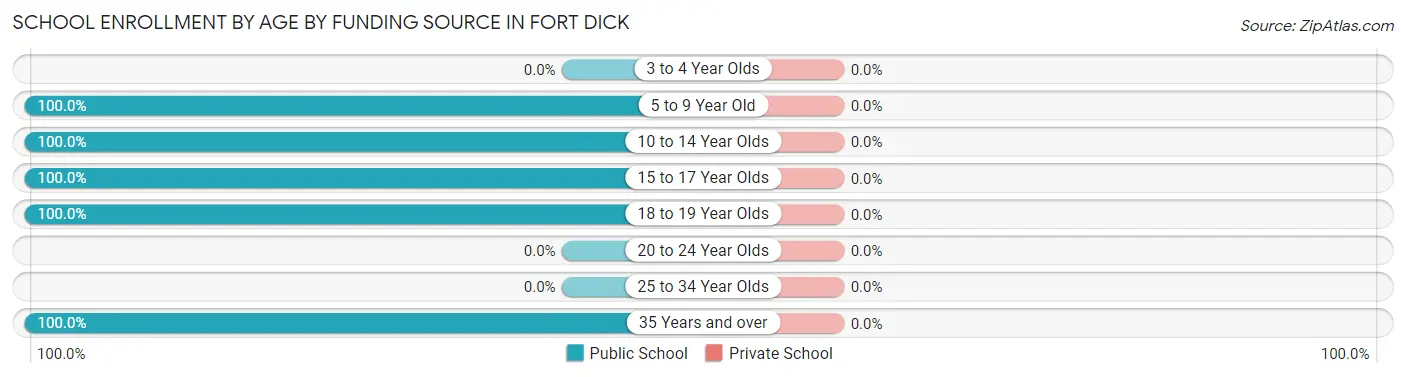
| Age Bracket | Public School | Private School |
| 3 to 4 Year Olds | 0 (0.0%) | 0 (0.0%) |
| 5 to 9 Year Old | 50 (100.0%) | 0 (0.0%) |
| 10 to 14 Year Olds | 24 (100.0%) | 0 (0.0%) |
| 15 to 17 Year Olds | 45 (100.0%) | 0 (0.0%) |
| 18 to 19 Year Olds | 13 (100.0%) | 0 (0.0%) |
| 20 to 24 Year Olds | 0 (0.0%) | 0 (0.0%) |
| 25 to 34 Year Olds | 0 (0.0%) | 0 (0.0%) |
| 35 Years and over | 15 (100.0%) | 0 (0.0%) |
| Total | 147 (100.0%) | 0 (0.0%) |
Educational Attainment by Field of Study in Fort Dick
Literature & languages (68 | 24.5%), business (38 | 13.7%), communications (38 | 13.7%), psychology (32 | 11.6%), and social sciences (28 | 10.1%) are the most common fields of study among 277 individuals in Fort Dick who have obtained a bachelor's degree or higher.
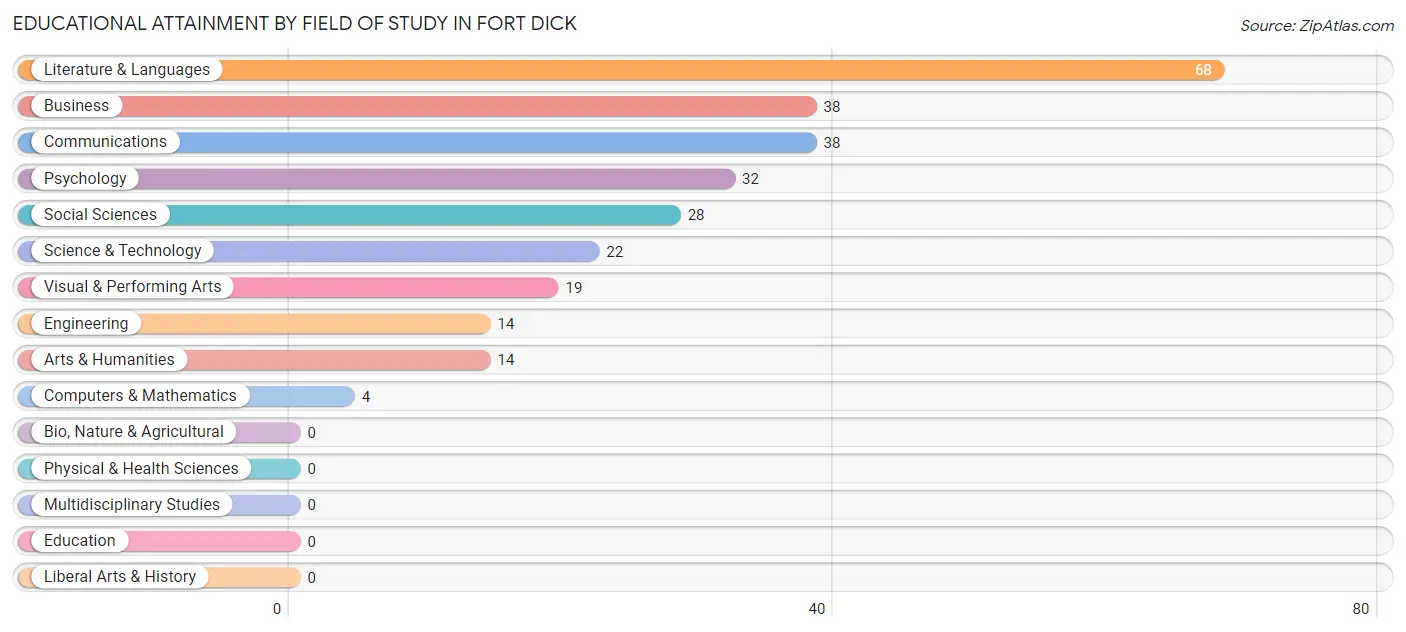
| Field of Study | # Graduates | % Graduates |
| Computers & Mathematics | 4 | 1.4% |
| Bio, Nature & Agricultural | 0 | 0.0% |
| Physical & Health Sciences | 0 | 0.0% |
| Psychology | 32 | 11.6% |
| Social Sciences | 28 | 10.1% |
| Engineering | 14 | 5.1% |
| Multidisciplinary Studies | 0 | 0.0% |
| Science & Technology | 22 | 7.9% |
| Business | 38 | 13.7% |
| Education | 0 | 0.0% |
| Literature & Languages | 68 | 24.5% |
| Liberal Arts & History | 0 | 0.0% |
| Visual & Performing Arts | 19 | 6.9% |
| Communications | 38 | 13.7% |
| Arts & Humanities | 14 | 5.1% |
| Total | 277 | 100.0% |
Transportation & Commute in Fort Dick
Vehicle Availability by Sex in Fort Dick
The most prevalent vehicle ownership categories in Fort Dick are males with 2 vehicles (102, accounting for 58.0%) and females with 2 vehicles (104, making up 42.9%).
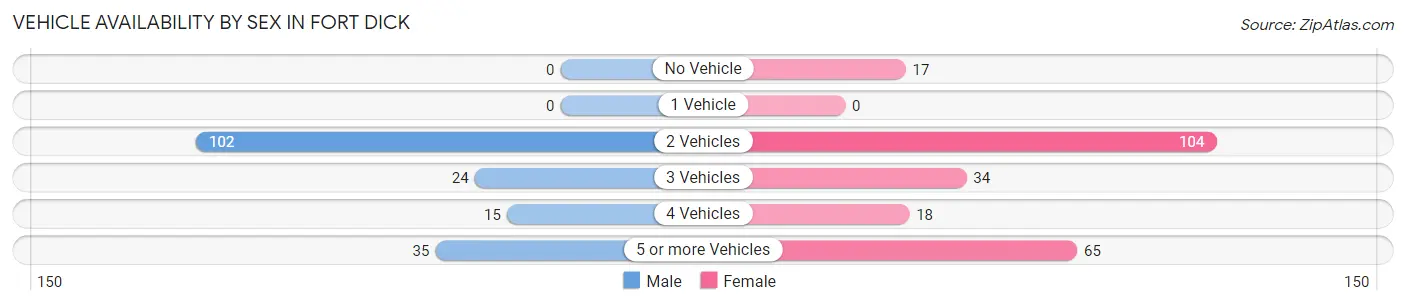
| Vehicles Available | Male | Female |
| No Vehicle | 0 (0.0%) | 17 (7.1%) |
| 1 Vehicle | 0 (0.0%) | 0 (0.0%) |
| 2 Vehicles | 102 (58.0%) | 104 (43.7%) |
| 3 Vehicles | 24 (13.6%) | 34 (14.3%) |
| 4 Vehicles | 15 (8.5%) | 18 (7.6%) |
| 5 or more Vehicles | 35 (19.9%) | 65 (27.3%) |
| Total | 176 (100.0%) | 238 (100.0%) |
Commute Time in Fort Dick
The most frequently occuring commute durations in Fort Dick are 10 to 14 minutes (112 commuters, 30.4%), 5 to 9 minutes (111 commuters, 30.2%), and less than 5 minutes (62 commuters, 16.9%).
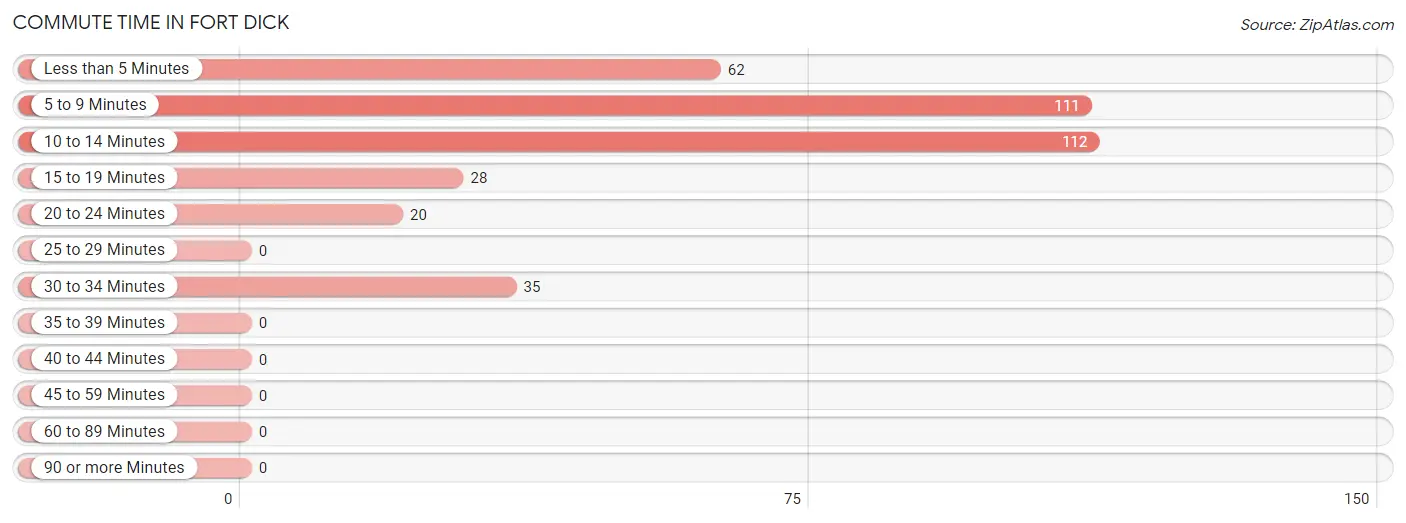
| Commute Time | # Commuters | % Commuters |
| Less than 5 Minutes | 62 | 16.9% |
| 5 to 9 Minutes | 111 | 30.2% |
| 10 to 14 Minutes | 112 | 30.4% |
| 15 to 19 Minutes | 28 | 7.6% |
| 20 to 24 Minutes | 20 | 5.4% |
| 25 to 29 Minutes | 0 | 0.0% |
| 30 to 34 Minutes | 35 | 9.5% |
| 35 to 39 Minutes | 0 | 0.0% |
| 40 to 44 Minutes | 0 | 0.0% |
| 45 to 59 Minutes | 0 | 0.0% |
| 60 to 89 Minutes | 0 | 0.0% |
| 90 or more Minutes | 0 | 0.0% |
Commute Time by Sex in Fort Dick
The most common commute times in Fort Dick are 10 to 14 minutes (57 commuters, 32.4%) for males and 5 to 9 minutes (73 commuters, 38.0%) for females.
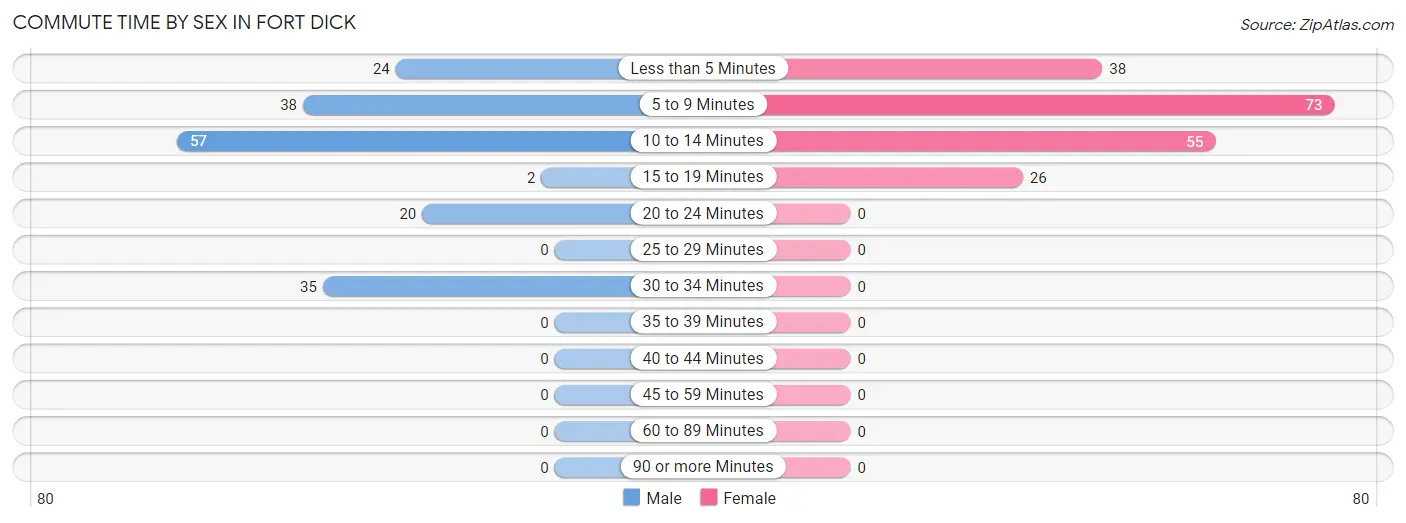
| Commute Time | Male | Female |
| Less than 5 Minutes | 24 (13.6%) | 38 (19.8%) |
| 5 to 9 Minutes | 38 (21.6%) | 73 (38.0%) |
| 10 to 14 Minutes | 57 (32.4%) | 55 (28.6%) |
| 15 to 19 Minutes | 2 (1.1%) | 26 (13.5%) |
| 20 to 24 Minutes | 20 (11.4%) | 0 (0.0%) |
| 25 to 29 Minutes | 0 (0.0%) | 0 (0.0%) |
| 30 to 34 Minutes | 35 (19.9%) | 0 (0.0%) |
| 35 to 39 Minutes | 0 (0.0%) | 0 (0.0%) |
| 40 to 44 Minutes | 0 (0.0%) | 0 (0.0%) |
| 45 to 59 Minutes | 0 (0.0%) | 0 (0.0%) |
| 60 to 89 Minutes | 0 (0.0%) | 0 (0.0%) |
| 90 or more Minutes | 0 (0.0%) | 0 (0.0%) |
Time of Departure to Work by Sex in Fort Dick
The most frequent times of departure to work in Fort Dick are 6:00 AM to 6:29 AM (41, 23.3%) for males and 7:00 AM to 7:29 AM (42, 21.9%) for females.
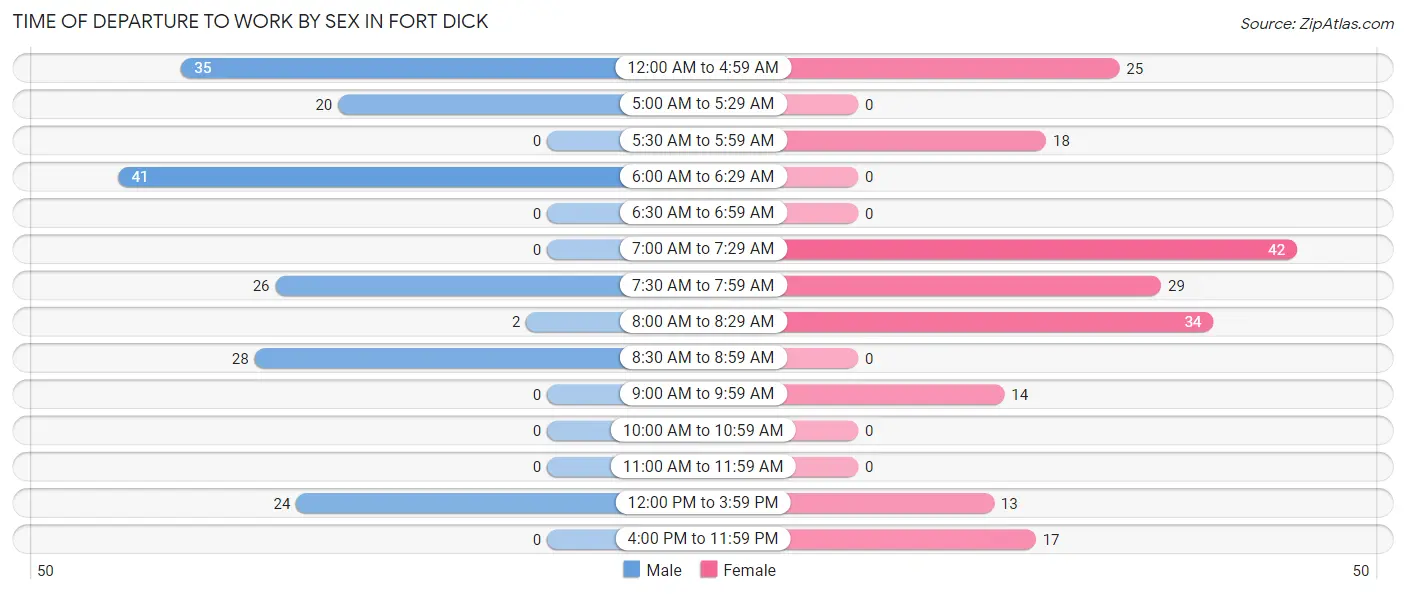
| Time of Departure | Male | Female |
| 12:00 AM to 4:59 AM | 35 (19.9%) | 25 (13.0%) |
| 5:00 AM to 5:29 AM | 20 (11.4%) | 0 (0.0%) |
| 5:30 AM to 5:59 AM | 0 (0.0%) | 18 (9.4%) |
| 6:00 AM to 6:29 AM | 41 (23.3%) | 0 (0.0%) |
| 6:30 AM to 6:59 AM | 0 (0.0%) | 0 (0.0%) |
| 7:00 AM to 7:29 AM | 0 (0.0%) | 42 (21.9%) |
| 7:30 AM to 7:59 AM | 26 (14.8%) | 29 (15.1%) |
| 8:00 AM to 8:29 AM | 2 (1.1%) | 34 (17.7%) |
| 8:30 AM to 8:59 AM | 28 (15.9%) | 0 (0.0%) |
| 9:00 AM to 9:59 AM | 0 (0.0%) | 14 (7.3%) |
| 10:00 AM to 10:59 AM | 0 (0.0%) | 0 (0.0%) |
| 11:00 AM to 11:59 AM | 0 (0.0%) | 0 (0.0%) |
| 12:00 PM to 3:59 PM | 24 (13.6%) | 13 (6.8%) |
| 4:00 PM to 11:59 PM | 0 (0.0%) | 17 (8.8%) |
| Total | 176 (100.0%) | 192 (100.0%) |
Housing Occupancy in Fort Dick
Occupancy by Ownership in Fort Dick
Of the total 508 dwellings in Fort Dick, owner-occupied units account for 463 (91.1%), while renter-occupied units make up 45 (8.9%).
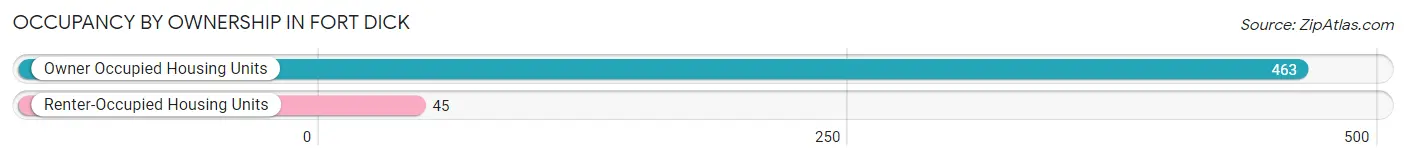
| Occupancy | # Housing Units | % Housing Units |
| Owner Occupied Housing Units | 463 | 91.1% |
| Renter-Occupied Housing Units | 45 | 8.9% |
| Total Occupied Housing Units | 508 | 100.0% |
Occupancy by Household Size in Fort Dick
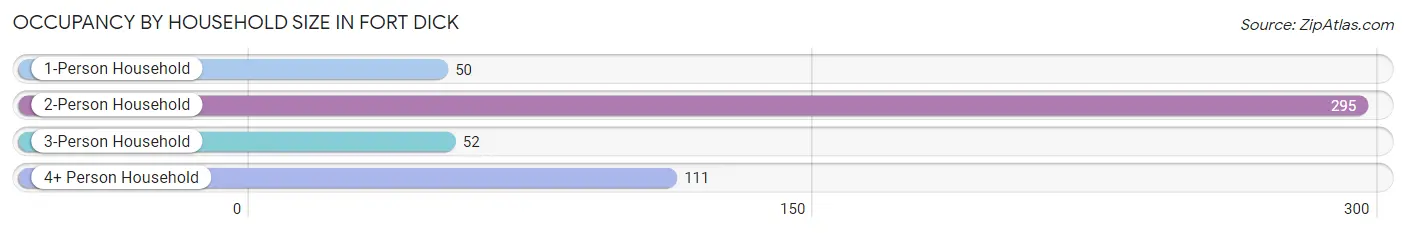
| Household Size | # Housing Units | % Housing Units |
| 1-Person Household | 50 | 9.8% |
| 2-Person Household | 295 | 58.1% |
| 3-Person Household | 52 | 10.2% |
| 4+ Person Household | 111 | 21.8% |
| Total Housing Units | 508 | 100.0% |
Occupancy by Ownership by Household Size in Fort Dick
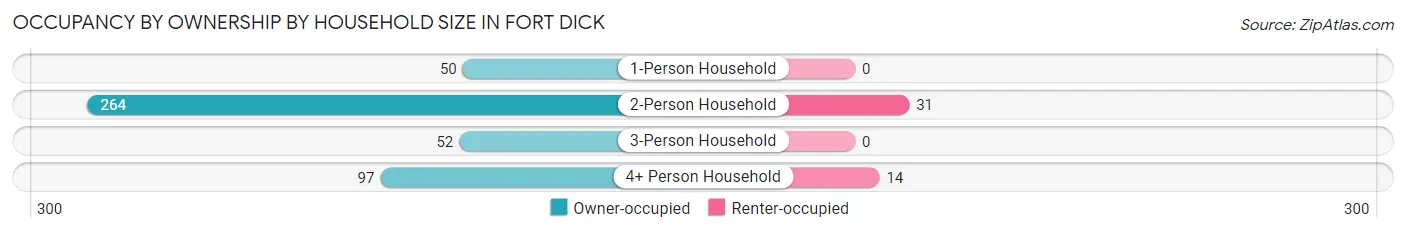
| Household Size | Owner-occupied | Renter-occupied |
| 1-Person Household | 50 (100.0%) | 0 (0.0%) |
| 2-Person Household | 264 (89.5%) | 31 (10.5%) |
| 3-Person Household | 52 (100.0%) | 0 (0.0%) |
| 4+ Person Household | 97 (87.4%) | 14 (12.6%) |
| Total Housing Units | 463 (91.1%) | 45 (8.9%) |
Occupancy by Educational Attainment in Fort Dick
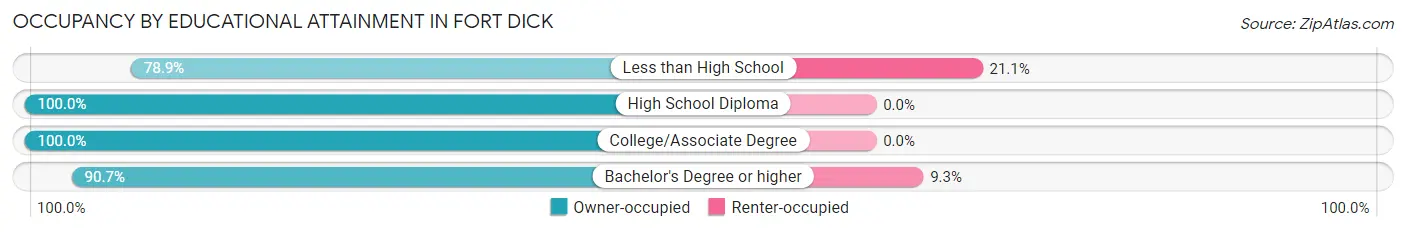
| Household Size | Owner-occupied | Renter-occupied |
| Less than High School | 116 (78.9%) | 31 (21.1%) |
| High School Diploma | 87 (100.0%) | 0 (0.0%) |
| College/Associate Degree | 124 (100.0%) | 0 (0.0%) |
| Bachelor's Degree or higher | 136 (90.7%) | 14 (9.3%) |
Occupancy by Age of Householder in Fort Dick
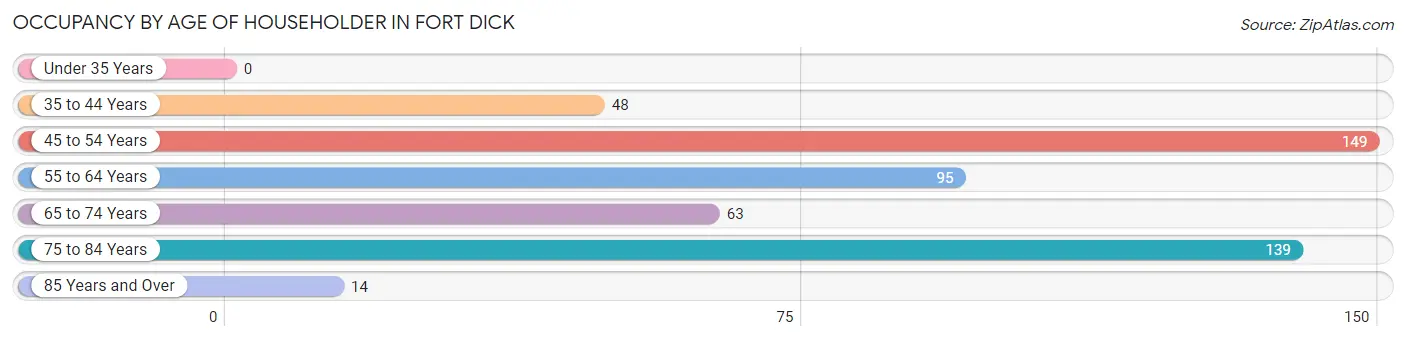
| Age Bracket | # Households | % Households |
| Under 35 Years | 0 | 0.0% |
| 35 to 44 Years | 48 | 9.5% |
| 45 to 54 Years | 149 | 29.3% |
| 55 to 64 Years | 95 | 18.7% |
| 65 to 74 Years | 63 | 12.4% |
| 75 to 84 Years | 139 | 27.4% |
| 85 Years and Over | 14 | 2.8% |
| Total | 508 | 100.0% |
Housing Finances in Fort Dick
Median Income by Occupancy in Fort Dick
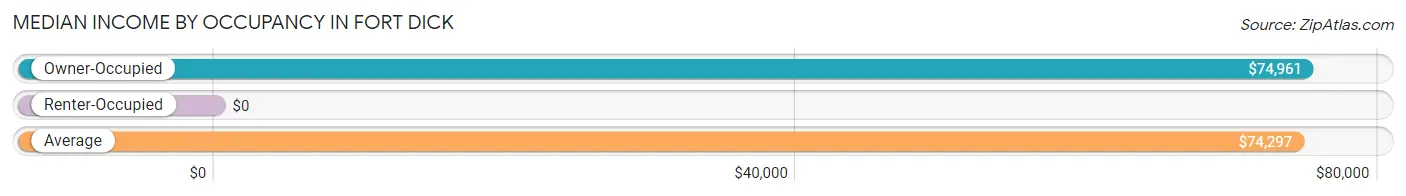
| Occupancy Type | # Households | Median Income |
| Owner-Occupied | 463 (91.1%) | $74,961 |
| Renter-Occupied | 45 (8.9%) | $0 |
| Average | 508 (100.0%) | $74,297 |
Occupancy by Householder Income Bracket in Fort Dick
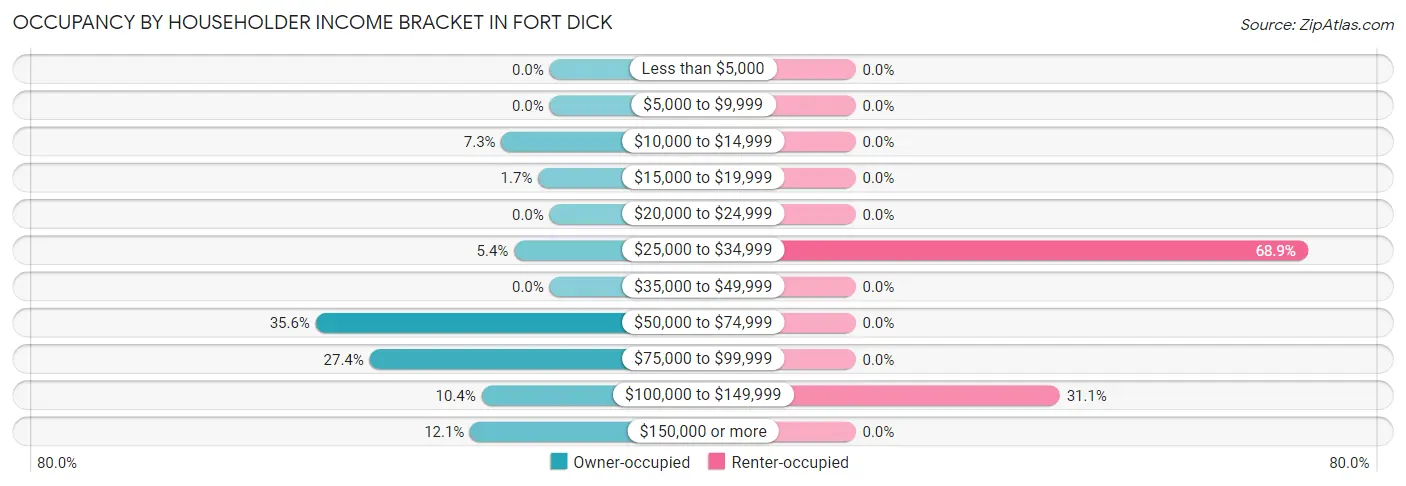
| Income Bracket | Owner-occupied | Renter-occupied |
| Less than $5,000 | 0 (0.0%) | 0 (0.0%) |
| $5,000 to $9,999 | 0 (0.0%) | 0 (0.0%) |
| $10,000 to $14,999 | 34 (7.3%) | 0 (0.0%) |
| $15,000 to $19,999 | 8 (1.7%) | 0 (0.0%) |
| $20,000 to $24,999 | 0 (0.0%) | 0 (0.0%) |
| $25,000 to $34,999 | 25 (5.4%) | 31 (68.9%) |
| $35,000 to $49,999 | 0 (0.0%) | 0 (0.0%) |
| $50,000 to $74,999 | 165 (35.6%) | 0 (0.0%) |
| $75,000 to $99,999 | 127 (27.4%) | 0 (0.0%) |
| $100,000 to $149,999 | 48 (10.4%) | 14 (31.1%) |
| $150,000 or more | 56 (12.1%) | 0 (0.0%) |
| Total | 463 (100.0%) | 45 (100.0%) |
Monthly Housing Cost Tiers in Fort Dick
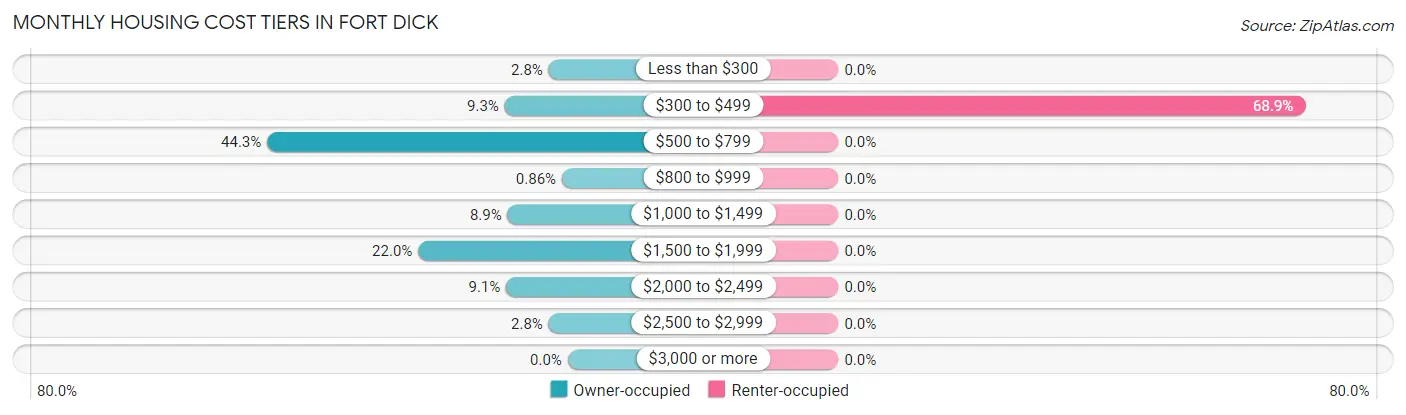
| Monthly Cost | Owner-occupied | Renter-occupied |
| Less than $300 | 13 (2.8%) | 0 (0.0%) |
| $300 to $499 | 43 (9.3%) | 31 (68.9%) |
| $500 to $799 | 205 (44.3%) | 0 (0.0%) |
| $800 to $999 | 4 (0.9%) | 0 (0.0%) |
| $1,000 to $1,499 | 41 (8.9%) | 0 (0.0%) |
| $1,500 to $1,999 | 102 (22.0%) | 0 (0.0%) |
| $2,000 to $2,499 | 42 (9.1%) | 0 (0.0%) |
| $2,500 to $2,999 | 13 (2.8%) | 0 (0.0%) |
| $3,000 or more | 0 (0.0%) | 0 (0.0%) |
| Total | 463 (100.0%) | 45 (100.0%) |
Physical Housing Characteristics in Fort Dick
Housing Structures in Fort Dick
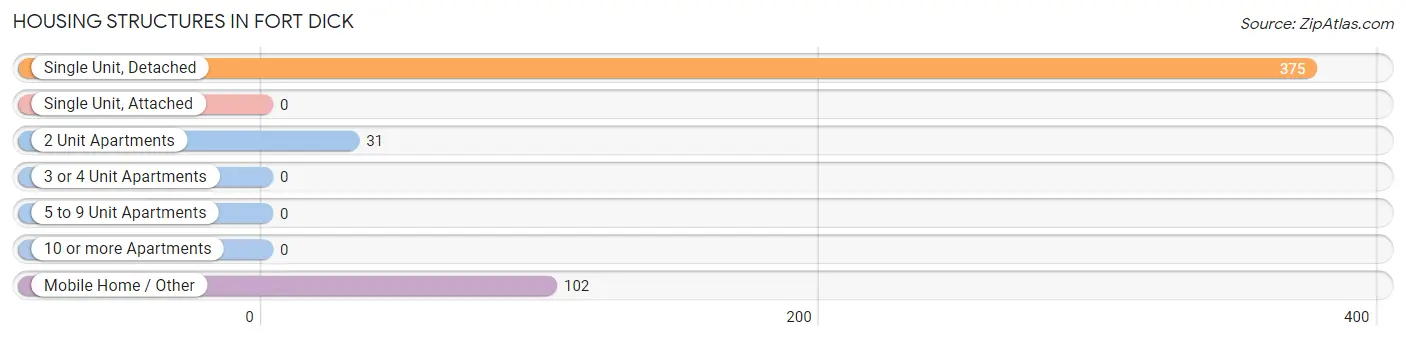
| Structure Type | # Housing Units | % Housing Units |
| Single Unit, Detached | 375 | 73.8% |
| Single Unit, Attached | 0 | 0.0% |
| 2 Unit Apartments | 31 | 6.1% |
| 3 or 4 Unit Apartments | 0 | 0.0% |
| 5 to 9 Unit Apartments | 0 | 0.0% |
| 10 or more Apartments | 0 | 0.0% |
| Mobile Home / Other | 102 | 20.1% |
| Total | 508 | 100.0% |
Housing Structures by Occupancy in Fort Dick
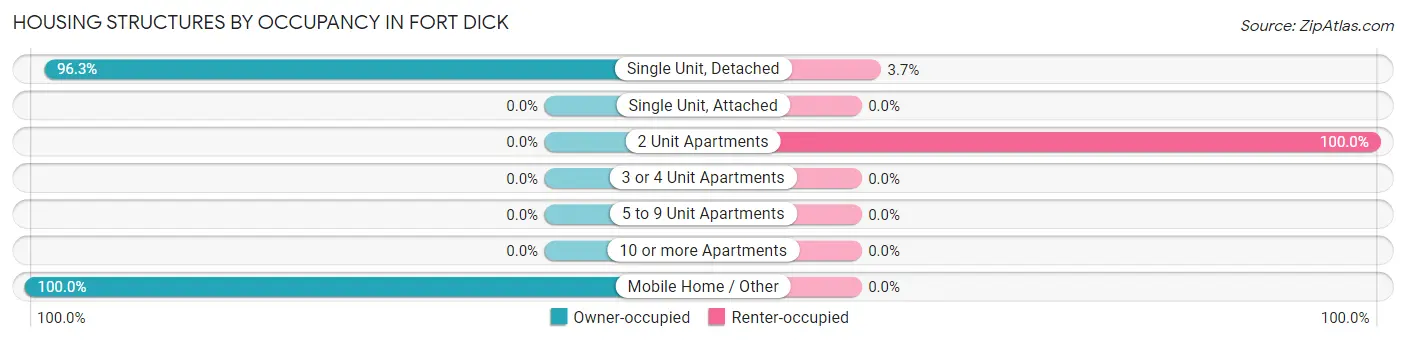
| Structure Type | Owner-occupied | Renter-occupied |
| Single Unit, Detached | 361 (96.3%) | 14 (3.7%) |
| Single Unit, Attached | 0 (0.0%) | 0 (0.0%) |
| 2 Unit Apartments | 0 (0.0%) | 31 (100.0%) |
| 3 or 4 Unit Apartments | 0 (0.0%) | 0 (0.0%) |
| 5 to 9 Unit Apartments | 0 (0.0%) | 0 (0.0%) |
| 10 or more Apartments | 0 (0.0%) | 0 (0.0%) |
| Mobile Home / Other | 102 (100.0%) | 0 (0.0%) |
| Total | 463 (91.1%) | 45 (8.9%) |
Housing Structures by Number of Rooms in Fort Dick
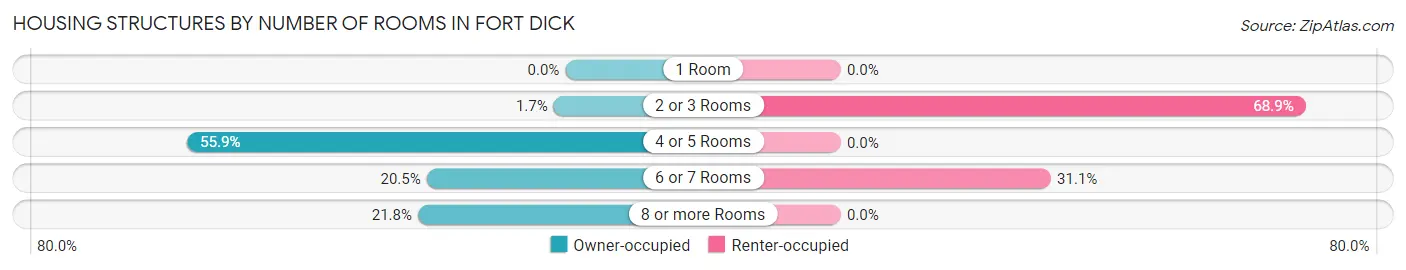
| Number of Rooms | Owner-occupied | Renter-occupied |
| 1 Room | 0 (0.0%) | 0 (0.0%) |
| 2 or 3 Rooms | 8 (1.7%) | 31 (68.9%) |
| 4 or 5 Rooms | 259 (55.9%) | 0 (0.0%) |
| 6 or 7 Rooms | 95 (20.5%) | 14 (31.1%) |
| 8 or more Rooms | 101 (21.8%) | 0 (0.0%) |
| Total | 463 (100.0%) | 45 (100.0%) |
Housing Structure by Heating Type in Fort Dick
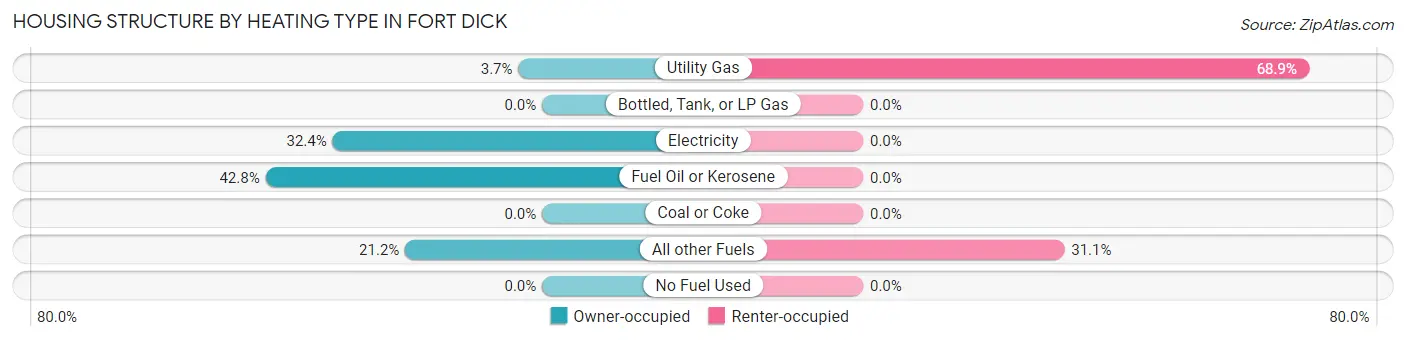
| Heating Type | Owner-occupied | Renter-occupied |
| Utility Gas | 17 (3.7%) | 31 (68.9%) |
| Bottled, Tank, or LP Gas | 0 (0.0%) | 0 (0.0%) |
| Electricity | 150 (32.4%) | 0 (0.0%) |
| Fuel Oil or Kerosene | 198 (42.8%) | 0 (0.0%) |
| Coal or Coke | 0 (0.0%) | 0 (0.0%) |
| All other Fuels | 98 (21.2%) | 14 (31.1%) |
| No Fuel Used | 0 (0.0%) | 0 (0.0%) |
| Total | 463 (100.0%) | 45 (100.0%) |
Household Vehicle Usage in Fort Dick
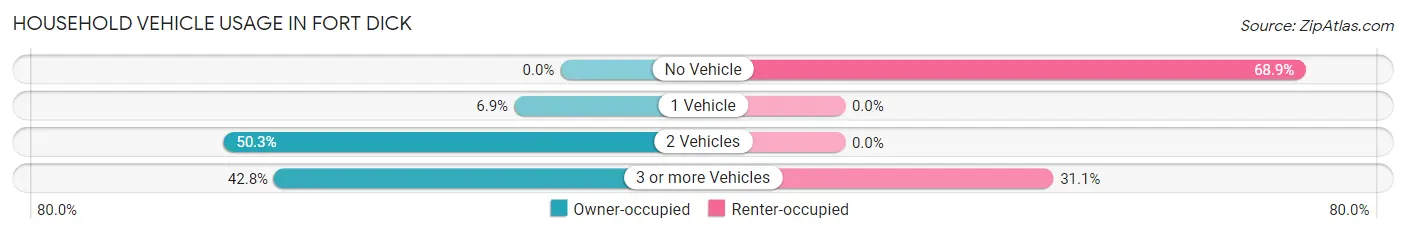
| Vehicles per Household | Owner-occupied | Renter-occupied |
| No Vehicle | 0 (0.0%) | 31 (68.9%) |
| 1 Vehicle | 32 (6.9%) | 0 (0.0%) |
| 2 Vehicles | 233 (50.3%) | 0 (0.0%) |
| 3 or more Vehicles | 198 (42.8%) | 14 (31.1%) |
| Total | 463 (100.0%) | 45 (100.0%) |
Real Estate & Mortgages in Fort Dick
Real Estate and Mortgage Overview in Fort Dick
| Characteristic | Without Mortgage | With Mortgage |
| Housing Units | 265 | 198 |
| Median Property Value | $228,700 | $414,000 |
| Median Household Income | $61,713 | $56 |
| Monthly Housing Costs | $551 | $0 |
| Real Estate Taxes | $1,357 | $0 |
Property Value by Mortgage Status in Fort Dick
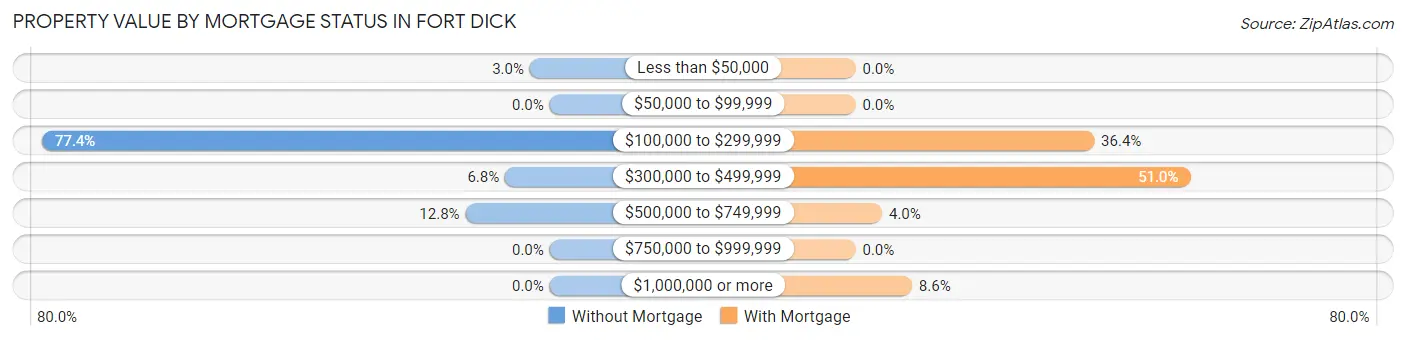
| Property Value | Without Mortgage | With Mortgage |
| Less than $50,000 | 8 (3.0%) | 0 (0.0%) |
| $50,000 to $99,999 | 0 (0.0%) | 0 (0.0%) |
| $100,000 to $299,999 | 205 (77.4%) | 72 (36.4%) |
| $300,000 to $499,999 | 18 (6.8%) | 101 (51.0%) |
| $500,000 to $749,999 | 34 (12.8%) | 8 (4.0%) |
| $750,000 to $999,999 | 0 (0.0%) | 0 (0.0%) |
| $1,000,000 or more | 0 (0.0%) | 17 (8.6%) |
| Total | 265 (100.0%) | 198 (100.0%) |
Household Income by Mortgage Status in Fort Dick
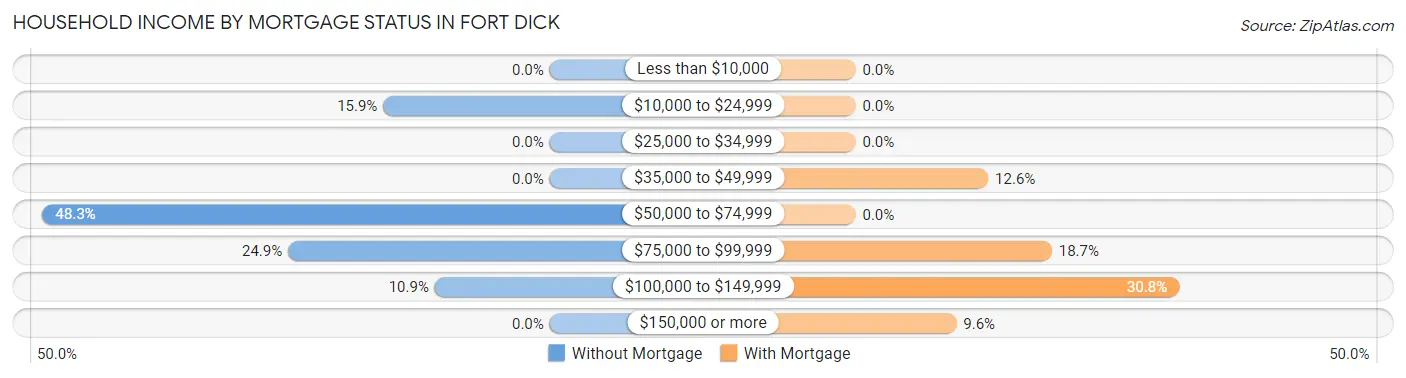
| Household Income | Without Mortgage | With Mortgage |
| Less than $10,000 | 0 (0.0%) | 0 (0.0%) |
| $10,000 to $24,999 | 42 (15.9%) | 0 (0.0%) |
| $25,000 to $34,999 | 0 (0.0%) | 0 (0.0%) |
| $35,000 to $49,999 | 0 (0.0%) | 25 (12.6%) |
| $50,000 to $74,999 | 128 (48.3%) | 0 (0.0%) |
| $75,000 to $99,999 | 66 (24.9%) | 37 (18.7%) |
| $100,000 to $149,999 | 29 (10.9%) | 61 (30.8%) |
| $150,000 or more | 0 (0.0%) | 19 (9.6%) |
| Total | 265 (100.0%) | 198 (100.0%) |
Property Value to Household Income Ratio in Fort Dick
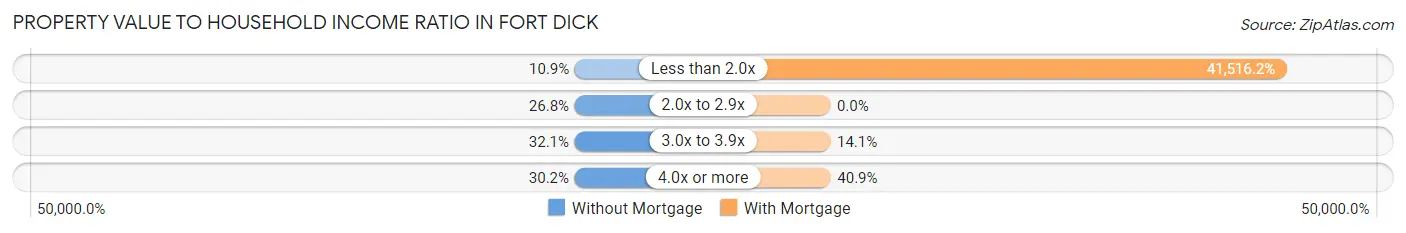
| Value-to-Income Ratio | Without Mortgage | With Mortgage |
| Less than 2.0x | 29 (10.9%) | 82,202 (41,516.2%) |
| 2.0x to 2.9x | 71 (26.8%) | 0 (0.0%) |
| 3.0x to 3.9x | 85 (32.1%) | 28 (14.1%) |
| 4.0x or more | 80 (30.2%) | 81 (40.9%) |
| Total | 265 (100.0%) | 198 (100.0%) |
Real Estate Taxes by Mortgage Status in Fort Dick
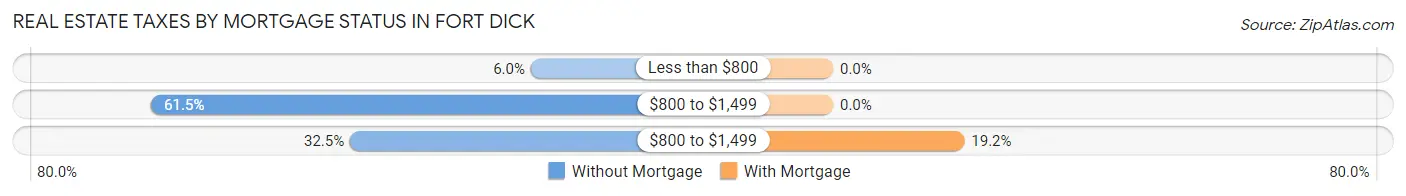
| Property Taxes | Without Mortgage | With Mortgage |
| Less than $800 | 16 (6.0%) | 0 (0.0%) |
| $800 to $1,499 | 163 (61.5%) | 0 (0.0%) |
| $800 to $1,499 | 86 (32.5%) | 38 (19.2%) |
| Total | 265 (100.0%) | 198 (100.0%) |
Health & Disability in Fort Dick
Health Insurance Coverage by Age in Fort Dick
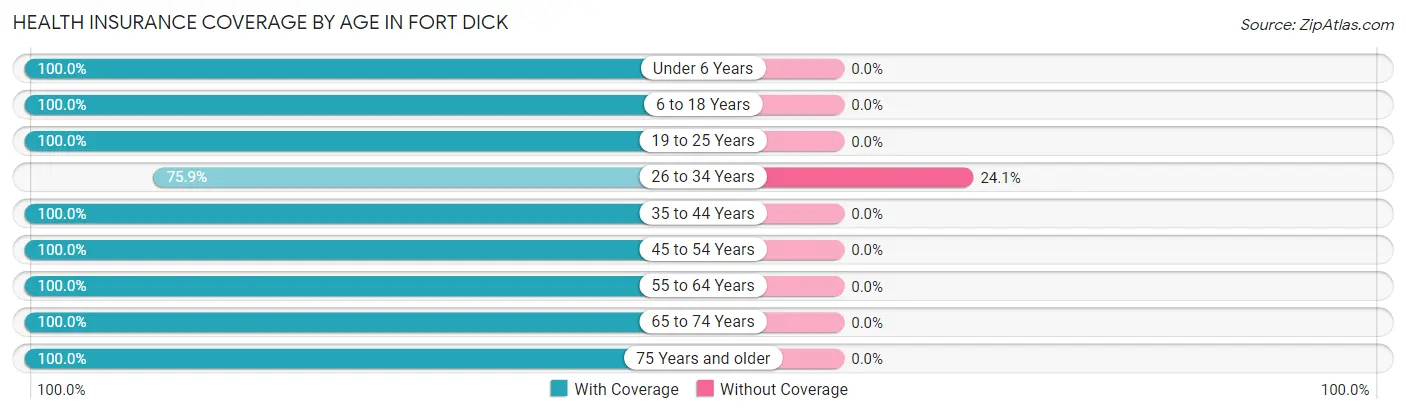
| Age Bracket | With Coverage | Without Coverage |
| Under 6 Years | 38 (100.0%) | 0 (0.0%) |
| 6 to 18 Years | 132 (100.0%) | 0 (0.0%) |
| 19 to 25 Years | 17 (100.0%) | 0 (0.0%) |
| 26 to 34 Years | 104 (75.9%) | 33 (24.1%) |
| 35 to 44 Years | 93 (100.0%) | 0 (0.0%) |
| 45 to 54 Years | 232 (100.0%) | 0 (0.0%) |
| 55 to 64 Years | 184 (100.0%) | 0 (0.0%) |
| 65 to 74 Years | 124 (100.0%) | 0 (0.0%) |
| 75 Years and older | 338 (100.0%) | 0 (0.0%) |
| Total | 1,262 (97.5%) | 33 (2.5%) |
Health Insurance Coverage by Citizenship Status in Fort Dick
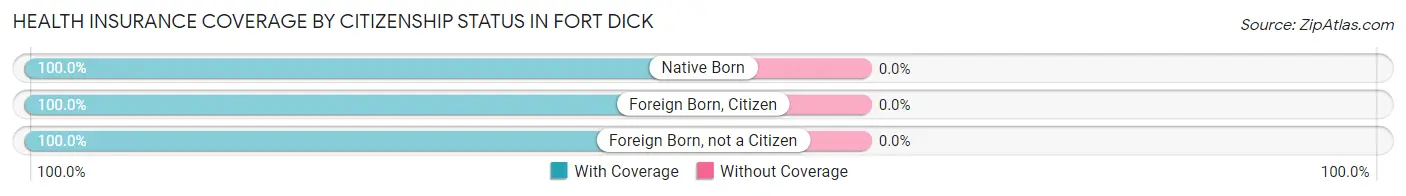
| Citizenship Status | With Coverage | Without Coverage |
| Native Born | 38 (100.0%) | 0 (0.0%) |
| Foreign Born, Citizen | 132 (100.0%) | 0 (0.0%) |
| Foreign Born, not a Citizen | 17 (100.0%) | 0 (0.0%) |
Health Insurance Coverage by Household Income in Fort Dick
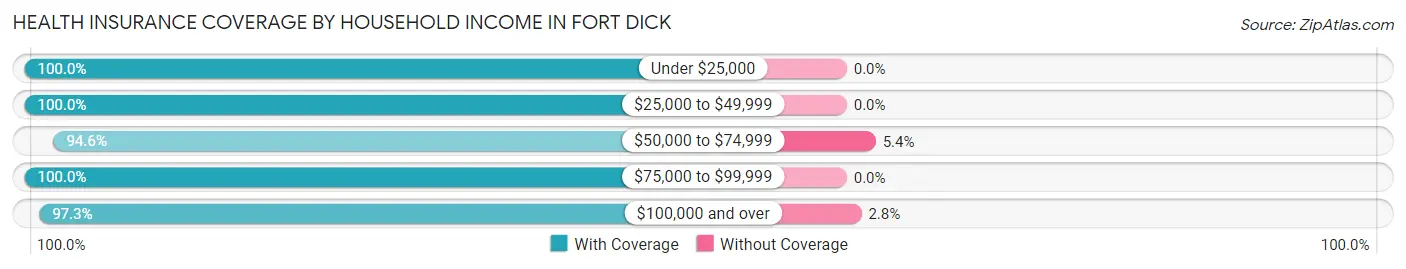
| Household Income | With Coverage | Without Coverage |
| Under $25,000 | 84 (100.0%) | 0 (0.0%) |
| $25,000 to $49,999 | 99 (100.0%) | 0 (0.0%) |
| $50,000 to $74,999 | 314 (94.6%) | 18 (5.4%) |
| $75,000 to $99,999 | 234 (100.0%) | 0 (0.0%) |
| $100,000 and over | 531 (97.3%) | 15 (2.8%) |
Public vs Private Health Insurance Coverage by Age in Fort Dick
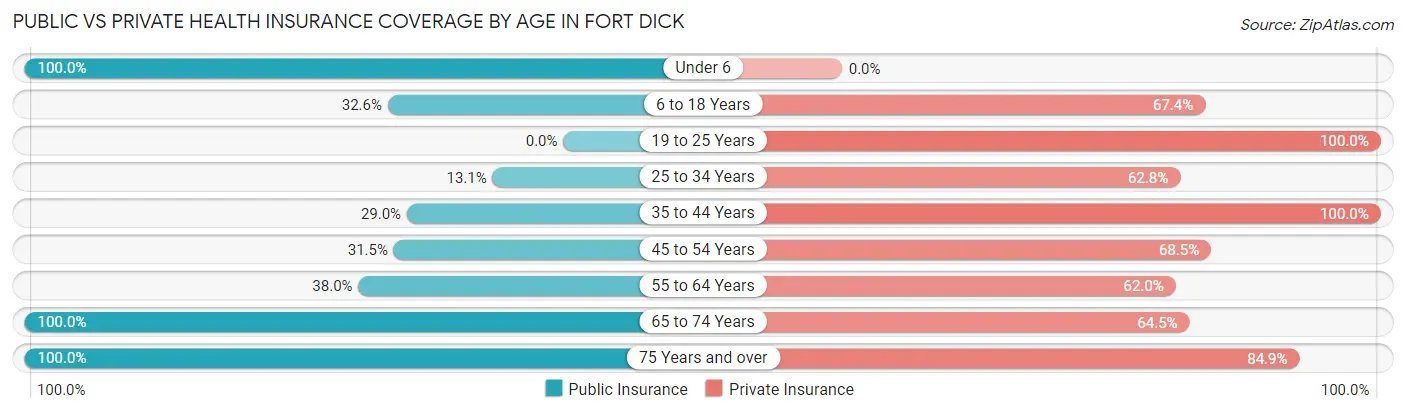
| Age Bracket | Public Insurance | Private Insurance |
| Under 6 | 38 (100.0%) | 0 (0.0%) |
| 6 to 18 Years | 43 (32.6%) | 89 (67.4%) |
| 19 to 25 Years | 0 (0.0%) | 17 (100.0%) |
| 25 to 34 Years | 18 (13.1%) | 86 (62.8%) |
| 35 to 44 Years | 27 (29.0%) | 93 (100.0%) |
| 45 to 54 Years | 73 (31.5%) | 159 (68.5%) |
| 55 to 64 Years | 70 (38.0%) | 114 (62.0%) |
| 65 to 74 Years | 124 (100.0%) | 80 (64.5%) |
| 75 Years and over | 338 (100.0%) | 287 (84.9%) |
| Total | 731 (56.5%) | 925 (71.4%) |
Disability Status by Sex by Age in Fort Dick
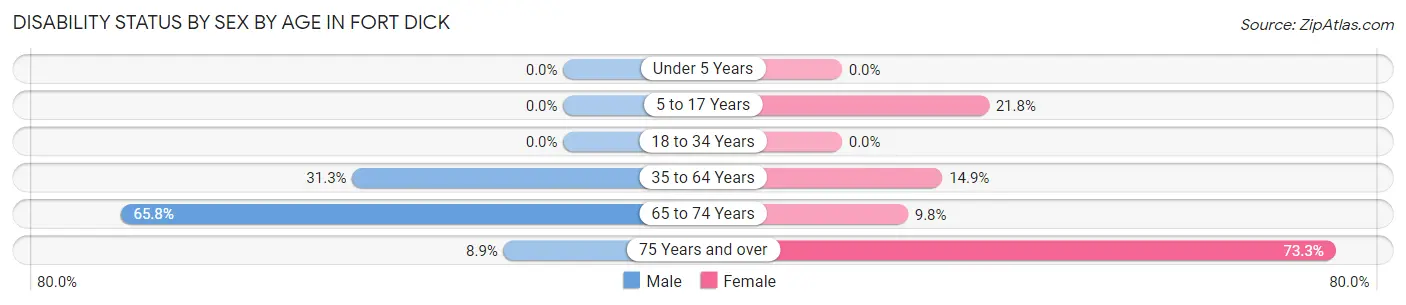
| Age Bracket | Male | Female |
| Under 5 Years | 0 (0.0%) | 0 (0.0%) |
| 5 to 17 Years | 0 (0.0%) | 12 (21.8%) |
| 18 to 34 Years | 0 (0.0%) | 0 (0.0%) |
| 35 to 64 Years | 88 (31.3%) | 34 (14.9%) |
| 65 to 74 Years | 48 (65.7%) | 5 (9.8%) |
| 75 Years and over | 14 (8.9%) | 132 (73.3%) |
Disability Class by Sex by Age in Fort Dick
Disability Class: Hearing Difficulty
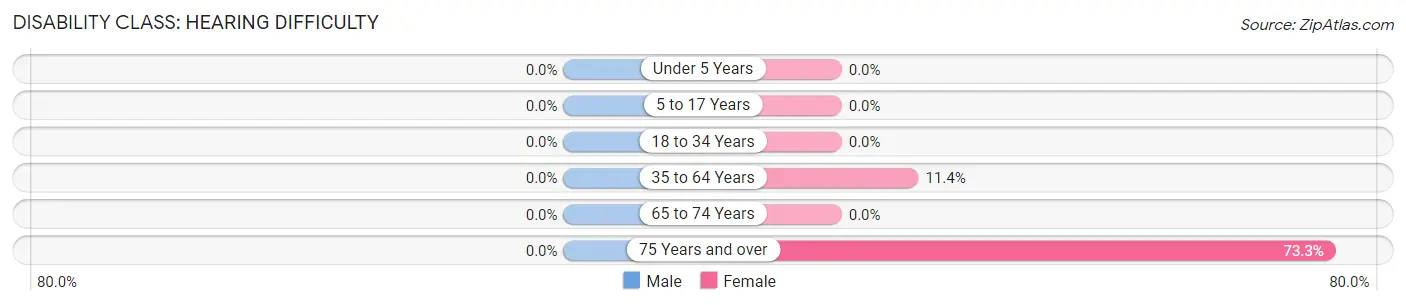
| Age Bracket | Male | Female |
| Under 5 Years | 0 (0.0%) | 0 (0.0%) |
| 5 to 17 Years | 0 (0.0%) | 0 (0.0%) |
| 18 to 34 Years | 0 (0.0%) | 0 (0.0%) |
| 35 to 64 Years | 0 (0.0%) | 26 (11.4%) |
| 65 to 74 Years | 0 (0.0%) | 0 (0.0%) |
| 75 Years and over | 0 (0.0%) | 132 (73.3%) |
Disability Class: Vision Difficulty
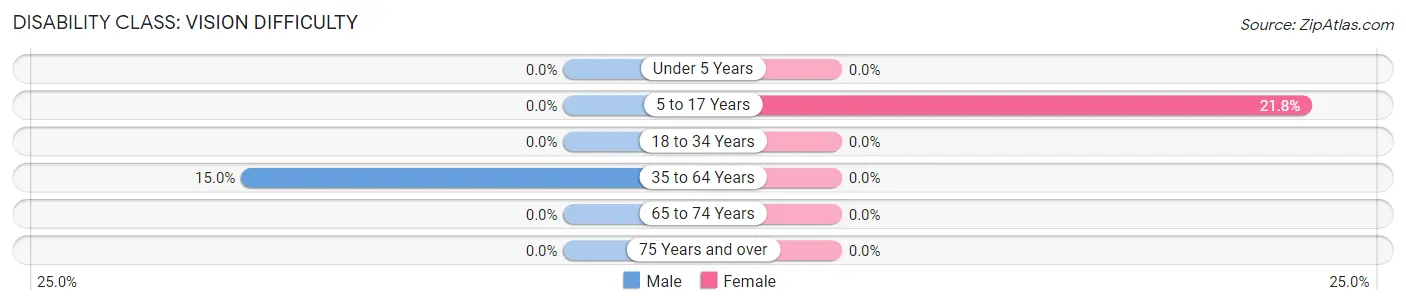
| Age Bracket | Male | Female |
| Under 5 Years | 0 (0.0%) | 0 (0.0%) |
| 5 to 17 Years | 0 (0.0%) | 12 (21.8%) |
| 18 to 34 Years | 0 (0.0%) | 0 (0.0%) |
| 35 to 64 Years | 42 (14.9%) | 0 (0.0%) |
| 65 to 74 Years | 0 (0.0%) | 0 (0.0%) |
| 75 Years and over | 0 (0.0%) | 0 (0.0%) |
Disability Class: Cognitive Difficulty
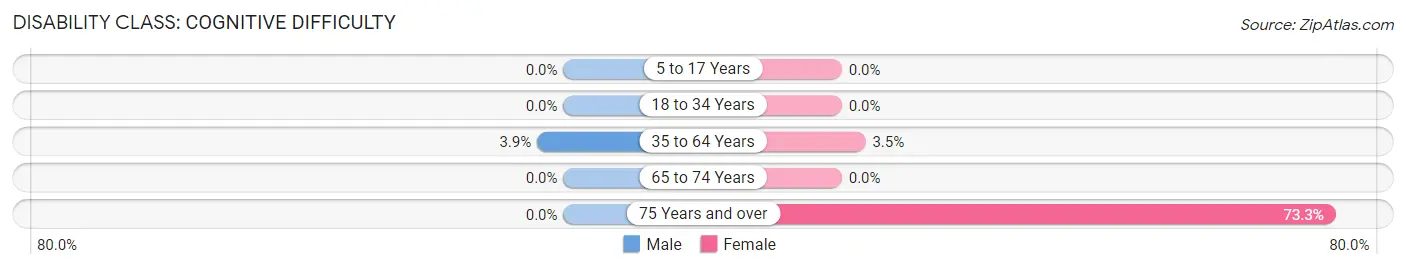
| Age Bracket | Male | Female |
| 5 to 17 Years | 0 (0.0%) | 0 (0.0%) |
| 18 to 34 Years | 0 (0.0%) | 0 (0.0%) |
| 35 to 64 Years | 11 (3.9%) | 8 (3.5%) |
| 65 to 74 Years | 0 (0.0%) | 0 (0.0%) |
| 75 Years and over | 0 (0.0%) | 132 (73.3%) |
Disability Class: Ambulatory Difficulty
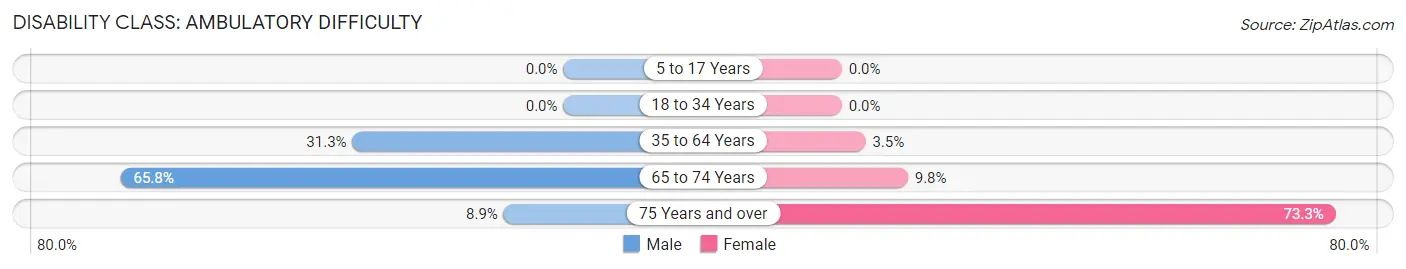
| Age Bracket | Male | Female |
| 5 to 17 Years | 0 (0.0%) | 0 (0.0%) |
| 18 to 34 Years | 0 (0.0%) | 0 (0.0%) |
| 35 to 64 Years | 88 (31.3%) | 8 (3.5%) |
| 65 to 74 Years | 48 (65.7%) | 5 (9.8%) |
| 75 Years and over | 14 (8.9%) | 132 (73.3%) |
Disability Class: Self-Care Difficulty
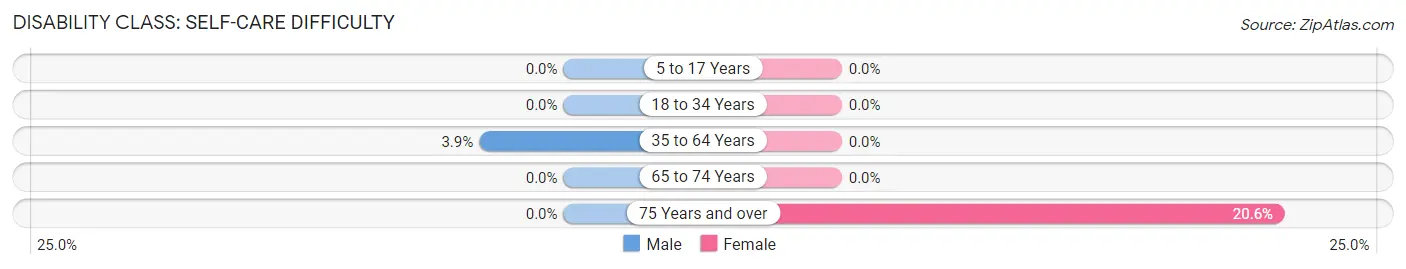
| Age Bracket | Male | Female |
| 5 to 17 Years | 0 (0.0%) | 0 (0.0%) |
| 18 to 34 Years | 0 (0.0%) | 0 (0.0%) |
| 35 to 64 Years | 11 (3.9%) | 0 (0.0%) |
| 65 to 74 Years | 0 (0.0%) | 0 (0.0%) |
| 75 Years and over | 0 (0.0%) | 37 (20.6%) |
Technology Access in Fort Dick
Computing Device Access in Fort Dick
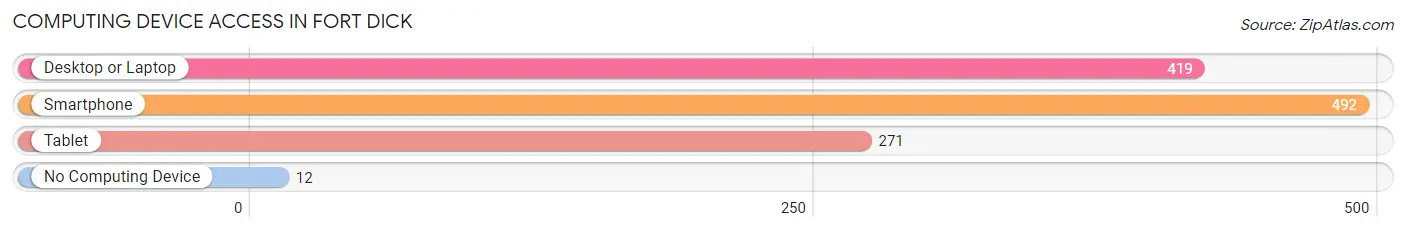
| Device Type | # Households | % Households |
| Desktop or Laptop | 419 | 82.5% |
| Smartphone | 492 | 96.9% |
| Tablet | 271 | 53.3% |
| No Computing Device | 12 | 2.4% |
| Total | 508 | 100.0% |
Internet Access in Fort Dick
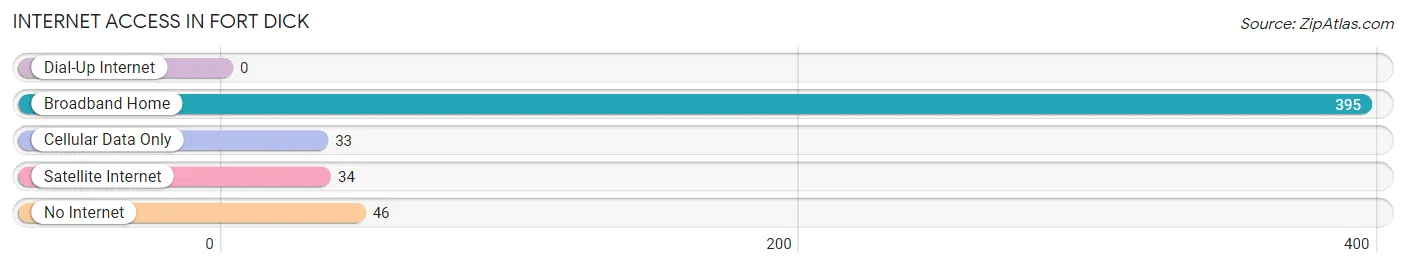
| Internet Type | # Households | % Households |
| Dial-Up Internet | 0 | 0.0% |
| Broadband Home | 395 | 77.8% |
| Cellular Data Only | 33 | 6.5% |
| Satellite Internet | 34 | 6.7% |
| No Internet | 46 | 9.1% |
| Total | 508 | 100.0% |
Fort Dick Summary
Dick, California is a small unincorporated community located in Del Norte County, California. It is situated on the Smith River, approximately 10 miles south of Crescent City. The population of Fort Dick was estimated to be around 1,000 in 2020.
History
Fort Dick was originally established in 1853 as a military post by the United States Army. The post was named after Major General Richard S. Dick, who was a veteran of the Mexican-American War. The post was used to protect the settlers in the area from Native American attacks. The post was abandoned in 1858 and the land was sold to private owners.
In the late 19th century, Fort Dick was a popular stop for travelers on the stagecoach route between Crescent City and Eureka. The town was also a popular destination for hunters and fishermen.
In the early 20th century, Fort Dick was a popular destination for tourists. The town was home to a number of resorts, including the Fort Dick Hotel, which was built in 1906. The hotel was destroyed by a fire in the 1950s.
Geography
Fort Dick is located in Del Norte County, California. It is situated on the Smith River, approximately 10 miles south of Crescent City. The town is surrounded by the Smith River National Wildlife Refuge, which is home to a variety of wildlife, including bald eagles, ospreys, and river otters.
The climate in Fort Dick is mild and temperate. The average high temperature in the summer is around 70 degrees Fahrenheit, and the average low temperature in the winter is around 40 degrees Fahrenheit.
Economy
The economy of Fort Dick is largely based on tourism. The town is home to a number of resorts, including the Fort Dick Hotel, which was built in 1906. The hotel was destroyed by a fire in the 1950s, but the town still attracts visitors who come to fish, hunt, and enjoy the natural beauty of the area.
The town is also home to a number of small businesses, including restaurants, stores, and a post office. The town is also home to a number of art galleries, which feature the work of local artists.
Demographics
The population of Fort Dick was estimated to be around 1,000 in 2020. The town is predominantly white, with a small percentage of African American, Hispanic, and Native American residents. The median household income in Fort Dick is around $50,000. The town has a high rate of poverty, with around 25% of the population living below the poverty line.
Common Questions
What is Per Capita Income in Fort Dick?
Per Capita income in Fort Dick is $33,808.
What is the Median Family Income in Fort Dick?
Median Family Income in Fort Dick is $82,031.
What is the Median Household income in Fort Dick?
Median Household Income in Fort Dick is $74,297.
What is Income or Wage Gap in Fort Dick?
Income or Wage Gap in Fort Dick is 32.5%.
Women in Fort Dick earn 67.5 cents for every dollar earned by a man.
What is Inequality or Gini Index in Fort Dick?
Inequality or Gini Index in Fort Dick is 0.31.
What is the Total Population of Fort Dick?
Total Population of Fort Dick is 1,295.
What is the Total Male Population of Fort Dick?
Total Male Population of Fort Dick is 628.
What is the Total Female Population of Fort Dick?
Total Female Population of Fort Dick is 667.
What is the Ratio of Males per 100 Females in Fort Dick?
There are 94.15 Males per 100 Females in Fort Dick.
What is the Ratio of Females per 100 Males in Fort Dick?
There are 106.21 Females per 100 Males in Fort Dick.
What is the Median Population Age in Fort Dick?
Median Population Age in Fort Dick is 54.9 Years.
What is the Average Family Size in Fort Dick
Average Family Size in Fort Dick is 2.9 People.
What is the Average Household Size in Fort Dick
Average Household Size in Fort Dick is 2.5 People.
How Large is the Labor Force in Fort Dick?
There are 458 People in the Labor Forcein in Fort Dick.
What is the Percentage of People in the Labor Force in Fort Dick?
39.9% of People are in the Labor Force in Fort Dick.
What is the Unemployment Rate in Fort Dick?
Unemployment Rate in Fort Dick is 6.3%.