Kansas Map & Demographics
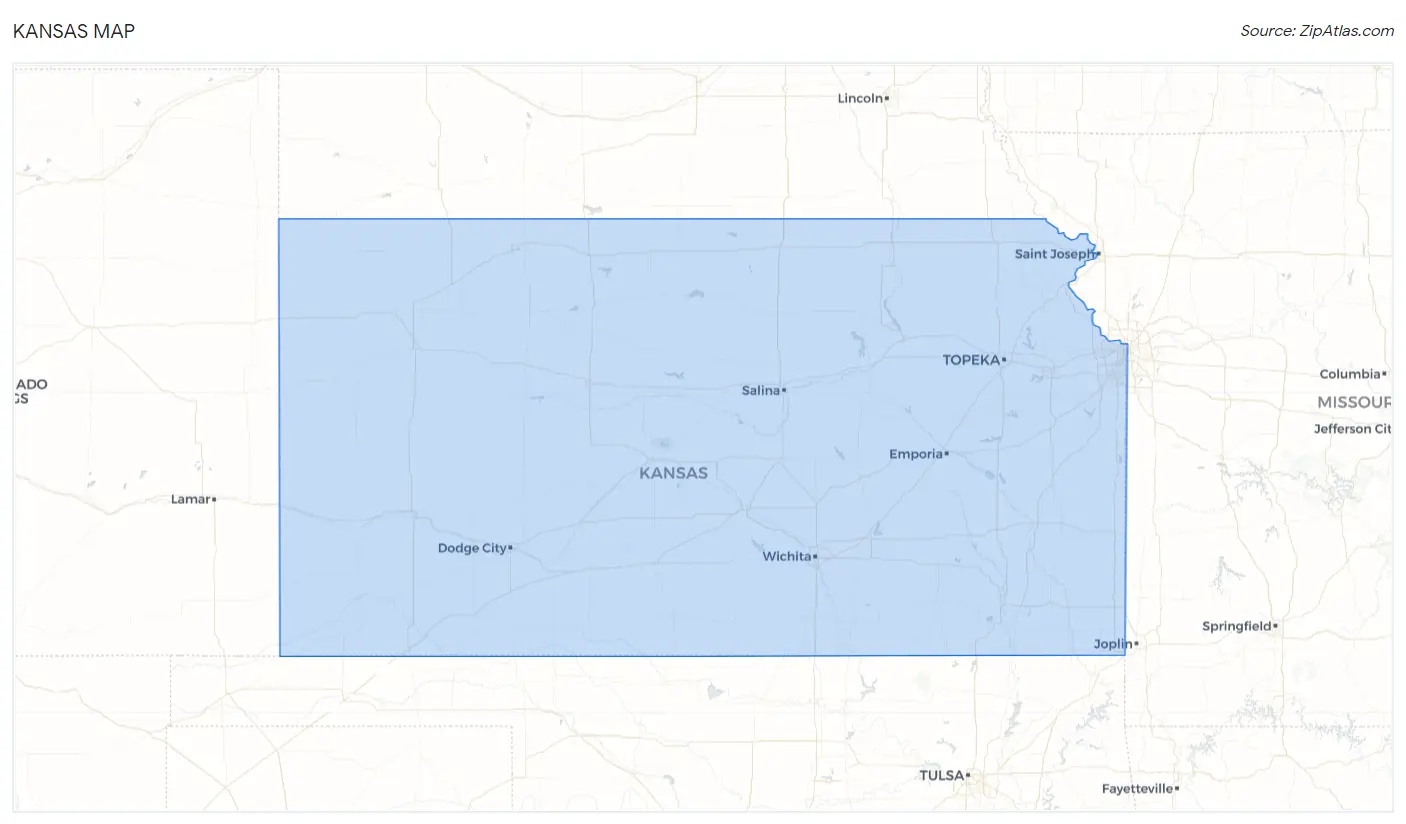
Kansas Map
Kansas Overview
Jan 29, 1861
INCORPORATED
82,278
TOTAL AREA [ SQ MI ]
81,762
LAND AREA [ SQ MI ]
516
WATER AREA [ SQ MI ]
2,000
ELEVATION AVG [ FT ]
4,039
ELEVATION HIGH [ FT ]
679
ELEVATION LOW [ FT ]
35.9
POP DENSITY [ PPL / SQ MI ]
$38,108
PER CAPITA INCOME
$89,535
AVG FAMILY INCOME
$69,747
AVG HOUSEHOLD INCOME
30.4%
WAGE / INCOME GAP [ % ]
69.6¢/ $1
WAGE / INCOME GAP [ $ ]
$10,648
FAMILY INCOME DEFICIT
0.46
INEQUALITY / GINI INDEX
66062
LARGEST ZIP CODE
Wichita
LARGEST CITY
Johnson County
LARGEST COUNTY
2,935,922
TOTAL POPULATION
1,474,948
MALE POPULATION
1,460,974
FEMALE POPULATION
100.96
MALES / 100 FEMALES
99.05
FEMALES / 100 MALES
37.1
MEDIAN AGE
3.1
AVG FAMILY SIZE
2.5
AVG HOUSEHOLD SIZE
1,532,831
LABOR FORCE [ PEOPLE ]
66.2%
PERCENT IN LABOR FORCE
4.0%
UNEMPLOYMENT RATE
Income in Kansas
Income Overview in Kansas
Per Capita Income in Kansas is $38,108, while median incomes of families and households are $89,535 and $69,747 respectively.
| Characteristic | Number | Measure |
| Per Capita Income | 2,935,922 | $38,108 |
| Median Family Income | 732,890 | $89,535 |
| Mean Family Income | 732,890 | $113,772 |
| Median Household Income | 1,148,635 | $69,747 |
| Mean Household Income | 1,148,635 | $94,263 |
| Income Deficit | 732,890 | $10,648 |
| Wage / Income Gap (%) | 2,935,922 | 30.41% |
| Wage / Income Gap ($) | 2,935,922 | 69.59¢ per $1 |
| Gini / Inequality Index | 2,935,922 | 0.46 |
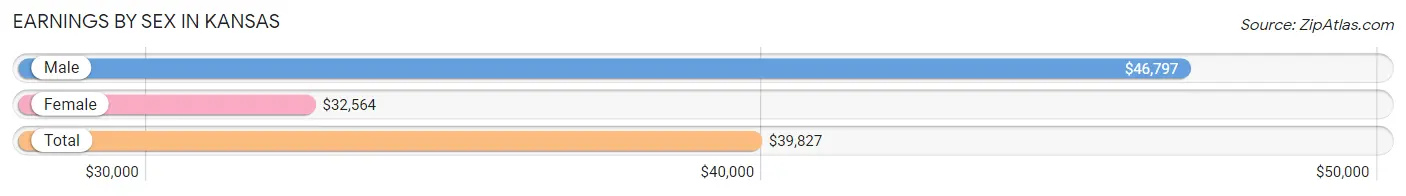
Earnings by Sex in Kansas
Average Earnings in Kansas are $39,827, $46,797 for men and $32,564 for women, a difference of 30.4%.
| Sex | Number | Average Earnings |
| Male | 868,039 (53.4%) | $46,797 |
| Female | 757,705 (46.6%) | $32,564 |
| Total | 1,625,744 (100.0%) | $39,827 |
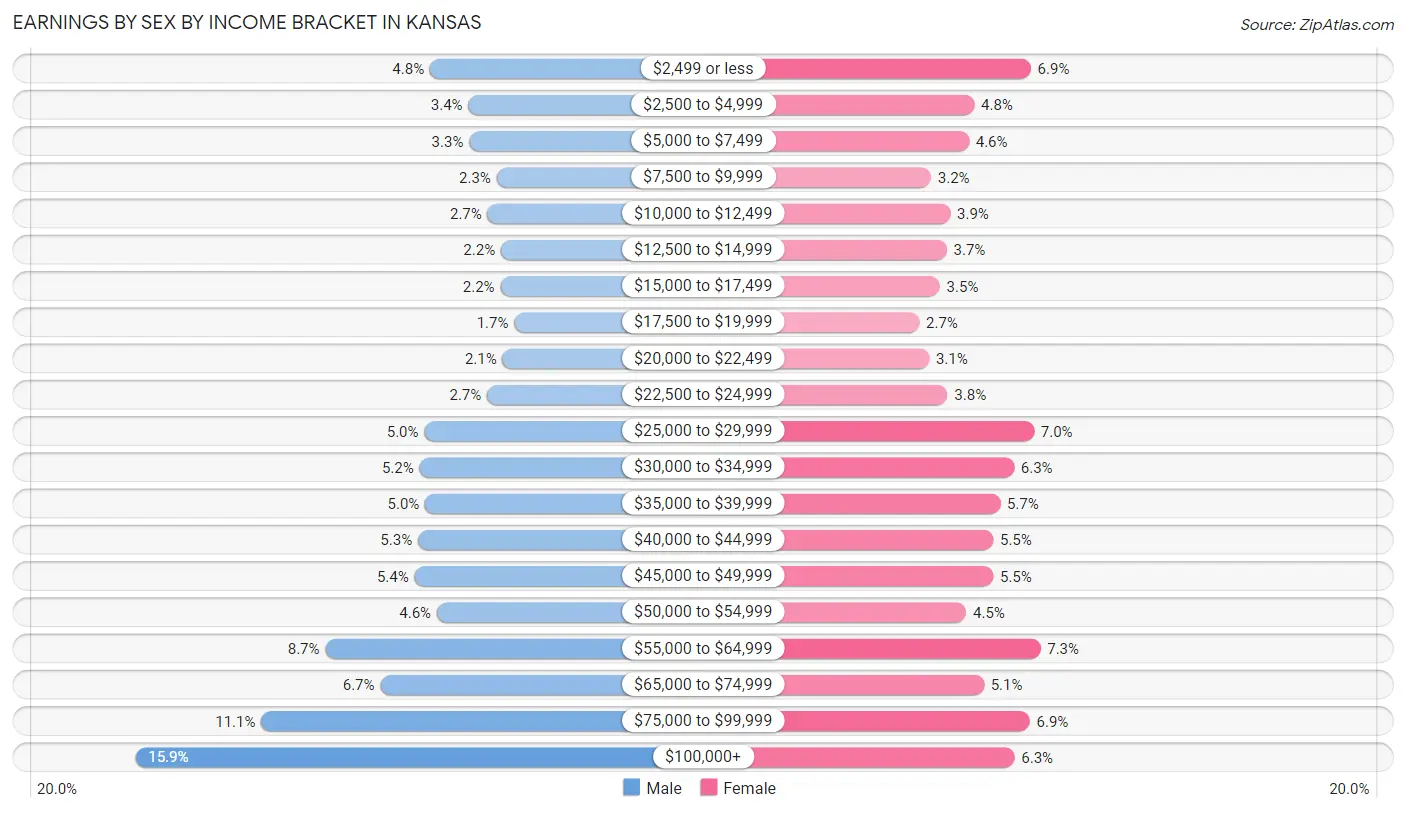
Earnings by Sex by Income Bracket in Kansas
The most common earnings brackets in Kansas are $100,000+ for men (137,582 | 15.9%) and $55,000 to $64,999 for women (54,931 | 7.2%).
| Income | Male | Female |
| $2,499 or less | 41,769 (4.8%) | 52,235 (6.9%) |
| $2,500 to $4,999 | 29,241 (3.4%) | 36,105 (4.8%) |
| $5,000 to $7,499 | 28,950 (3.3%) | 34,661 (4.6%) |
| $7,500 to $9,999 | 20,014 (2.3%) | 23,897 (3.2%) |
| $10,000 to $12,499 | 23,018 (2.6%) | 29,336 (3.9%) |
| $12,500 to $14,999 | 18,679 (2.1%) | 28,372 (3.7%) |
| $15,000 to $17,499 | 18,816 (2.2%) | 26,357 (3.5%) |
| $17,500 to $19,999 | 14,318 (1.7%) | 20,550 (2.7%) |
| $20,000 to $22,499 | 18,136 (2.1%) | 23,361 (3.1%) |
| $22,500 to $24,999 | 23,139 (2.7%) | 28,570 (3.8%) |
| $25,000 to $29,999 | 43,615 (5.0%) | 53,090 (7.0%) |
| $30,000 to $34,999 | 45,125 (5.2%) | 47,449 (6.3%) |
| $35,000 to $39,999 | 43,322 (5.0%) | 43,458 (5.7%) |
| $40,000 to $44,999 | 45,648 (5.3%) | 41,501 (5.5%) |
| $45,000 to $49,999 | 46,772 (5.4%) | 41,555 (5.5%) |
| $50,000 to $54,999 | 39,484 (4.5%) | 33,869 (4.5%) |
| $55,000 to $64,999 | 75,820 (8.7%) | 54,931 (7.2%) |
| $65,000 to $74,999 | 57,935 (6.7%) | 38,887 (5.1%) |
| $75,000 to $99,999 | 96,656 (11.1%) | 51,911 (6.9%) |
| $100,000+ | 137,582 (15.9%) | 47,610 (6.3%) |
| Total | 868,039 (100.0%) | 757,705 (100.0%) |
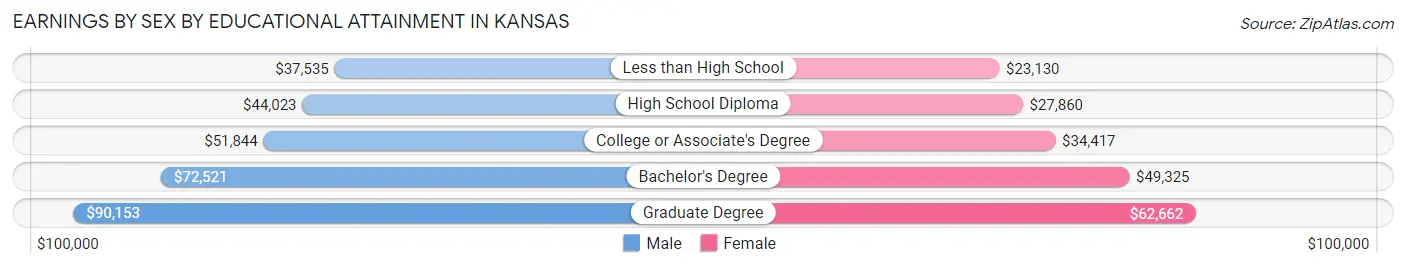
Earnings by Sex by Educational Attainment in Kansas
Average earnings in Kansas are $55,301 for men and $38,963 for women, a difference of 29.5%. Men with an educational attainment of graduate degree enjoy the highest average annual earnings of $90,153, while those with less than high school education earn the least with $37,535. Women with an educational attainment of graduate degree earn the most with the average annual earnings of $62,662, while those with less than high school education have the smallest earnings of $23,130.
| Educational Attainment | Male Income | Female Income |
| Less than High School | $37,535 | $23,130 |
| High School Diploma | $44,023 | $27,860 |
| College or Associate's Degree | $51,844 | $34,417 |
| Bachelor's Degree | $72,521 | $49,325 |
| Graduate Degree | $90,153 | $62,662 |
| Total | $55,301 | $38,963 |
Family Income in Kansas
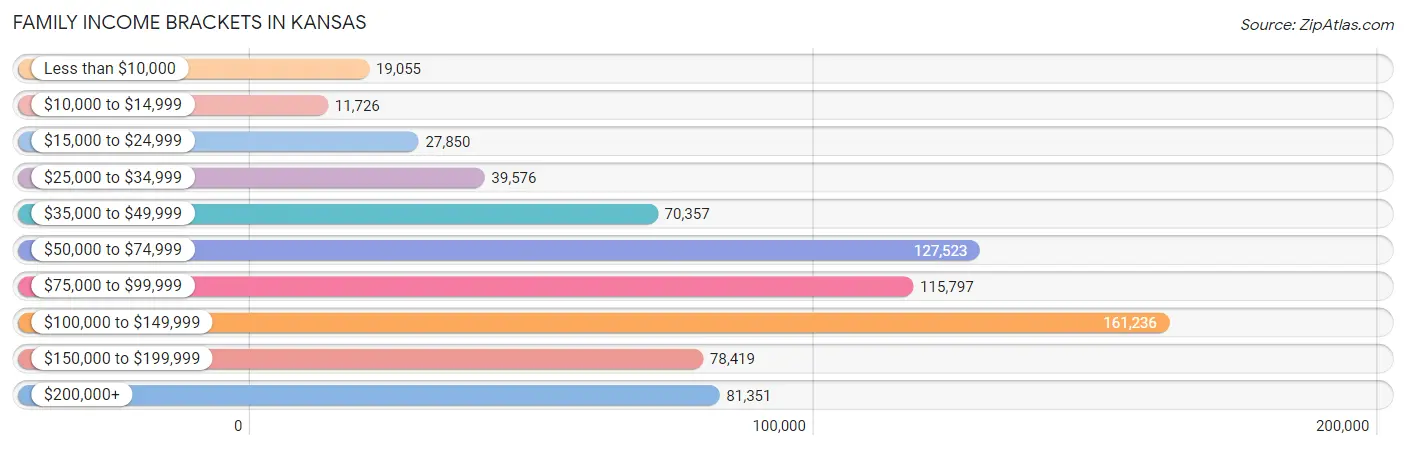
Family Income Brackets in Kansas
According to the Kansas family income data, there are 161,236 families falling into the $100,000 to $149,999 income range, which is the most common income bracket and makes up 22.0% of all families. Conversely, the $10,000 to $14,999 income bracket is the least frequent group with only 11,726 families (1.6%) belonging to this category.
| Income Bracket | # Families | % Families |
| Less than $10,000 | 19,055 | 2.6% |
| $10,000 to $14,999 | 11,726 | 1.6% |
| $15,000 to $24,999 | 27,850 | 3.8% |
| $25,000 to $34,999 | 39,576 | 5.4% |
| $35,000 to $49,999 | 70,357 | 9.6% |
| $50,000 to $74,999 | 127,523 | 17.4% |
| $75,000 to $99,999 | 115,797 | 15.8% |
| $100,000 to $149,999 | 161,236 | 22.0% |
| $150,000 to $199,999 | 78,419 | 10.7% |
| $200,000+ | 81,351 | 11.1% |
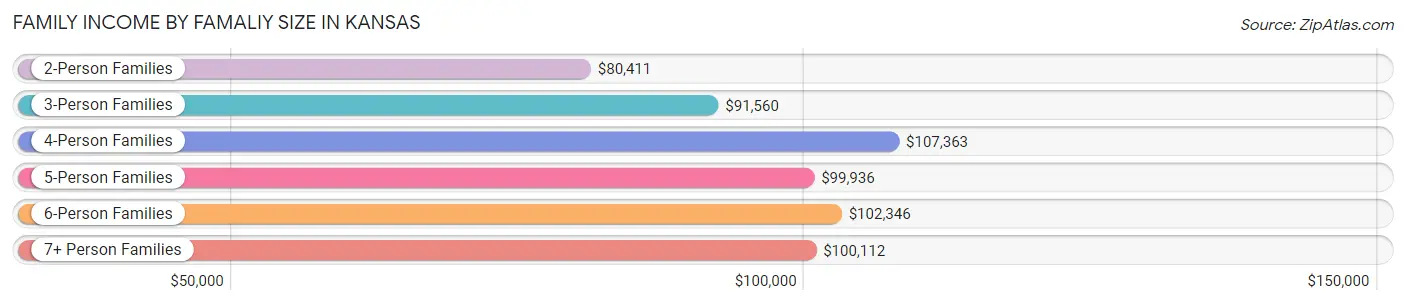
Family Income by Famaliy Size in Kansas
4-person families (127,408 | 17.4%) account for the highest median family income in Kansas with $107,363 per family, while 2-person families (362,186 | 49.4%) have the highest median income of $40,206 per family member.
| Income Bracket | # Families | Median Income |
| 2-Person Families | 362,186 (49.4%) | $80,411 |
| 3-Person Families | 144,554 (19.7%) | $91,560 |
| 4-Person Families | 127,408 (17.4%) | $107,363 |
| 5-Person Families | 62,728 (8.6%) | $99,936 |
| 6-Person Families | 23,895 (3.3%) | $102,346 |
| 7+ Person Families | 12,119 (1.7%) | $100,112 |
| Total | 732,890 (100.0%) | $89,535 |
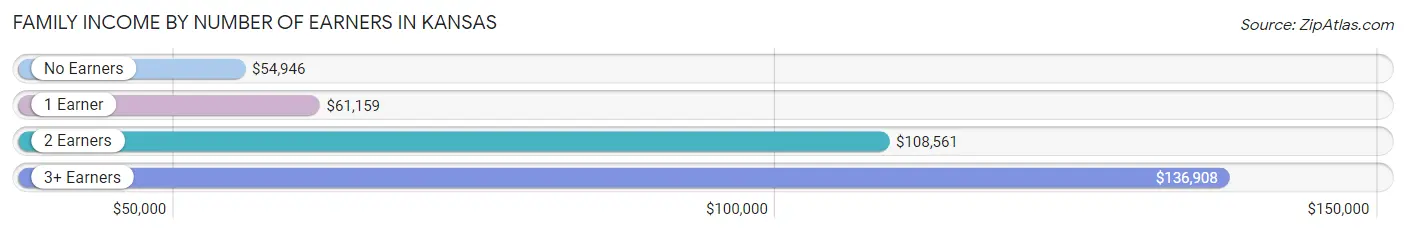
Family Income by Number of Earners in Kansas
The median family income in Kansas is $89,535, with families comprising 3+ earners (82,031) having the highest median family income of $136,908, while families with no earners (98,629) have the lowest median family income of $54,946, accounting for 11.2% and 13.5% of families, respectively.
| Number of Earners | # Families | Median Income |
| No Earners | 98,629 (13.5%) | $54,946 |
| 1 Earner | 219,473 (29.9%) | $61,159 |
| 2 Earners | 332,757 (45.4%) | $108,561 |
| 3+ Earners | 82,031 (11.2%) | $136,908 |
| Total | 732,890 (100.0%) | $89,535 |
Household Income in Kansas
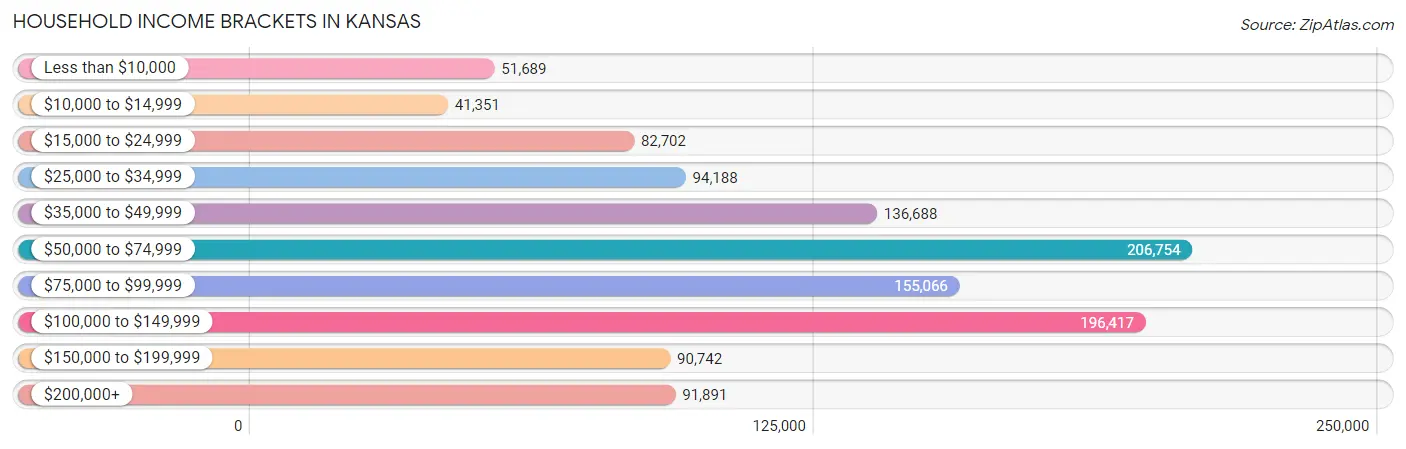
Household Income Brackets in Kansas
With 206,754 households falling in the category, the $50,000 to $74,999 income range is the most frequent in Kansas, accounting for 18.0% of all households. In contrast, only 41,351 households (3.6%) fall into the $10,000 to $14,999 income bracket, making it the least populous group.
| Income Bracket | # Households | % Households |
| Less than $10,000 | 51,689 | 4.5% |
| $10,000 to $14,999 | 41,351 | 3.6% |
| $15,000 to $24,999 | 82,702 | 7.2% |
| $25,000 to $34,999 | 94,188 | 8.2% |
| $35,000 to $49,999 | 136,688 | 11.9% |
| $50,000 to $74,999 | 206,754 | 18.0% |
| $75,000 to $99,999 | 155,066 | 13.5% |
| $100,000 to $149,999 | 196,417 | 17.1% |
| $150,000 to $199,999 | 90,742 | 7.9% |
| $200,000+ | 91,891 | 8.0% |
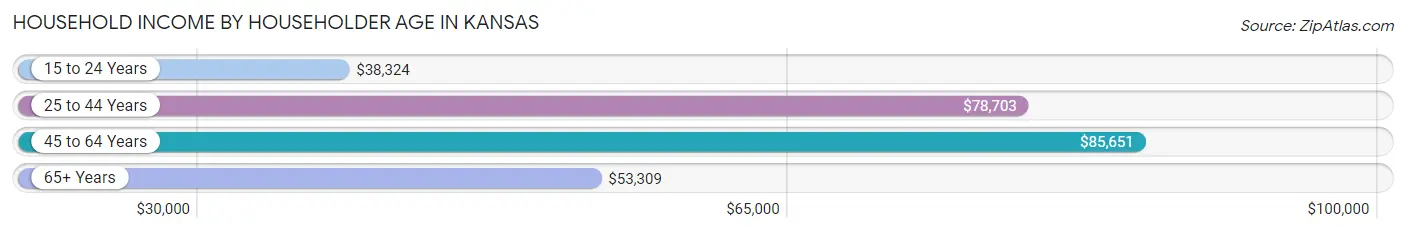
Household Income by Householder Age in Kansas
The median household income in Kansas is $69,747, with the highest median household income of $85,651 found in the 45 to 64 years age bracket for the primary householder. A total of 399,623 households (34.8%) fall into this category. Meanwhile, the 15 to 24 years age bracket for the primary householder has the lowest median household income of $38,324, with 71,398 households (6.2%) in this group.
| Income Bracket | # Households | Median Income |
| 15 to 24 Years | 71,398 (6.2%) | $38,324 |
| 25 to 44 Years | 373,833 (32.6%) | $78,703 |
| 45 to 64 Years | 399,623 (34.8%) | $85,651 |
| 65+ Years | 303,781 (26.5%) | $53,309 |
| Total | 1,148,635 (100.0%) | $69,747 |
Poverty in Kansas
Income Below Poverty by Sex and Age in Kansas
With 10.4% poverty level for males and 12.8% for females among the residents of Kansas, 18 to 24 year old males and 18 to 24 year old females are the most vulnerable to poverty, with 28,610 males (20.2%) and 35,204 females (27.1%) in their respective age groups living below the poverty level.
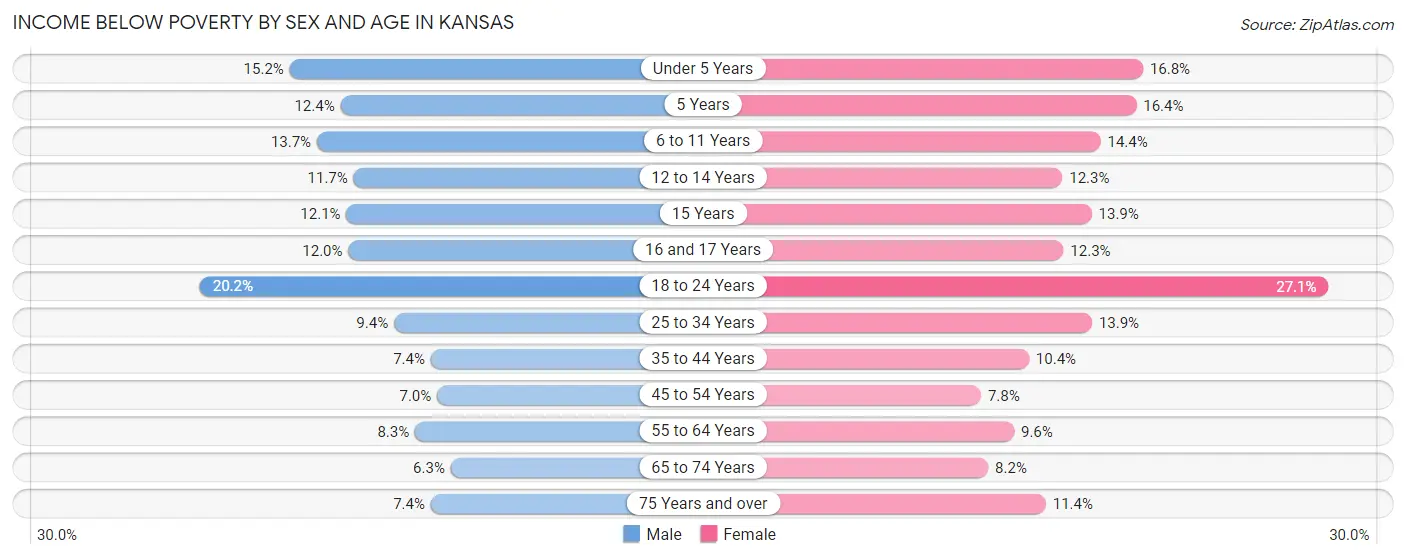
| Age Bracket | Male | Female |
| Under 5 Years | 13,890 (15.2%) | 14,379 (16.8%) |
| 5 Years | 2,479 (12.4%) | 2,849 (16.4%) |
| 6 to 11 Years | 16,355 (13.7%) | 16,231 (14.4%) |
| 12 to 14 Years | 7,225 (11.7%) | 7,492 (12.3%) |
| 15 Years | 2,540 (12.1%) | 2,727 (13.9%) |
| 16 and 17 Years | 4,926 (12.0%) | 4,859 (12.3%) |
| 18 to 24 Years | 28,610 (20.2%) | 35,204 (27.1%) |
| 25 to 34 Years | 17,708 (9.4%) | 25,261 (13.9%) |
| 35 to 44 Years | 13,610 (7.4%) | 18,739 (10.4%) |
| 45 to 54 Years | 11,653 (7.0%) | 12,576 (7.7%) |
| 55 to 64 Years | 14,902 (8.3%) | 17,752 (9.6%) |
| 65 to 74 Years | 8,330 (6.3%) | 11,674 (8.2%) |
| 75 Years and over | 5,680 (7.4%) | 12,219 (11.4%) |
| Total | 147,908 (10.4%) | 181,962 (12.8%) |
Income Above Poverty by Sex and Age in Kansas
According to the poverty statistics in Kansas, males aged 65 to 74 years and females aged 45 to 54 years are the age groups that are most secure financially, with 93.7% of males and 92.2% of females in these age groups living above the poverty line.
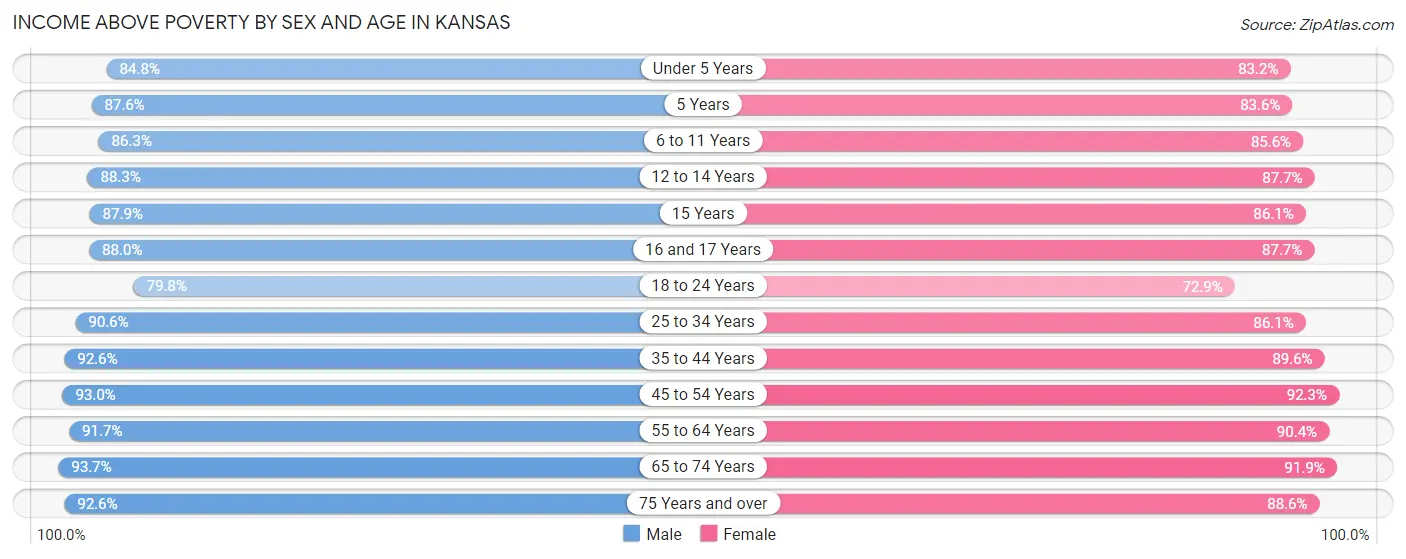
| Age Bracket | Male | Female |
| Under 5 Years | 77,235 (84.8%) | 71,359 (83.2%) |
| 5 Years | 17,489 (87.6%) | 14,524 (83.6%) |
| 6 to 11 Years | 102,820 (86.3%) | 96,369 (85.6%) |
| 12 to 14 Years | 54,608 (88.3%) | 53,515 (87.7%) |
| 15 Years | 18,480 (87.9%) | 16,879 (86.1%) |
| 16 and 17 Years | 36,221 (88.0%) | 34,507 (87.7%) |
| 18 to 24 Years | 112,718 (79.8%) | 94,726 (72.9%) |
| 25 to 34 Years | 170,016 (90.6%) | 156,067 (86.1%) |
| 35 to 44 Years | 170,714 (92.6%) | 161,076 (89.6%) |
| 45 to 54 Years | 154,026 (93.0%) | 149,680 (92.2%) |
| 55 to 64 Years | 165,415 (91.7%) | 167,282 (90.4%) |
| 65 to 74 Years | 124,596 (93.7%) | 131,506 (91.8%) |
| 75 Years and over | 71,294 (92.6%) | 95,342 (88.6%) |
| Total | 1,275,632 (89.6%) | 1,242,832 (87.2%) |
Income Below Poverty Among Married-Couple Families in Kansas
The poverty statistics for married-couple families in Kansas show that 3.8% or 22,025 of the total 571,578 families live below the poverty line. Families with 5 or more children have the highest poverty rate of 19.7%, comprising of 1,102 families. On the other hand, families with no children have the lowest poverty rate of 3.1%, which includes 10,398 families.
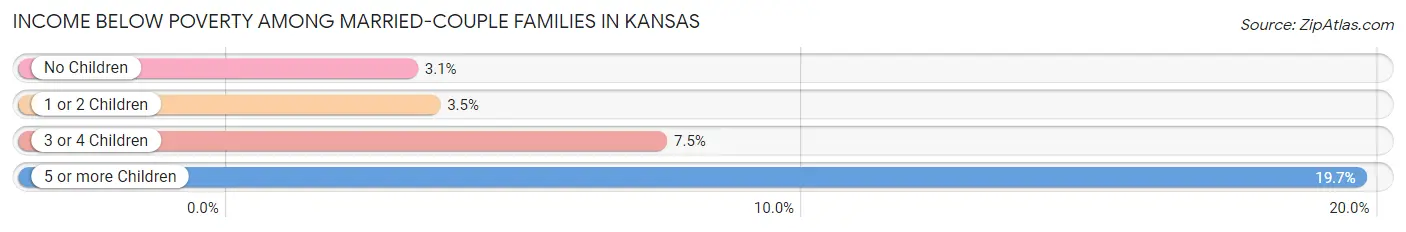
| Children | Above Poverty | Below Poverty |
| No Children | 321,750 (96.9%) | 10,398 (3.1%) |
| 1 or 2 Children | 169,639 (96.5%) | 6,192 (3.5%) |
| 3 or 4 Children | 53,662 (92.5%) | 4,333 (7.5%) |
| 5 or more Children | 4,502 (80.3%) | 1,102 (19.7%) |
| Total | 549,553 (96.2%) | 22,025 (3.8%) |
Income Below Poverty Among Single-Parent Households in Kansas
According to the poverty data in Kansas, 12.7% or 6,367 single-father households and 24.9% or 27,653 single-mother households are living below the poverty line. Among single-father households, those with 5 or more children have the highest poverty rate, with 207 households (39.4%) experiencing poverty. Likewise, among single-mother households, those with 5 or more children have the highest poverty rate, with 1,180 households (76.6%) falling below the poverty line.
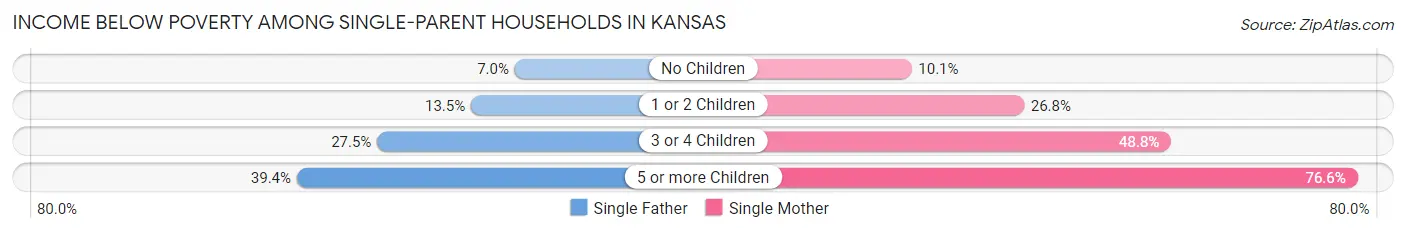
| Children | Single Father | Single Mother |
| No Children | 1,352 (7.0%) | 3,630 (10.1%) |
| 1 or 2 Children | 3,346 (13.5%) | 16,021 (26.8%) |
| 3 or 4 Children | 1,462 (27.5%) | 6,822 (48.8%) |
| 5 or more Children | 207 (39.4%) | 1,180 (76.6%) |
| Total | 6,367 (12.7%) | 27,653 (24.9%) |
Income Below Poverty Among Married-Couple vs Single-Parent Households in Kansas
The poverty data for Kansas shows that 22,025 of the married-couple family households (3.8%) and 34,020 of the single-parent households (21.1%) are living below the poverty level. Within the married-couple family households, those with 5 or more children have the highest poverty rate, with 1,102 households (19.7%) falling below the poverty line. Among the single-parent households, those with 5 or more children have the highest poverty rate, with 1,387 household (67.1%) living below poverty.
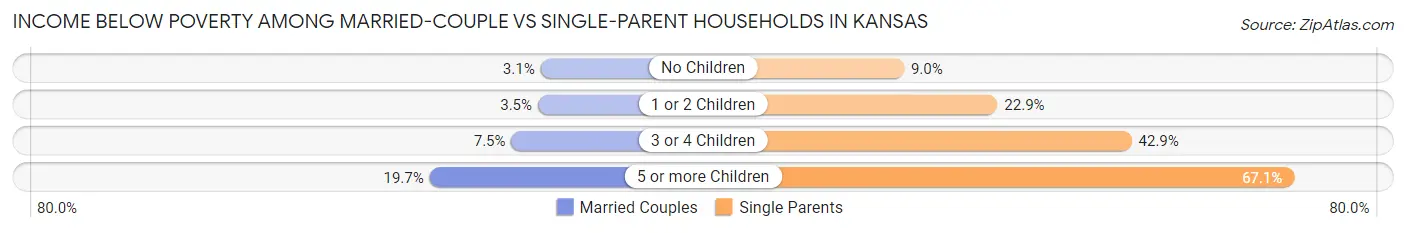
| Children | Married-Couple Families | Single-Parent Households |
| No Children | 10,398 (3.1%) | 4,982 (9.0%) |
| 1 or 2 Children | 6,192 (3.5%) | 19,367 (22.9%) |
| 3 or 4 Children | 4,333 (7.5%) | 8,284 (42.9%) |
| 5 or more Children | 1,102 (19.7%) | 1,387 (67.1%) |
| Total | 22,025 (3.8%) | 34,020 (21.1%) |
Largest Zip Codes by Population in Kansas
The largest zip codes in Kansas by population are 66062 (77,312), 66061 (66,897), 67401 (50,638), 66502 (44,813), and 67212 (44,171).
1.66062
77,312 (2.63%)
2.66061
66,897 (2.28%)
3.67401
50,638 (1.72%)
4.66502
44,813 (1.53%)
5.67212
44,171 (1.50%)
6.66048
35,970 (1.23%)
7.67846
34,584 (1.18%)
8.66614
33,080 (1.13%)
9.66212
32,806 (1.12%)
10.67217
32,184 (1.10%)
11.66049
31,608 (1.08%)
12.67801
30,935 (1.05%)
13.67203
30,358 (1.03%)
14.66213
30,270 (1.03%)
15.66102
30,237 (1.03%)
16.67037
29,459 (1.00%)
17.66044
29,006 (0.99%)
18.66109
27,934 (0.95%)
19.66104
27,663 (0.94%)
20.67207
27,432 (0.93%)
21.66801
27,416 (0.93%)
22.66215
26,001 (0.89%)
23.66030
25,625 (0.87%)
24.66441
25,582 (0.87%)
25.66223
25,217 (0.86%)
26.66216
25,051 (0.85%)
27.66762
25,006 (0.85%)
28.67501
24,491 (0.83%)
29.66221
24,434 (0.83%)
30.67601
24,045 (0.82%)
Largest Cities by Population in Kansas
The largest cities in Kansas by population are Wichita (395,951), Overland Park (196,676), Kansas City (155,438), Olathe (142,114), and Topeka (126,431).
1.Wichita
395,951 (13.49%)
196,676 (6.70%)
155,438 (5.29%)
4.Olathe
142,114 (4.84%)
5.Topeka
126,431 (4.31%)
6.Lawrence
95,103 (3.24%)
7.Shawnee
67,671 (2.30%)
8.Lenexa
57,497 (1.96%)
54,287 (1.85%)
10.Salina
46,734 (1.59%)
11.Hutchinson
39,995 (1.36%)
12.Leavenworth
37,193 (1.27%)
13.Leawood
33,784 (1.15%)
14.Garden City
27,933 (0.95%)
15.Dodge City
27,721 (0.94%)
16.Derby
25,551 (0.87%)
17.Emporia
24,118 (0.82%)
18.Gardner
23,488 (0.80%)
22,922 (0.78%)
22,738 (0.77%)
21.Hays
21,111 (0.72%)
22.Pittsburg
20,610 (0.70%)
23.Liberal
19,099 (0.65%)
24.Newton
18,527 (0.63%)
25.Andover
15,460 (0.53%)
26.Great Bend
14,725 (0.50%)
27.Mcpherson
13,955 (0.48%)
28.El Dorado
12,882 (0.44%)
29.Ottawa
12,615 (0.43%)
11,997 (0.41%)
Largest Counties by Population in Kansas
The largest counties in Kansas by population are Johnson County (610,742), Sedgwick County (522,700), Shawnee County (178,625), Wyandotte County (167,989), and Douglas County (119,094).
610,742 (20.80%)
522,700 (17.80%)
178,625 (6.08%)
167,989 (5.72%)
119,094 (4.06%)
82,050 (2.79%)
72,105 (2.46%)
67,618 (2.30%)
61,881 (2.11%)
54,160 (1.84%)
39,012 (1.33%)
38,187 (1.30%)
13.Geary County
36,247 (1.23%)
34,661 (1.18%)
15.Miami County
34,312 (1.17%)
16.Ford County
34,212 (1.17%)
33,959 (1.16%)
18.Lyon County
32,182 (1.10%)
31,448 (1.07%)
30,085 (1.02%)
21.Ellis County
28,921 (0.99%)
25,968 (0.88%)
25,482 (0.87%)
25,477 (0.87%)
22,517 (0.77%)
21,942 (0.75%)
20,096 (0.68%)
19,380 (0.66%)
18,492 (0.63%)
18,387 (0.63%)
Race in Kansas
The most populous races in Kansas are White / Caucasian (2,341,473 | 79.7%), Hispanic or Latino (369,970 | 12.6%), and Two or more Races (215,150 | 7.3%).
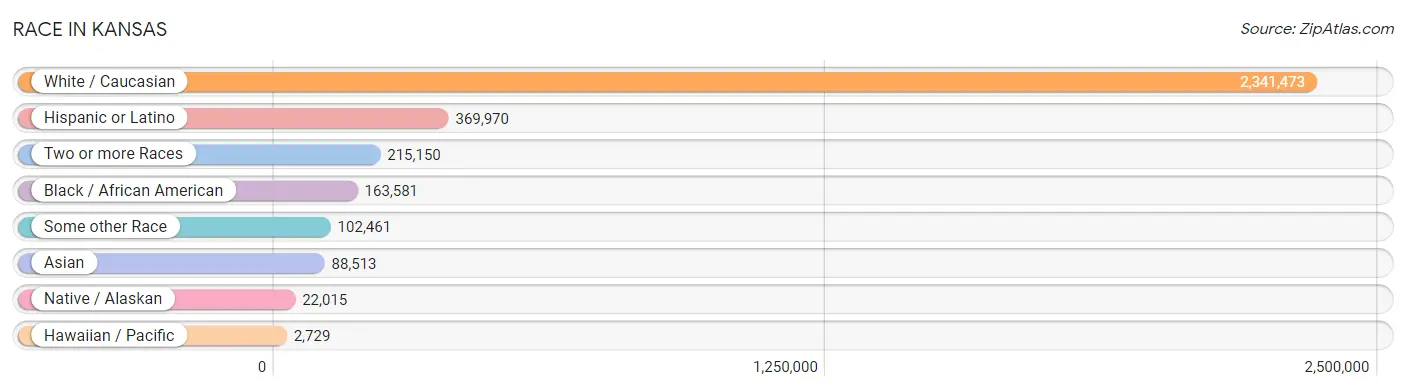
| Race | # Population | % Population |
| Asian | 88,513 | 3.0% |
| Black / African American | 163,581 | 5.6% |
| Hawaiian / Pacific | 2,729 | 0.1% |
| Hispanic or Latino | 369,970 | 12.6% |
| Native / Alaskan | 22,015 | 0.7% |
| White / Caucasian | 2,341,473 | 79.7% |
| Two or more Races | 215,150 | 7.3% |
| Some other Race | 102,461 | 3.5% |
| Total | 2,935,922 | 100.0% |
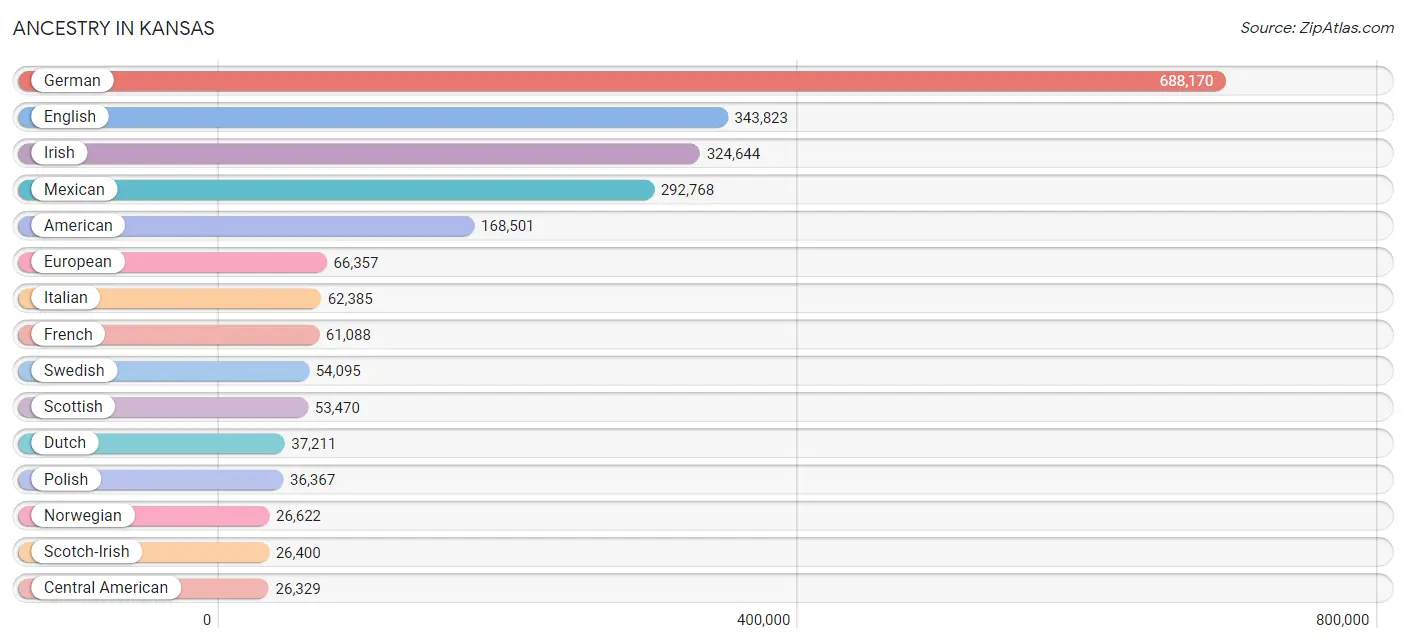
Ancestry in Kansas
The most populous ancestries reported in Kansas are German (688,170 | 23.4%), English (343,823 | 11.7%), Irish (324,644 | 11.1%), Mexican (292,768 | 10.0%), and American (168,501 | 5.7%), together accounting for 61.9% of all Kansas residents.
| Ancestry | # Population | % Population |
| Afghan | 789 | 0.0% |
| African | 11,073 | 0.4% |
| Alaska Native | 123 | 0.0% |
| Alaskan Athabascan | 28 | 0.0% |
| Albanian | 152 | 0.0% |
| Aleut | 13 | 0.0% |
| Alsatian | 67 | 0.0% |
| American | 168,501 | 5.7% |
| Apache | 1,648 | 0.1% |
| Arab | 10,330 | 0.4% |
| Arapaho | 123 | 0.0% |
| Argentinean | 1,326 | 0.1% |
| Armenian | 577 | 0.0% |
| Australian | 513 | 0.0% |
| Austrian | 5,825 | 0.2% |
| Bahamian | 28 | 0.0% |
| Bangladeshi | 3,299 | 0.1% |
| Barbadian | 114 | 0.0% |
| Basque | 143 | 0.0% |
| Belgian | 4,894 | 0.2% |
| Belizean | 36 | 0.0% |
| Bermudan | 8 | 0.0% |
| Bhutanese | 6,654 | 0.2% |
| Blackfeet | 3,320 | 0.1% |
| Bolivian | 429 | 0.0% |
| Brazilian | 1,729 | 0.1% |
| British | 17,220 | 0.6% |
| British West Indian | 31 | 0.0% |
| Bulgarian | 657 | 0.0% |
| Burmese | 8,176 | 0.3% |
| Cajun | 392 | 0.0% |
| Cambodian | 24 | 0.0% |
| Canadian | 2,874 | 0.1% |
| Cape Verdean | 17 | 0.0% |
| Carpatho Rusyn | 12 | 0.0% |
| Celtic | 576 | 0.0% |
| Central American | 26,329 | 0.9% |
| Central American Indian | 2,498 | 0.1% |
| Cherokee | 21,364 | 0.7% |
| Cheyenne | 347 | 0.0% |
| Chickasaw | 819 | 0.0% |
| Chilean | 354 | 0.0% |
| Chinese | 20 | 0.0% |
| Chippewa | 801 | 0.0% |
| Choctaw | 3,523 | 0.1% |
| Colombian | 2,314 | 0.1% |
| Colville | 7 | 0.0% |
| Comanche | 689 | 0.0% |
| Costa Rican | 435 | 0.0% |
| Cree | 197 | 0.0% |
| Creek | 1,953 | 0.1% |
| Croatian | 4,853 | 0.2% |
| Crow | 312 | 0.0% |
| Cuban | 4,775 | 0.2% |
| Cypriot | 10 | 0.0% |
| Czech | 19,866 | 0.7% |
| Czechoslovakian | 3,230 | 0.1% |
| Danish | 13,119 | 0.4% |
| Delaware | 1,119 | 0.0% |
| Dominican | 1,410 | 0.1% |
| Dutch | 37,211 | 1.3% |
| Dutch West Indian | 123 | 0.0% |
| Eastern European | 5,081 | 0.2% |
| Ecuadorian | 678 | 0.0% |
| Egyptian | 685 | 0.0% |
| English | 343,823 | 11.7% |
| Estonian | 43 | 0.0% |
| Ethiopian | 1,663 | 0.1% |
| European | 66,357 | 2.3% |
| Fijian | 217 | 0.0% |
| Filipino | 944 | 0.0% |
| Finnish | 2,075 | 0.1% |
| French | 61,088 | 2.1% |
| French American Indian | 354 | 0.0% |
| French Canadian | 7,896 | 0.3% |
| German | 688,170 | 23.4% |
| German Russian | 1,623 | 0.1% |
| Ghanaian | 720 | 0.0% |
| Greek | 4,318 | 0.2% |
| Guamanian / Chamorro | 1,007 | 0.0% |
| Guatemalan | 11,164 | 0.4% |
| Guyanese | 34 | 0.0% |
| Haitian | 1,185 | 0.0% |
| Honduran | 4,653 | 0.2% |
| Hopi | 95 | 0.0% |
| Houma | 9 | 0.0% |
| Hungarian | 5,126 | 0.2% |
| Icelander | 144 | 0.0% |
| Indian (Asian) | 17,845 | 0.6% |
| Indonesian | 4,449 | 0.2% |
| Inupiat | 59 | 0.0% |
| Iranian | 2,409 | 0.1% |
| Iraqi | 838 | 0.0% |
| Irish | 324,644 | 11.1% |
| Iroquois | 859 | 0.0% |
| Israeli | 152 | 0.0% |
| Italian | 62,385 | 2.1% |
| Jamaican | 1,575 | 0.1% |
| Japanese | 2,440 | 0.1% |
| Jordanian | 841 | 0.0% |
| Kenyan | 2,574 | 0.1% |
| Kiowa | 451 | 0.0% |
| Korean | 14,319 | 0.5% |
| Laotian | 705 | 0.0% |
| Latvian | 408 | 0.0% |
| Lebanese | 3,396 | 0.1% |
| Liberian | 60 | 0.0% |
| Lithuanian | 1,805 | 0.1% |
| Lumbee | 27 | 0.0% |
| Luxembourger | 499 | 0.0% |
| Macedonian | 65 | 0.0% |
| Malaysian | 5,467 | 0.2% |
| Maltese | 18 | 0.0% |
| Menominee | 45 | 0.0% |
| Mexican | 292,768 | 10.0% |
| Mexican American Indian | 3,066 | 0.1% |
| Mongolian | 509 | 0.0% |
| Moroccan | 339 | 0.0% |
| Native Hawaiian | 1,490 | 0.1% |
| Navajo | 1,412 | 0.1% |
| New Zealander | 106 | 0.0% |
| Nicaraguan | 1,060 | 0.0% |
| Nigerian | 1,839 | 0.1% |
| Northern European | 4,416 | 0.2% |
| Norwegian | 26,622 | 0.9% |
| Okinawan | 51 | 0.0% |
| Osage | 1,494 | 0.1% |
| Ottawa | 167 | 0.0% |
| Paiute | 33 | 0.0% |
| Pakistani | 2,570 | 0.1% |
| Palestinian | 808 | 0.0% |
| Panamanian | 993 | 0.0% |
| Paraguayan | 403 | 0.0% |
| Pennsylvania German | 2,343 | 0.1% |
| Peruvian | 1,908 | 0.1% |
| Pima | 146 | 0.0% |
| Polish | 36,367 | 1.2% |
| Portuguese | 2,528 | 0.1% |
| Potawatomi | 3,668 | 0.1% |
| Pueblo | 640 | 0.0% |
| Puerto Rican | 15,704 | 0.5% |
| Puget Sound Salish | 54 | 0.0% |
| Romanian | 1,109 | 0.0% |
| Russian | 16,922 | 0.6% |
| Salvadoran | 7,854 | 0.3% |
| Samoan | 625 | 0.0% |
| Scandinavian | 9,266 | 0.3% |
| Scotch-Irish | 26,400 | 0.9% |
| Scottish | 53,470 | 1.8% |
| Seminole | 309 | 0.0% |
| Senegalese | 468 | 0.0% |
| Serbian | 495 | 0.0% |
| Shoshone | 103 | 0.0% |
| Sioux | 2,696 | 0.1% |
| Slavic | 623 | 0.0% |
| Slovak | 1,488 | 0.1% |
| Slovene | 878 | 0.0% |
| Somali | 740 | 0.0% |
| South African | 359 | 0.0% |
| South American | 9,883 | 0.3% |
| South American Indian | 210 | 0.0% |
| Spaniard | 5,404 | 0.2% |
| Spanish | 4,097 | 0.1% |
| Spanish American | 158 | 0.0% |
| Spanish American Indian | 30 | 0.0% |
| Sri Lankan | 20,120 | 0.7% |
| Subsaharan African | 21,696 | 0.7% |
| Sudanese | 515 | 0.0% |
| Swedish | 54,095 | 1.8% |
| Swiss | 12,006 | 0.4% |
| Syrian | 539 | 0.0% |
| Thai | 21,370 | 0.7% |
| Tlingit-Haida | 122 | 0.0% |
| Tohono O'Odham | 205 | 0.0% |
| Tongan | 78 | 0.0% |
| Trinidadian and Tobagonian | 91 | 0.0% |
| Tsimshian | 42 | 0.0% |
| Turkish | 660 | 0.0% |
| U.S. Virgin Islander | 6 | 0.0% |
| Ugandan | 242 | 0.0% |
| Ukrainian | 4,095 | 0.1% |
| Uruguayan | 233 | 0.0% |
| Ute | 83 | 0.0% |
| Venezuelan | 2,063 | 0.1% |
| Vietnamese | 801 | 0.0% |
| Welsh | 20,595 | 0.7% |
| West Indian | 536 | 0.0% |
| Yakama | 12 | 0.0% |
| Yaqui | 84 | 0.0% |
| Yugoslavian | 459 | 0.0% |
| Yuman | 49 | 0.0% |
| Yup'ik | 74 | 0.0% |
| Zimbabwean | 33 | 0.0% | View All 193 Rows |
Immigrants in Kansas
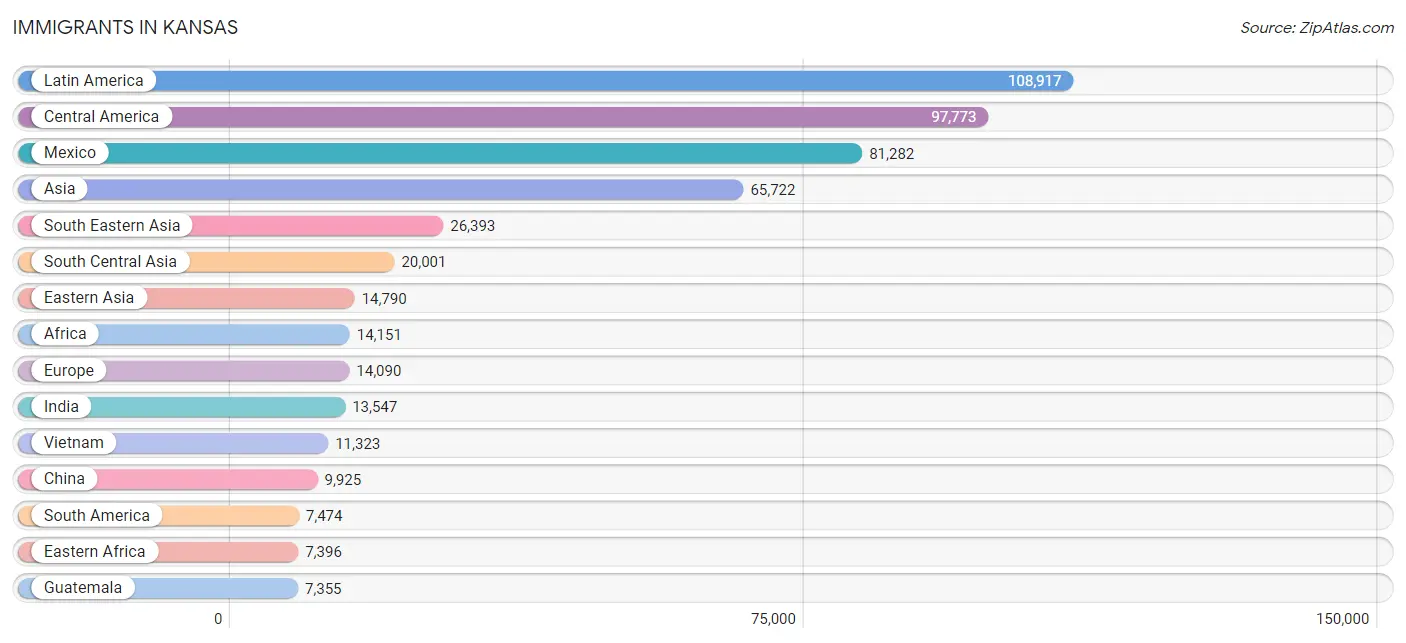
The most numerous immigrant groups reported in Kansas came from Latin America (108,917 | 3.7%), Central America (97,773 | 3.3%), Mexico (81,282 | 2.8%), Asia (65,722 | 2.2%), and South Eastern Asia (26,393 | 0.9%), together accounting for 13.0% of all Kansas residents.
| Immigration Origin | # Population | % Population |
| Afghanistan | 577 | 0.0% |
| Africa | 14,151 | 0.5% |
| Albania | 50 | 0.0% |
| Argentina | 292 | 0.0% |
| Armenia | 7 | 0.0% |
| Asia | 65,722 | 2.2% |
| Australia | 343 | 0.0% |
| Austria | 49 | 0.0% |
| Azores | 12 | 0.0% |
| Bahamas | 51 | 0.0% |
| Bangladesh | 1,150 | 0.0% |
| Barbados | 33 | 0.0% |
| Belarus | 96 | 0.0% |
| Belgium | 156 | 0.0% |
| Belize | 28 | 0.0% |
| Bolivia | 214 | 0.0% |
| Bosnia and Herzegovina | 90 | 0.0% |
| Brazil | 1,963 | 0.1% |
| Bulgaria | 364 | 0.0% |
| Cambodia | 688 | 0.0% |
| Cameroon | 157 | 0.0% |
| Canada | 2,585 | 0.1% |
| Caribbean | 3,670 | 0.1% |
| Central America | 97,773 | 3.3% |
| Chile | 159 | 0.0% |
| China | 9,925 | 0.3% |
| Colombia | 1,031 | 0.0% |
| Congo | 601 | 0.0% |
| Costa Rica | 228 | 0.0% |
| Croatia | 37 | 0.0% |
| Cuba | 1,540 | 0.1% |
| Czechoslovakia | 174 | 0.0% |
| Denmark | 31 | 0.0% |
| Dominica | 1 | 0.0% |
| Dominican Republic | 493 | 0.0% |
| Eastern Africa | 7,396 | 0.3% |
| Eastern Asia | 14,790 | 0.5% |
| Eastern Europe | 4,995 | 0.2% |
| Ecuador | 770 | 0.0% |
| Egypt | 497 | 0.0% |
| El Salvador | 4,488 | 0.2% |
| England | 1,646 | 0.1% |
| Eritrea | 295 | 0.0% |
| Ethiopia | 1,901 | 0.1% |
| Europe | 14,090 | 0.5% |
| Fiji | 101 | 0.0% |
| France | 575 | 0.0% |
| Germany | 3,349 | 0.1% |
| Ghana | 668 | 0.0% |
| Greece | 66 | 0.0% |
| Guatemala | 7,355 | 0.3% |
| Guyana | 28 | 0.0% |
| Haiti | 841 | 0.0% |
| Honduras | 3,353 | 0.1% |
| Hong Kong | 510 | 0.0% |
| Hungary | 255 | 0.0% |
| India | 13,547 | 0.5% |
| Indonesia | 432 | 0.0% |
| Iran | 1,401 | 0.1% |
| Iraq | 1,022 | 0.0% |
| Ireland | 179 | 0.0% |
| Israel | 143 | 0.0% |
| Italy | 355 | 0.0% |
| Jamaica | 469 | 0.0% |
| Japan | 1,520 | 0.1% |
| Jordan | 651 | 0.0% |
| Kazakhstan | 115 | 0.0% |
| Kenya | 3,322 | 0.1% |
| Korea | 3,345 | 0.1% |
| Kuwait | 436 | 0.0% |
| Laos | 3,082 | 0.1% |
| Latin America | 108,917 | 3.7% |
| Latvia | 80 | 0.0% |
| Lebanon | 794 | 0.0% |
| Liberia | 48 | 0.0% |
| Lithuania | 6 | 0.0% |
| Malaysia | 638 | 0.0% |
| Mexico | 81,282 | 2.8% |
| Micronesia | 715 | 0.0% |
| Middle Africa | 1,133 | 0.0% |
| Moldova | 335 | 0.0% |
| Morocco | 129 | 0.0% |
| Nepal | 1,155 | 0.0% |
| Netherlands | 363 | 0.0% |
| Nicaragua | 487 | 0.0% |
| Nigeria | 1,058 | 0.0% |
| Northern Africa | 1,685 | 0.1% |
| Northern Europe | 3,614 | 0.1% |
| Norway | 103 | 0.0% |
| Oceania | 1,811 | 0.1% |
| Pakistan | 1,185 | 0.0% |
| Panama | 410 | 0.0% |
| Peru | 830 | 0.0% |
| Philippines | 5,492 | 0.2% |
| Poland | 238 | 0.0% |
| Portugal | 76 | 0.0% |
| Romania | 475 | 0.0% |
| Russia | 1,310 | 0.0% |
| Saudi Arabia | 407 | 0.0% |
| Scotland | 193 | 0.0% |
| Senegal | 397 | 0.0% |
| Serbia | 86 | 0.0% |
| Sierra Leone | 70 | 0.0% |
| Singapore | 151 | 0.0% |
| Somalia | 334 | 0.0% |
| South Africa | 651 | 0.0% |
| South America | 7,474 | 0.3% |
| South Central Asia | 20,001 | 0.7% |
| South Eastern Asia | 26,393 | 0.9% |
| Southern Europe | 926 | 0.0% |
| Spain | 429 | 0.0% |
| Sri Lanka | 339 | 0.0% |
| Sudan | 489 | 0.0% |
| Sweden | 31 | 0.0% |
| Switzerland | 44 | 0.0% |
| Syria | 225 | 0.0% |
| Taiwan | 1,362 | 0.1% |
| Thailand | 1,732 | 0.1% |
| Trinidad and Tobago | 62 | 0.0% |
| Turkey | 324 | 0.0% |
| Uganda | 419 | 0.0% |
| Ukraine | 950 | 0.0% |
| Uruguay | 82 | 0.0% |
| Uzbekistan | 96 | 0.0% |
| Venezuela | 1,695 | 0.1% |
| Vietnam | 11,323 | 0.4% |
| West Indies | 11 | 0.0% |
| Western Africa | 2,542 | 0.1% |
| Western Asia | 4,423 | 0.2% |
| Western Europe | 4,555 | 0.2% |
| Yemen | 24 | 0.0% |
| Zaire | 277 | 0.0% |
| Zimbabwe | 147 | 0.0% | View All 133 Rows |
Sex and Age in Kansas
Sex and Age in Kansas
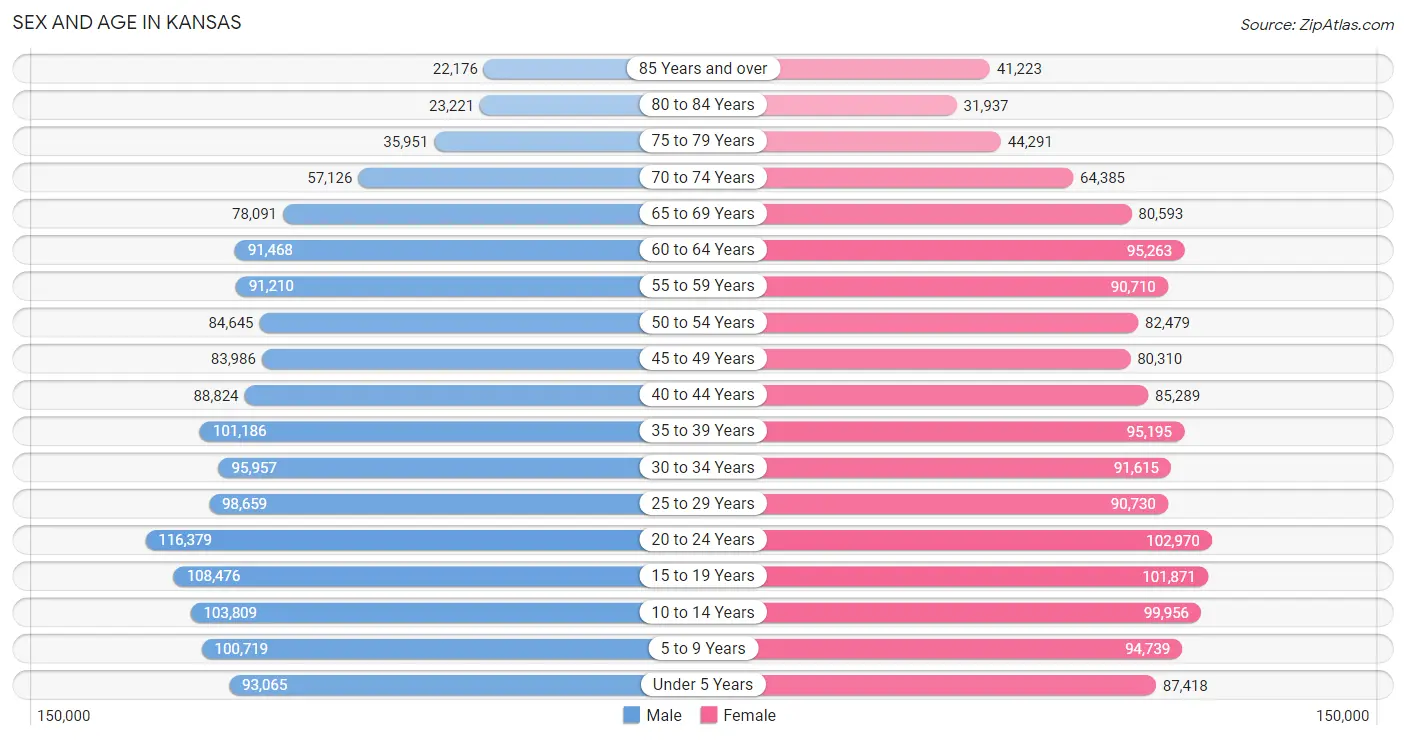
The most populous age groups in Kansas are 20 to 24 Years (116,379 | 7.9%) for men and 20 to 24 Years (102,970 | 7.0%) for women.
| Age Bracket | Male | Female |
| Under 5 Years | 93,065 (6.3%) | 87,418 (6.0%) |
| 5 to 9 Years | 100,719 (6.8%) | 94,739 (6.5%) |
| 10 to 14 Years | 103,809 (7.0%) | 99,956 (6.8%) |
| 15 to 19 Years | 108,476 (7.3%) | 101,871 (7.0%) |
| 20 to 24 Years | 116,379 (7.9%) | 102,970 (7.0%) |
| 25 to 29 Years | 98,659 (6.7%) | 90,730 (6.2%) |
| 30 to 34 Years | 95,957 (6.5%) | 91,615 (6.3%) |
| 35 to 39 Years | 101,186 (6.9%) | 95,195 (6.5%) |
| 40 to 44 Years | 88,824 (6.0%) | 85,289 (5.8%) |
| 45 to 49 Years | 83,986 (5.7%) | 80,310 (5.5%) |
| 50 to 54 Years | 84,645 (5.7%) | 82,479 (5.7%) |
| 55 to 59 Years | 91,210 (6.2%) | 90,710 (6.2%) |
| 60 to 64 Years | 91,468 (6.2%) | 95,263 (6.5%) |
| 65 to 69 Years | 78,091 (5.3%) | 80,593 (5.5%) |
| 70 to 74 Years | 57,126 (3.9%) | 64,385 (4.4%) |
| 75 to 79 Years | 35,951 (2.4%) | 44,291 (3.0%) |
| 80 to 84 Years | 23,221 (1.6%) | 31,937 (2.2%) |
| 85 Years and over | 22,176 (1.5%) | 41,223 (2.8%) |
| Total | 1,474,948 (100.0%) | 1,460,974 (100.0%) |
Families and Households in Kansas
Median Family Size in Kansas
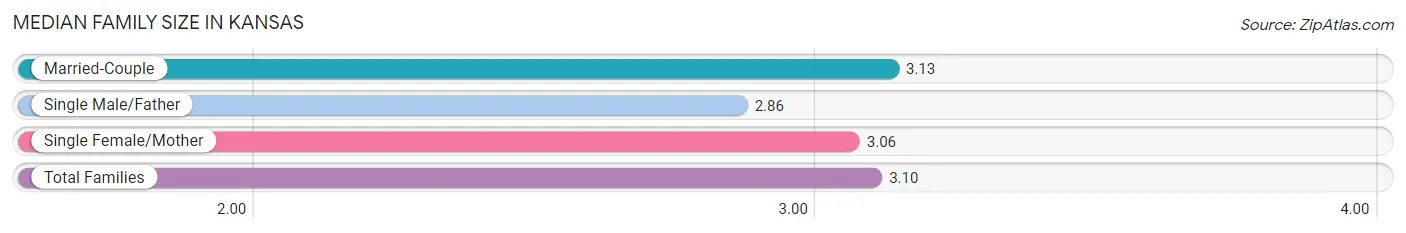
The median family size in Kansas is 3.10 persons per family, with married-couple families (571,578 | 78.0%) accounting for the largest median family size of 3.13 persons per family. On the other hand, single male/father families (50,136 | 6.8%) represent the smallest median family size with 2.86 persons per family.
| Family Type | # Families | Family Size |
| Married-Couple | 571,578 (78.0%) | 3.13 |
| Single Male/Father | 50,136 (6.8%) | 2.86 |
| Single Female/Mother | 111,176 (15.2%) | 3.06 |
| Total Families | 732,890 (100.0%) | 3.10 |
Median Household Size in Kansas
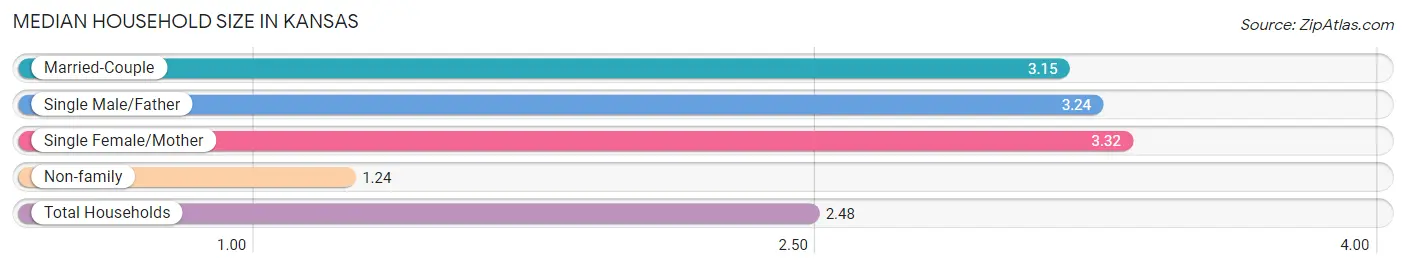
The median household size in Kansas is 2.48 persons per household, with single female/mother households (111,176 | 9.7%) accounting for the largest median household size of 3.32 persons per household. non-family households (415,745 | 36.2%) represent the smallest median household size with 1.24 persons per household.
| Household Type | # Households | Household Size |
| Married-Couple | 571,578 (49.8%) | 3.15 |
| Single Male/Father | 50,136 (4.4%) | 3.24 |
| Single Female/Mother | 111,176 (9.7%) | 3.32 |
| Non-family | 415,745 (36.2%) | 1.24 |
| Total Households | 1,148,635 (100.0%) | 2.48 |
Household Size by Marriage Status in Kansas
Out of a total of 1,148,635 households in Kansas, 732,890 (63.8%) are family households, while 415,745 (36.2%) are nonfamily households. The most numerous type of family households are 2-person households, comprising 341,848, and the most common type of nonfamily households are 1-person households, comprising 341,267.
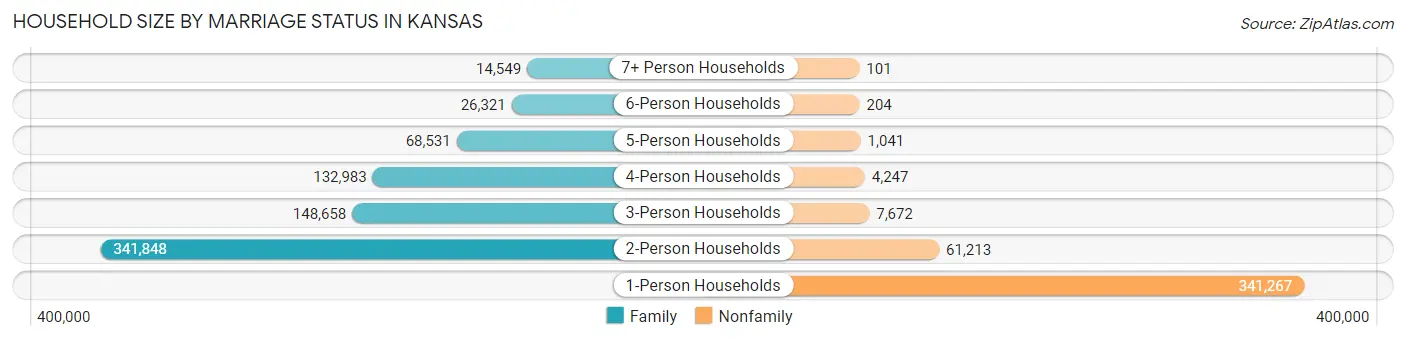
| Household Size | Family Households | Nonfamily Households |
| 1-Person Households | - | 341,267 (29.7%) |
| 2-Person Households | 341,848 (29.8%) | 61,213 (5.3%) |
| 3-Person Households | 148,658 (12.9%) | 7,672 (0.7%) |
| 4-Person Households | 132,983 (11.6%) | 4,247 (0.4%) |
| 5-Person Households | 68,531 (6.0%) | 1,041 (0.1%) |
| 6-Person Households | 26,321 (2.3%) | 204 (0.0%) |
| 7+ Person Households | 14,549 (1.3%) | 101 (0.0%) |
| Total | 732,890 (63.8%) | 415,745 (36.2%) |
Female Fertility in Kansas
Fertility by Age in Kansas
Average fertility rate in Kansas is 60.0 births per 1,000 women. Women in the age bracket of 20 to 34 years have the highest fertility rate with 104.0 births per 1,000 women. Women in the age bracket of 20 to 34 years acount for 74.6% of all women with births.
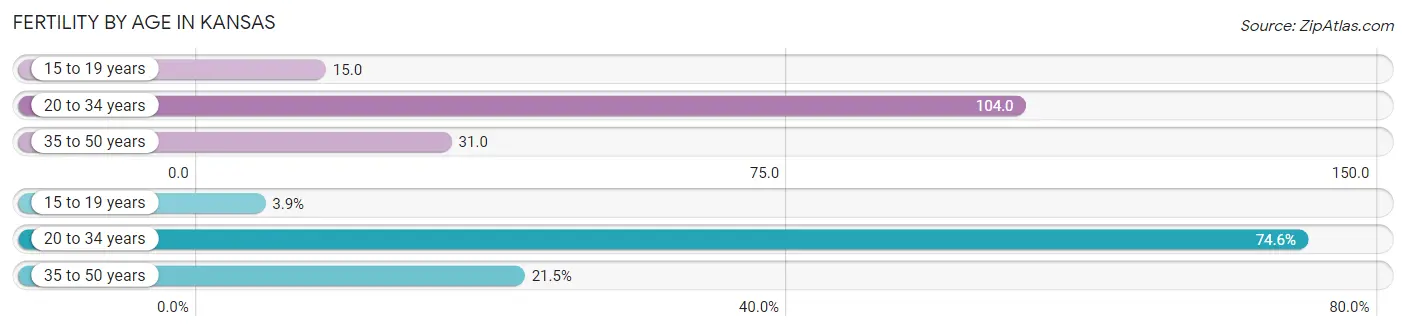
| Age Bracket | Women with Births | Births / 1,000 Women |
| 15 to 19 years | 1,546 (3.9%) | 15.0 |
| 20 to 34 years | 29,693 (74.6%) | 104.0 |
| 35 to 50 years | 8,550 (21.5%) | 31.0 |
| Total | 39,789 (100.0%) | 60.0 |
Fertility by Age by Marriage Status in Kansas
71.5% of women with births (39,789) in Kansas are married. The highest percentage of unmarried women with births falls into 15 to 19 years age bracket with 79.7% of them unmarried at the time of birth, while the lowest percentage of unmarried women with births belong to 35 to 50 years age bracket with 16.8% of them unmarried.
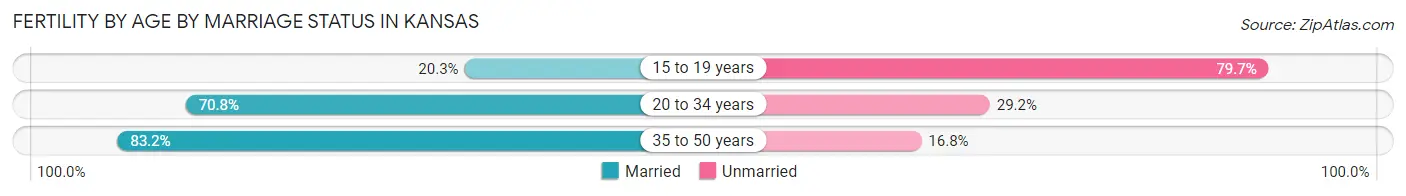
| Age Bracket | Married | Unmarried |
| 15 to 19 years | 314 (20.3%) | 1,232 (79.7%) |
| 20 to 34 years | 21,023 (70.8%) | 8,670 (29.2%) |
| 35 to 50 years | 7,114 (83.2%) | 1,436 (16.8%) |
| Total | 28,449 (71.5%) | 11,340 (28.5%) |
Fertility by Education in Kansas
Average fertility rate in Kansas is 60.0 births per 1,000 women. Women with the education attainment of graduate degree have the highest fertility rate of 74.0 births per 1,000 women, while women with the education attainment of less than high school have the lowest fertility at 36.0 births per 1,000 women. Women with the education attainment of college or associate's degree represent 30.7% of all women with births.
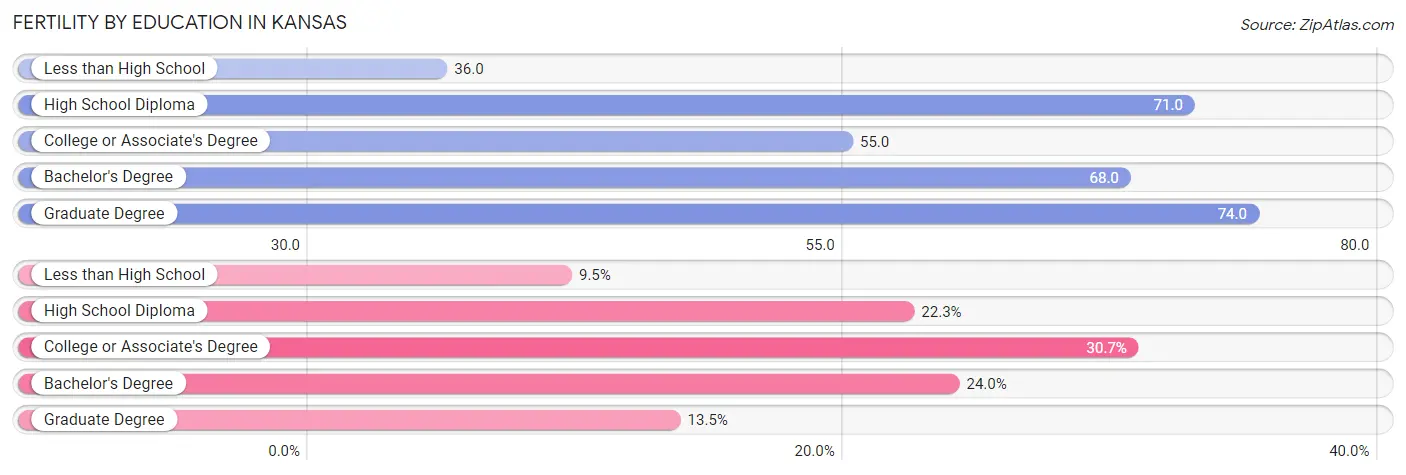
| Educational Attainment | Women with Births | Births / 1,000 Women |
| Less than High School | 3,767 (9.5%) | 36.0 |
| High School Diploma | 8,874 (22.3%) | 71.0 |
| College or Associate's Degree | 12,215 (30.7%) | 55.0 |
| Bachelor's Degree | 9,547 (24.0%) | 68.0 |
| Graduate Degree | 5,386 (13.5%) | 74.0 |
| Total | 39,789 (100.0%) | 60.0 |
Fertility by Education by Marriage Status in Kansas
28.5% of women with births in Kansas are unmarried. Women with the educational attainment of graduate degree are most likely to be married with 94.3% of them married at childbirth, while women with the educational attainment of high school diploma are least likely to be married with 47.7% of them unmarried at childbirth.
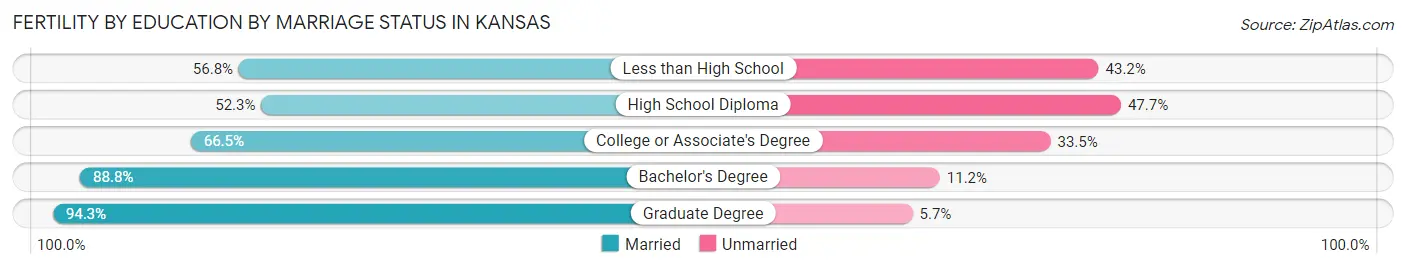
| Educational Attainment | Married | Unmarried |
| Less than High School | 2,140 (56.8%) | 1,627 (43.2%) |
| High School Diploma | 4,641 (52.3%) | 4,233 (47.7%) |
| College or Associate's Degree | 8,123 (66.5%) | 4,092 (33.5%) |
| Bachelor's Degree | 8,478 (88.8%) | 1,069 (11.2%) |
| Graduate Degree | 5,079 (94.3%) | 307 (5.7%) |
| Total | 28,449 (71.5%) | 11,340 (28.5%) |
Employment Characteristics in Kansas
Employment by Class of Employer in Kansas
Among the 1,445,477 employed individuals in Kansas, private company employees (942,199 | 65.2%), local government employees (117,718 | 8.1%), and not-for-profit organizations (117,702 | 8.1%) make up the most common classes of employment.
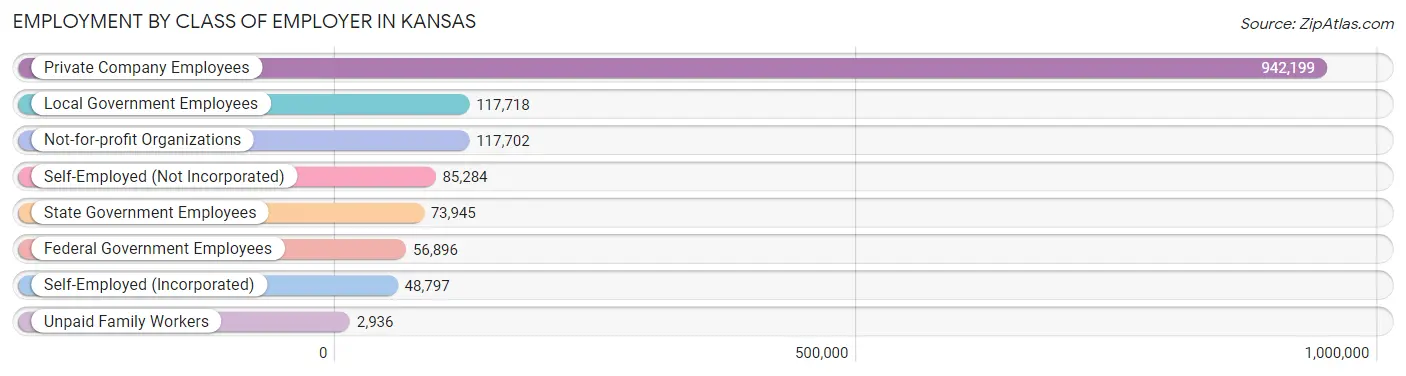
| Employer Class | # Employees | % Employees |
| Private Company Employees | 942,199 | 65.2% |
| Self-Employed (Incorporated) | 48,797 | 3.4% |
| Self-Employed (Not Incorporated) | 85,284 | 5.9% |
| Not-for-profit Organizations | 117,702 | 8.1% |
| Local Government Employees | 117,718 | 8.1% |
| State Government Employees | 73,945 | 5.1% |
| Federal Government Employees | 56,896 | 3.9% |
| Unpaid Family Workers | 2,936 | 0.2% |
| Total | 1,445,477 | 100.0% |
Employment Status by Age in Kansas
According to the labor force statistics for Kansas, out of the total population over 16 years of age (2,315,454), 66.2% or 1,532,831 individuals are in the labor force, with 4.0% or 61,313 of them unemployed. The age group with the highest labor force participation rate is 25 to 29 years, with 85.4% or 161,738 individuals in the labor force. Within the labor force, the 16 to 19 years age range has the highest percentage of unemployed individuals, with 12.6% or 10,727 of them being unemployed.
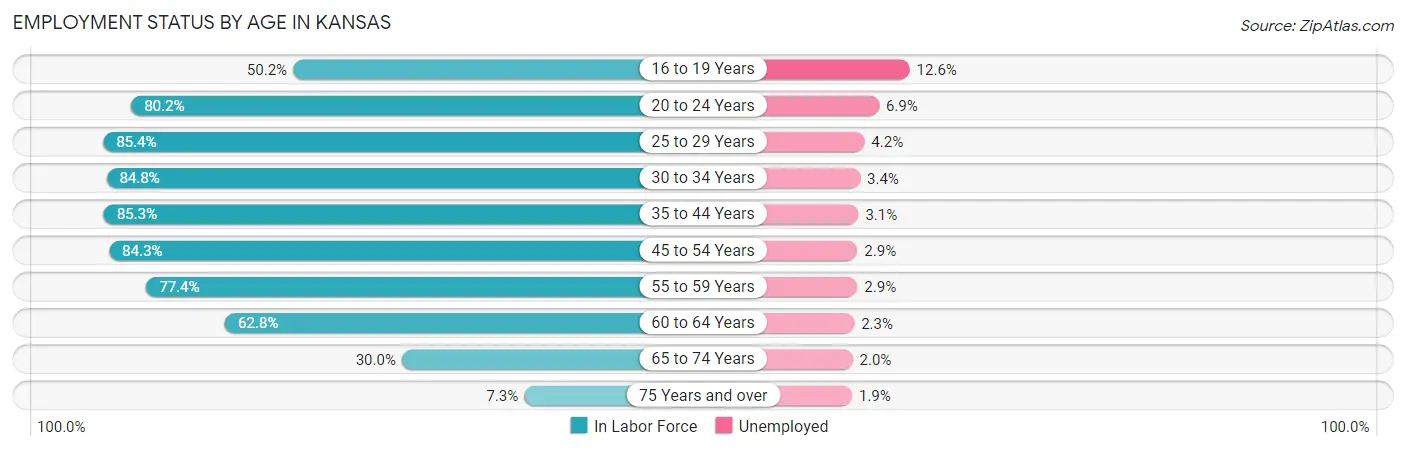
| Age Bracket | In Labor Force | Unemployed |
| 16 to 19 Years | 85,132 (50.2%) | 10,727 (12.6%) |
| 20 to 24 Years | 175,918 (80.2%) | 12,138 (6.9%) |
| 25 to 29 Years | 161,738 (85.4%) | 6,793 (4.2%) |
| 30 to 34 Years | 159,061 (84.8%) | 5,408 (3.4%) |
| 35 to 44 Years | 316,031 (85.3%) | 9,797 (3.1%) |
| 45 to 54 Years | 279,387 (84.3%) | 8,102 (2.9%) |
| 55 to 59 Years | 140,806 (77.4%) | 4,083 (2.9%) |
| 60 to 64 Years | 117,267 (62.8%) | 2,697 (2.3%) |
| 65 to 74 Years | 84,058 (30.0%) | 1,681 (2.0%) |
| 75 Years and over | 14,512 (7.3%) | 276 (1.9%) |
| Total | 1,532,831 (66.2%) | 61,313 (4.0%) |
Employment Status by Educational Attainment in Kansas
According to labor force statistics for Kansas, 81.1% of individuals (1,173,944) out of the total population between 25 and 64 years of age (1,447,526) are in the labor force, with 3.1% or 36,392 of them being unemployed. The group with the highest labor force participation rate are those with the educational attainment of bachelor's degree or higher, with 88.1% or 459,655 individuals in the labor force. Within the labor force, individuals with less than high school education have the highest percentage of unemployment, with 6.5% or 5,208 of them being unemployed.
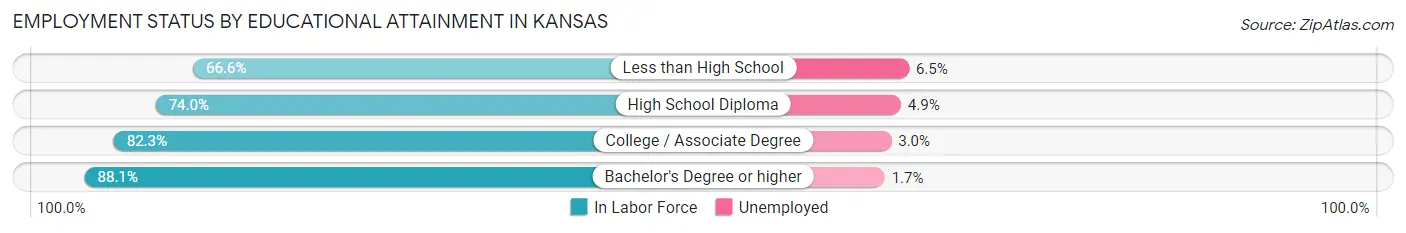
| Educational Attainment | In Labor Force | Unemployed |
| Less than High School | 80,130 (66.6%) | 7,821 (6.5%) |
| High School Diploma | 254,009 (74.0%) | 16,820 (4.9%) |
| College / Associate Degree | 380,400 (82.3%) | 13,866 (3.0%) |
| Bachelor's Degree or higher | 459,655 (88.1%) | 8,870 (1.7%) |
| Total | 1,173,944 (81.1%) | 44,873 (3.1%) |
Employment Occupations by Sex in Kansas
Management, Business, Science and Arts Occupations
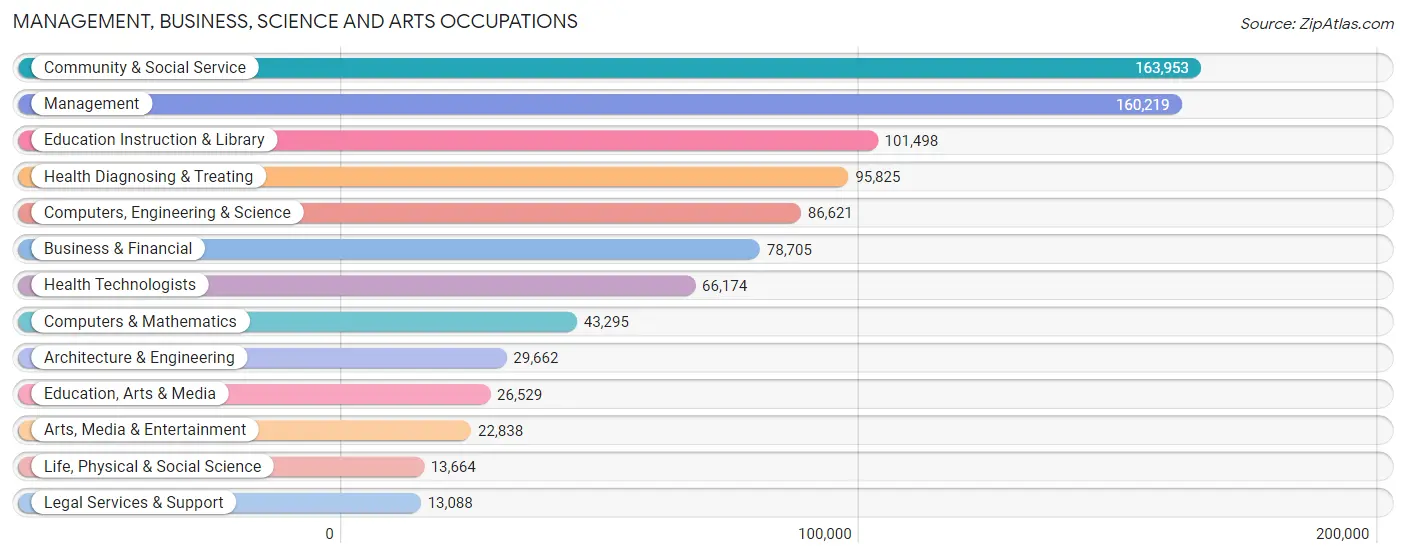
The most common Management, Business, Science and Arts occupations in Kansas are Community & Social Service (163,953 | 11.3%), Management (160,219 | 11.0%), Education Instruction & Library (101,498 | 7.0%), Health Diagnosing & Treating (95,825 | 6.6%), and Computers, Engineering & Science (86,621 | 6.0%).
Management, Business, Science and Arts Occupations by Sex
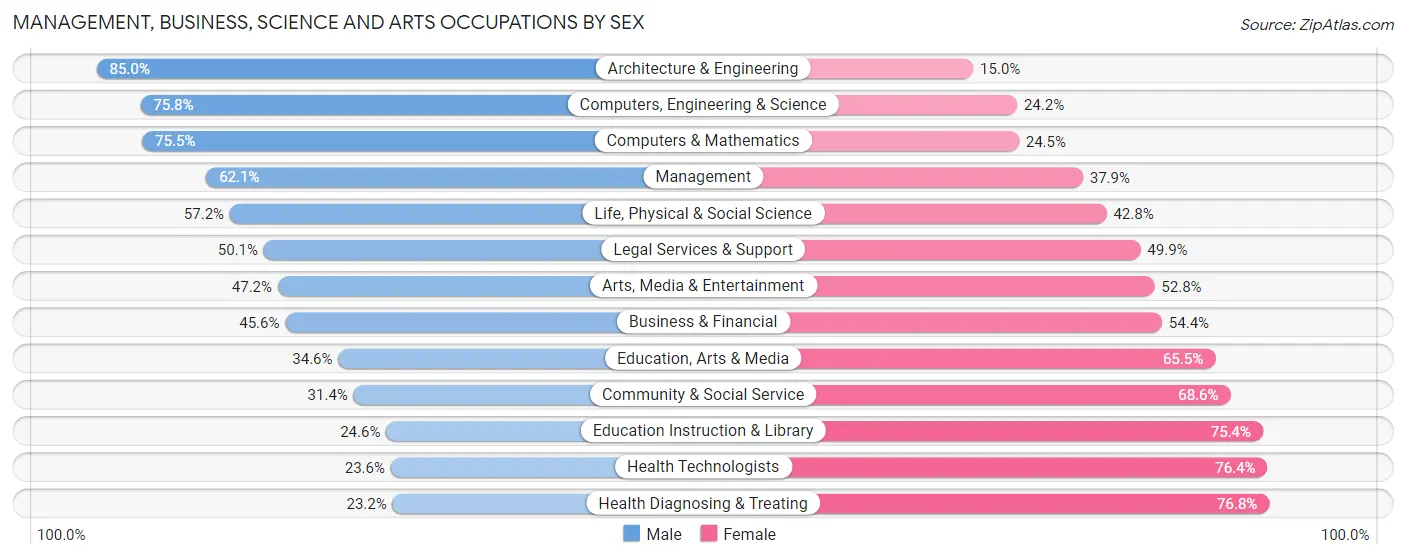
Within the Management, Business, Science and Arts occupations in Kansas, the most male-oriented occupations are Architecture & Engineering (85.0%), Computers, Engineering & Science (75.8%), and Computers & Mathematics (75.5%), while the most female-oriented occupations are Health Diagnosing & Treating (76.8%), Health Technologists (76.4%), and Education Instruction & Library (75.4%).
| Occupation | Male | Female |
| Management | 99,511 (62.1%) | 60,708 (37.9%) |
| Business & Financial | 35,899 (45.6%) | 42,806 (54.4%) |
| Computers, Engineering & Science | 65,695 (75.8%) | 20,926 (24.2%) |
| Computers & Mathematics | 32,676 (75.5%) | 10,619 (24.5%) |
| Architecture & Engineering | 25,207 (85.0%) | 4,455 (15.0%) |
| Life, Physical & Social Science | 7,812 (57.2%) | 5,852 (42.8%) |
| Community & Social Service | 51,422 (31.4%) | 112,531 (68.6%) |
| Education, Arts & Media | 9,165 (34.5%) | 17,364 (65.4%) |
| Legal Services & Support | 6,556 (50.1%) | 6,532 (49.9%) |
| Education Instruction & Library | 24,929 (24.6%) | 76,569 (75.4%) |
| Arts, Media & Entertainment | 10,772 (47.2%) | 12,066 (52.8%) |
| Health Diagnosing & Treating | 22,272 (23.2%) | 73,553 (76.8%) |
| Health Technologists | 15,622 (23.6%) | 50,552 (76.4%) |
| Total (Category) | 274,799 (46.9%) | 310,524 (53.0%) |
| Total (Overall) | 769,207 (52.9%) | 683,663 (47.1%) |
Services Occupations
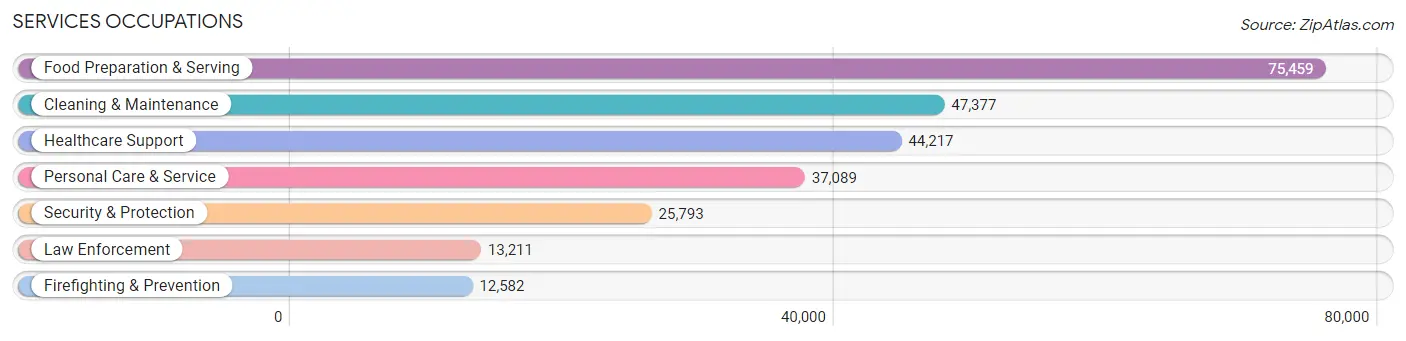
The most common Services occupations in Kansas are Food Preparation & Serving (75,459 | 5.2%), Cleaning & Maintenance (47,377 | 3.3%), Healthcare Support (44,217 | 3.0%), Personal Care & Service (37,089 | 2.5%), and Security & Protection (25,793 | 1.8%).
Services Occupations by Sex
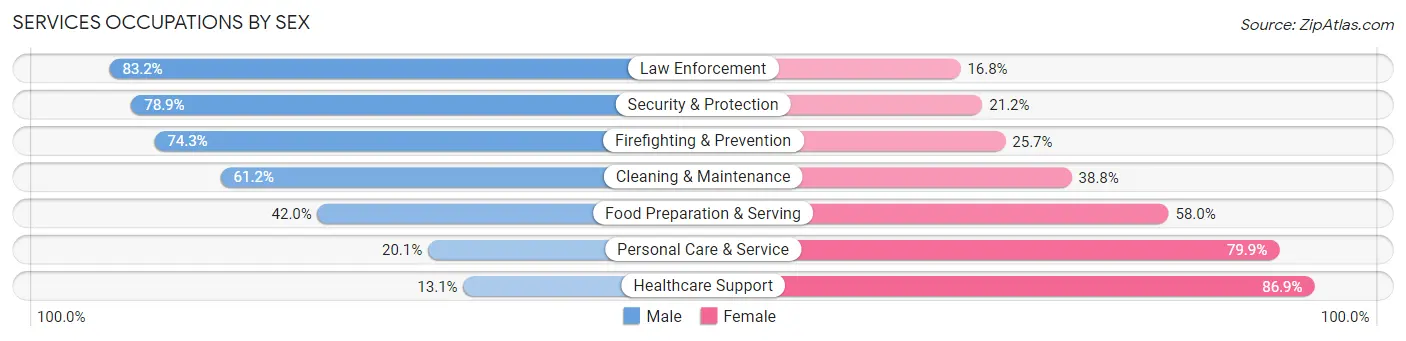
Within the Services occupations in Kansas, the most male-oriented occupations are Law Enforcement (83.2%), Security & Protection (78.8%), and Firefighting & Prevention (74.3%), while the most female-oriented occupations are Healthcare Support (86.9%), Personal Care & Service (79.9%), and Food Preparation & Serving (58.0%).
| Occupation | Male | Female |
| Healthcare Support | 5,796 (13.1%) | 38,421 (86.9%) |
| Security & Protection | 20,337 (78.8%) | 5,456 (21.1%) |
| Firefighting & Prevention | 9,347 (74.3%) | 3,235 (25.7%) |
| Law Enforcement | 10,990 (83.2%) | 2,221 (16.8%) |
| Food Preparation & Serving | 31,677 (42.0%) | 43,782 (58.0%) |
| Cleaning & Maintenance | 28,980 (61.2%) | 18,397 (38.8%) |
| Personal Care & Service | 7,458 (20.1%) | 29,631 (79.9%) |
| Total (Category) | 94,248 (41.0%) | 135,687 (59.0%) |
| Total (Overall) | 769,207 (52.9%) | 683,663 (47.1%) |
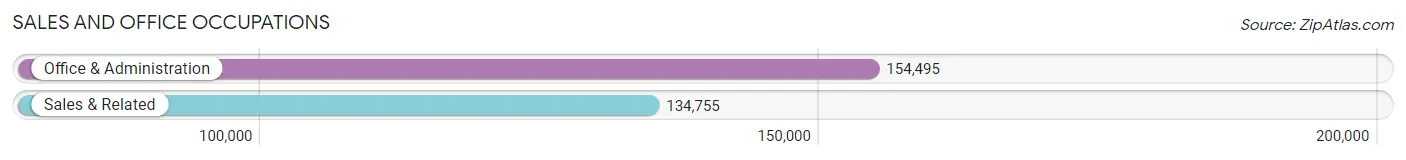
Sales and Office Occupations
The most common Sales and Office occupations in Kansas are Office & Administration (154,495 | 10.6%), and Sales & Related (134,755 | 9.3%).
Sales and Office Occupations by Sex
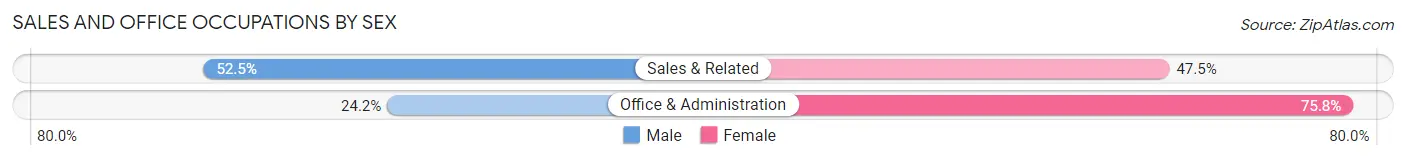
| Occupation | Male | Female |
| Sales & Related | 70,710 (52.5%) | 64,045 (47.5%) |
| Office & Administration | 37,429 (24.2%) | 117,066 (75.8%) |
| Total (Category) | 108,139 (37.4%) | 181,111 (62.6%) |
| Total (Overall) | 769,207 (52.9%) | 683,663 (47.1%) |
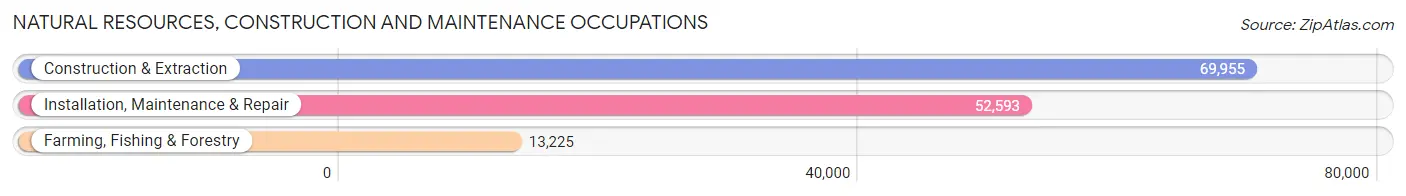
Natural Resources, Construction and Maintenance Occupations
The most common Natural Resources, Construction and Maintenance occupations in Kansas are Construction & Extraction (69,955 | 4.8%), Installation, Maintenance & Repair (52,593 | 3.6%), and Farming, Fishing & Forestry (13,225 | 0.9%).
Natural Resources, Construction and Maintenance Occupations by Sex
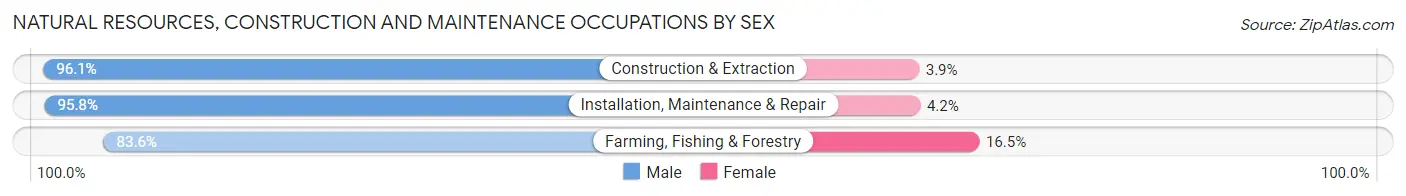
| Occupation | Male | Female |
| Farming, Fishing & Forestry | 11,049 (83.6%) | 2,176 (16.5%) |
| Construction & Extraction | 67,212 (96.1%) | 2,743 (3.9%) |
| Installation, Maintenance & Repair | 50,401 (95.8%) | 2,192 (4.2%) |
| Total (Category) | 128,662 (94.8%) | 7,111 (5.2%) |
| Total (Overall) | 769,207 (52.9%) | 683,663 (47.1%) |
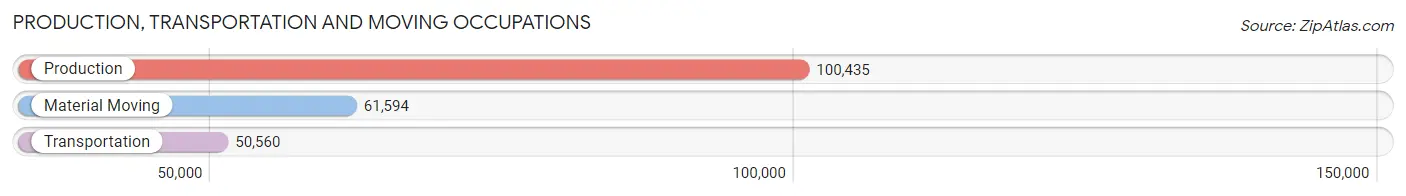
Production, Transportation and Moving Occupations
The most common Production, Transportation and Moving occupations in Kansas are Production (100,435 | 6.9%), Material Moving (61,594 | 4.2%), and Transportation (50,560 | 3.5%).
Production, Transportation and Moving Occupations by Sex
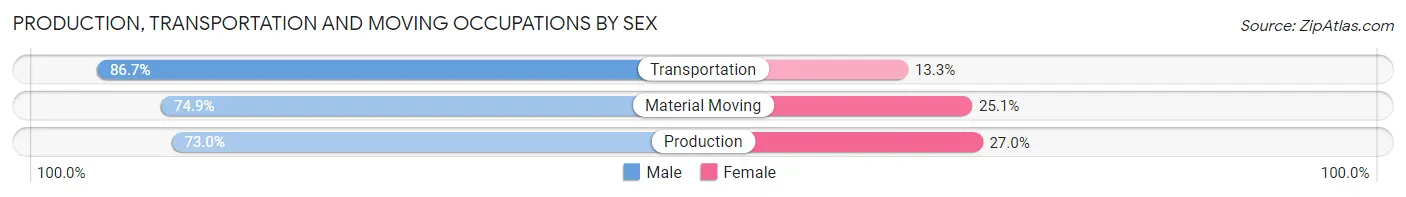
| Occupation | Male | Female |
| Production | 73,358 (73.0%) | 27,077 (27.0%) |
| Transportation | 43,840 (86.7%) | 6,720 (13.3%) |
| Material Moving | 46,161 (74.9%) | 15,433 (25.1%) |
| Total (Category) | 163,359 (76.8%) | 49,230 (23.2%) |
| Total (Overall) | 769,207 (52.9%) | 683,663 (47.1%) |
Employment Industries by Sex in Kansas
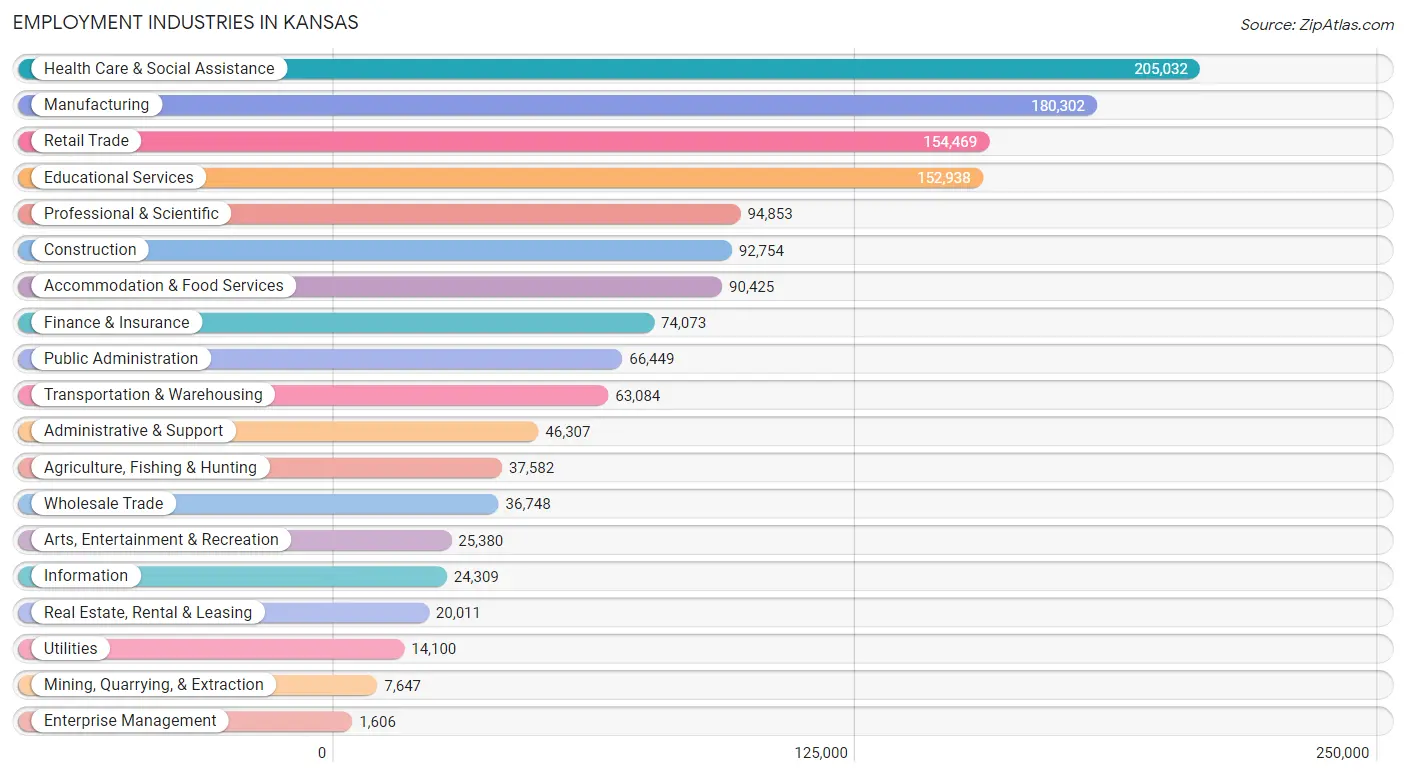
Employment Industries in Kansas
The major employment industries in Kansas include Health Care & Social Assistance (205,032 | 14.1%), Manufacturing (180,302 | 12.4%), Retail Trade (154,469 | 10.6%), Educational Services (152,938 | 10.5%), and Professional & Scientific (94,853 | 6.5%).
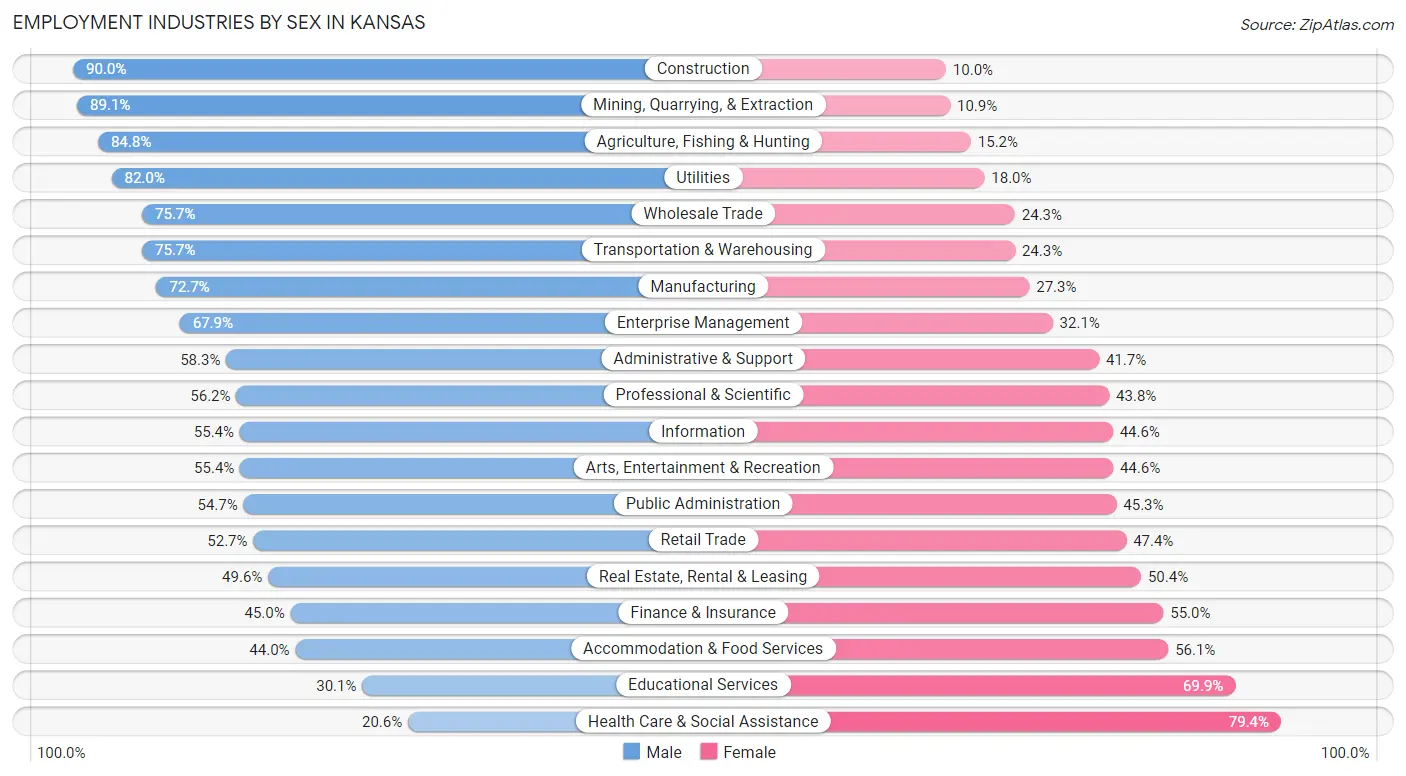
Employment Industries by Sex in Kansas
The Kansas industries that see more men than women are Construction (90.0%), Mining, Quarrying, & Extraction (89.1%), and Agriculture, Fishing & Hunting (84.8%), whereas the industries that tend to have a higher number of women are Health Care & Social Assistance (79.4%), Educational Services (69.9%), and Accommodation & Food Services (56.0%).
| Industry | Male | Female |
| Agriculture, Fishing & Hunting | 31,870 (84.8%) | 5,712 (15.2%) |
| Mining, Quarrying, & Extraction | 6,814 (89.1%) | 833 (10.9%) |
| Construction | 83,450 (90.0%) | 9,304 (10.0%) |
| Manufacturing | 131,095 (72.7%) | 49,207 (27.3%) |
| Wholesale Trade | 27,816 (75.7%) | 8,932 (24.3%) |
| Retail Trade | 81,324 (52.6%) | 73,145 (47.3%) |
| Transportation & Warehousing | 47,738 (75.7%) | 15,346 (24.3%) |
| Utilities | 11,562 (82.0%) | 2,538 (18.0%) |
| Information | 13,477 (55.4%) | 10,832 (44.6%) |
| Finance & Insurance | 33,306 (45.0%) | 40,767 (55.0%) |
| Real Estate, Rental & Leasing | 9,924 (49.6%) | 10,087 (50.4%) |
| Professional & Scientific | 53,277 (56.2%) | 41,576 (43.8%) |
| Enterprise Management | 1,090 (67.9%) | 516 (32.1%) |
| Administrative & Support | 26,978 (58.3%) | 19,329 (41.7%) |
| Educational Services | 46,034 (30.1%) | 106,904 (69.9%) |
| Health Care & Social Assistance | 42,322 (20.6%) | 162,710 (79.4%) |
| Arts, Entertainment & Recreation | 14,055 (55.4%) | 11,325 (44.6%) |
| Accommodation & Food Services | 39,742 (44.0%) | 50,683 (56.0%) |
| Public Administration | 36,335 (54.7%) | 30,114 (45.3%) |
| Total | 769,207 (52.9%) | 683,663 (47.1%) |
Education in Kansas
School Enrollment in Kansas
The most common levels of schooling among the 759,427 students in Kansas are high school (161,180 | 21.2%), middle school (160,509 | 21.1%), and college / undergraduate (159,327 | 21.0%).
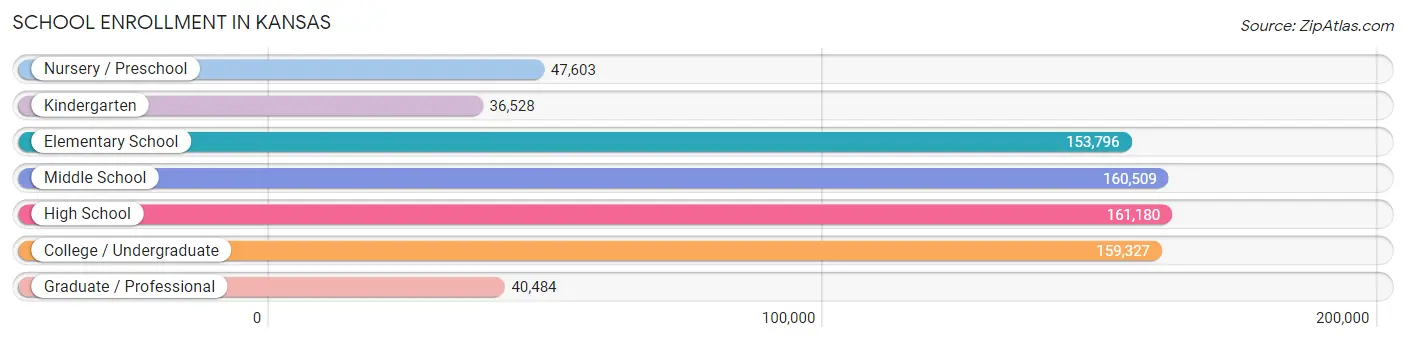
| School Level | # Students | % Students |
| Nursery / Preschool | 47,603 | 6.3% |
| Kindergarten | 36,528 | 4.8% |
| Elementary School | 153,796 | 20.3% |
| Middle School | 160,509 | 21.1% |
| High School | 161,180 | 21.2% |
| College / Undergraduate | 159,327 | 21.0% |
| Graduate / Professional | 40,484 | 5.3% |
| Total | 759,427 | 100.0% |
School Enrollment by Age by Funding Source in Kansas
Out of a total of 759,427 students who are enrolled in schools in Kansas, 106,320 (14.0%) attend a private institution, while the remaining 653,107 (86.0%) are enrolled in public schools. The age group of 3 to 4 year olds has the highest likelihood of being enrolled in private schools, with 11,036 (33.0% in the age bracket) enrolled. Conversely, the age group of 15 to 17 year olds has the lowest likelihood of being enrolled in a private school, with 106,201 (90.2% in the age bracket) attending a public institution.
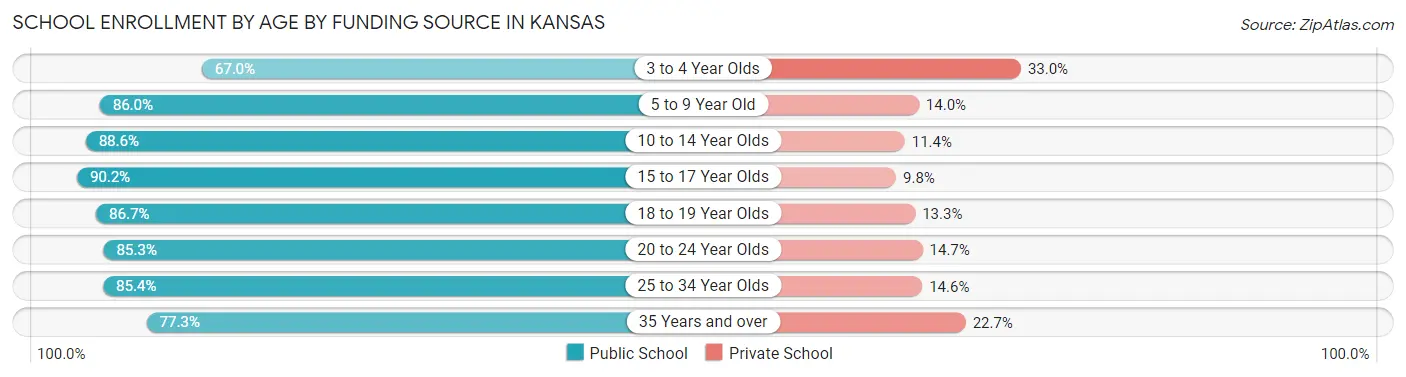
| Age Bracket | Public School | Private School |
| 3 to 4 Year Olds | 22,389 (67.0%) | 11,036 (33.0%) |
| 5 to 9 Year Old | 157,976 (86.0%) | 25,740 (14.0%) |
| 10 to 14 Year Olds | 175,658 (88.6%) | 22,574 (11.4%) |
| 15 to 17 Year Olds | 106,201 (90.2%) | 11,491 (9.8%) |
| 18 to 19 Year Olds | 56,002 (86.7%) | 8,613 (13.3%) |
| 20 to 24 Year Olds | 73,019 (85.3%) | 12,579 (14.7%) |
| 25 to 34 Year Olds | 34,539 (85.4%) | 5,919 (14.6%) |
| 35 Years and over | 27,577 (77.3%) | 8,114 (22.7%) |
| Total | 653,107 (86.0%) | 106,320 (14.0%) |
Educational Attainment by Field of Study in Kansas
Business (152,262 | 21.0%), education (113,504 | 15.7%), science & technology (80,656 | 11.1%), bio, nature & agricultural (54,865 | 7.6%), and arts & humanities (47,614 | 6.6%) are the most common fields of study among 724,628 individuals in Kansas who have obtained a bachelor's degree or higher.
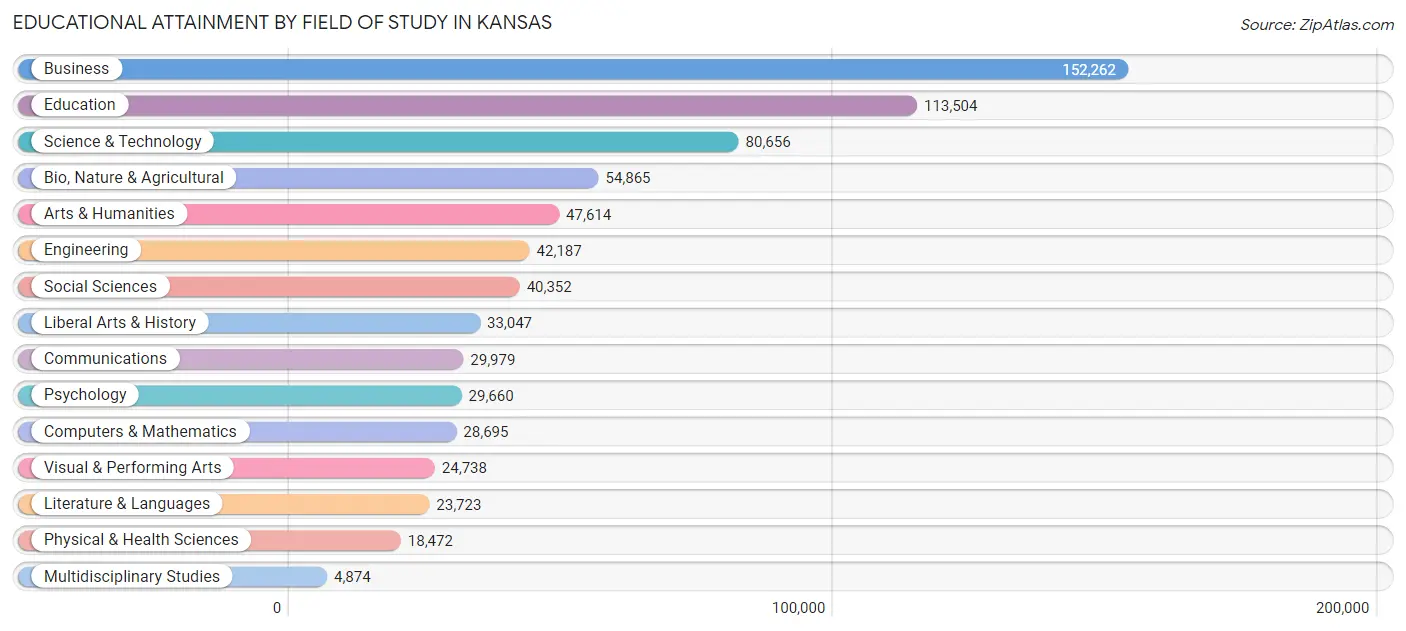
| Field of Study | # Graduates | % Graduates |
| Computers & Mathematics | 28,695 | 4.0% |
| Bio, Nature & Agricultural | 54,865 | 7.6% |
| Physical & Health Sciences | 18,472 | 2.5% |
| Psychology | 29,660 | 4.1% |
| Social Sciences | 40,352 | 5.6% |
| Engineering | 42,187 | 5.8% |
| Multidisciplinary Studies | 4,874 | 0.7% |
| Science & Technology | 80,656 | 11.1% |
| Business | 152,262 | 21.0% |
| Education | 113,504 | 15.7% |
| Literature & Languages | 23,723 | 3.3% |
| Liberal Arts & History | 33,047 | 4.6% |
| Visual & Performing Arts | 24,738 | 3.4% |
| Communications | 29,979 | 4.1% |
| Arts & Humanities | 47,614 | 6.6% |
| Total | 724,628 | 100.0% |
Transportation & Commute in Kansas
Vehicle Availability by Sex in Kansas
The most prevalent vehicle ownership categories in Kansas are males with 2 vehicles (317,356, accounting for 41.6%) and females with 2 vehicles (264,419, making up 47.9%).
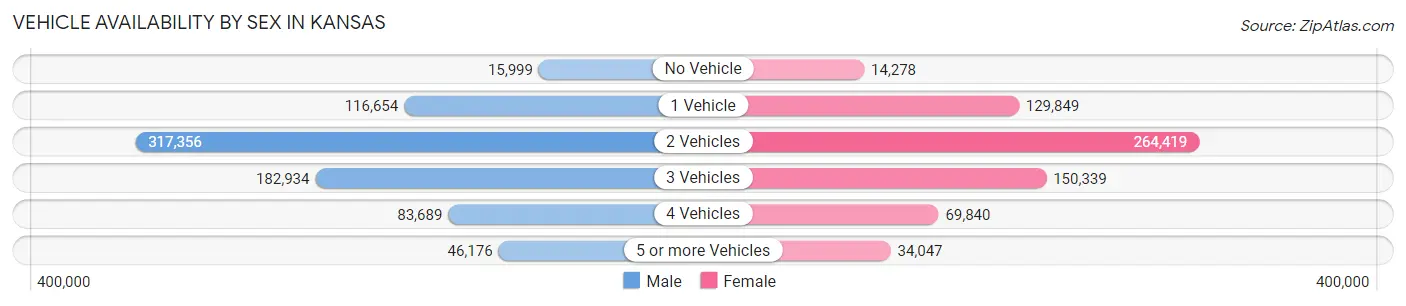
| Vehicles Available | Male | Female |
| No Vehicle | 15,999 (2.1%) | 14,278 (2.1%) |
| 1 Vehicle | 116,654 (15.3%) | 129,849 (19.6%) |
| 2 Vehicles | 317,356 (41.6%) | 264,419 (39.9%) |
| 3 Vehicles | 182,934 (24.0%) | 150,339 (22.7%) |
| 4 Vehicles | 83,689 (11.0%) | 69,840 (10.5%) |
| 5 or more Vehicles | 46,176 (6.0%) | 34,047 (5.1%) |
| Total | 762,808 (100.0%) | 662,772 (100.0%) |
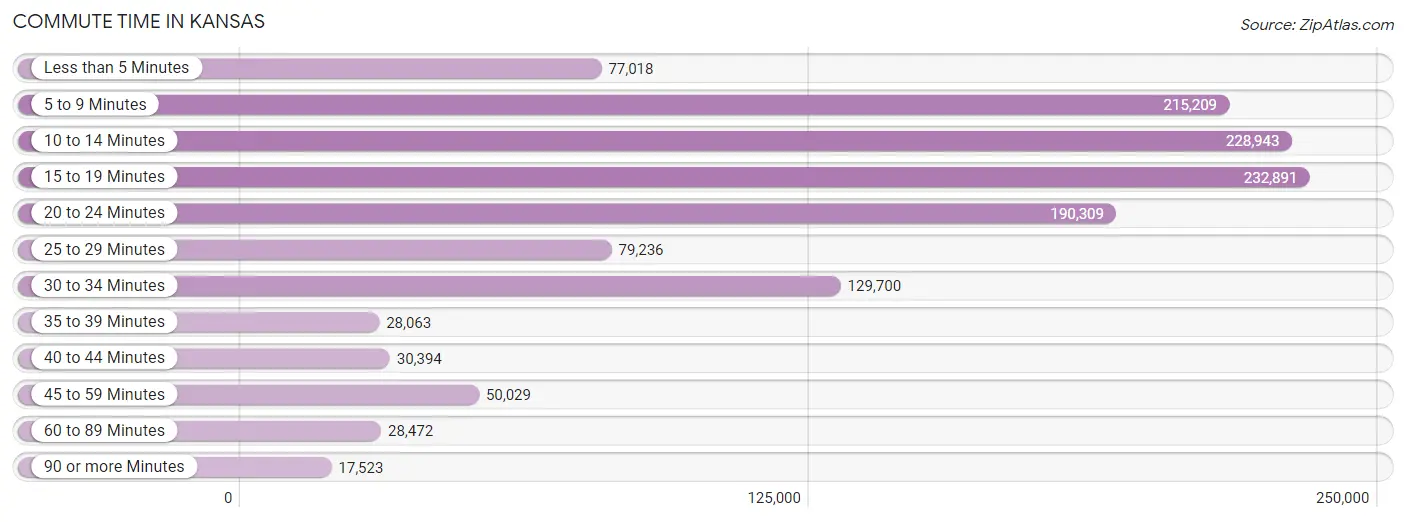
Commute Time in Kansas
The most frequently occuring commute durations in Kansas are 15 to 19 minutes (232,891 commuters, 17.8%), 10 to 14 minutes (228,943 commuters, 17.5%), and 5 to 9 minutes (215,209 commuters, 16.5%).
| Commute Time | # Commuters | % Commuters |
| Less than 5 Minutes | 77,018 | 5.9% |
| 5 to 9 Minutes | 215,209 | 16.5% |
| 10 to 14 Minutes | 228,943 | 17.5% |
| 15 to 19 Minutes | 232,891 | 17.8% |
| 20 to 24 Minutes | 190,309 | 14.5% |
| 25 to 29 Minutes | 79,236 | 6.1% |
| 30 to 34 Minutes | 129,700 | 9.9% |
| 35 to 39 Minutes | 28,063 | 2.1% |
| 40 to 44 Minutes | 30,394 | 2.3% |
| 45 to 59 Minutes | 50,029 | 3.8% |
| 60 to 89 Minutes | 28,472 | 2.2% |
| 90 or more Minutes | 17,523 | 1.3% |
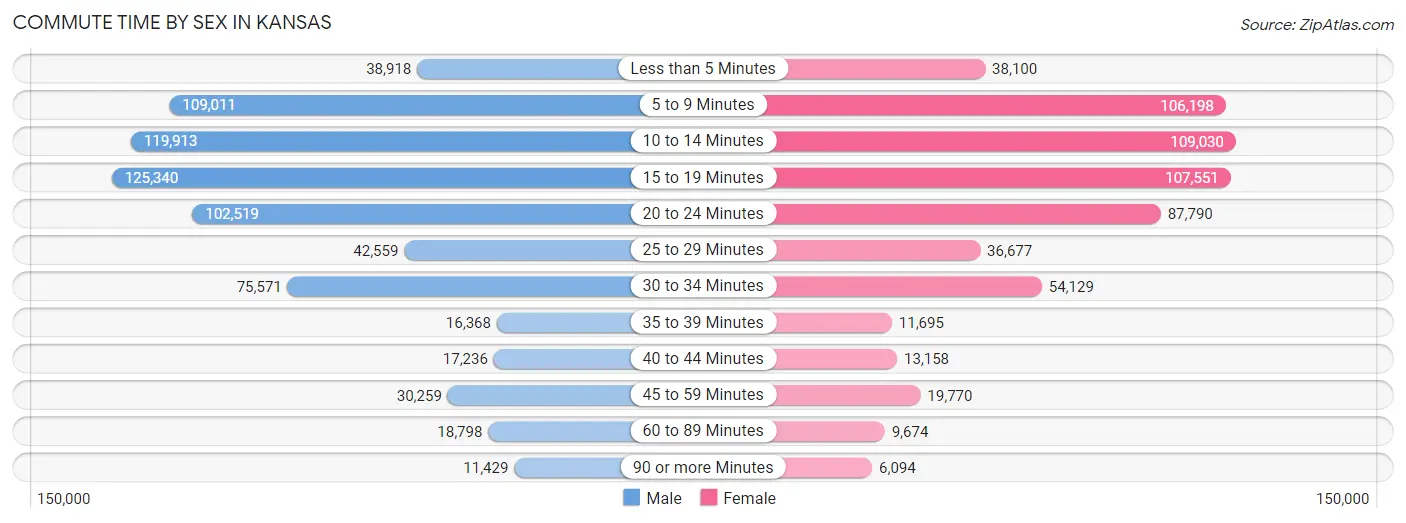
Commute Time by Sex in Kansas
The most common commute times in Kansas are 15 to 19 minutes (125,340 commuters, 17.7%) for males and 10 to 14 minutes (109,030 commuters, 18.2%) for females.
| Commute Time | Male | Female |
| Less than 5 Minutes | 38,918 (5.5%) | 38,100 (6.4%) |
| 5 to 9 Minutes | 109,011 (15.4%) | 106,198 (17.7%) |
| 10 to 14 Minutes | 119,913 (16.9%) | 109,030 (18.2%) |
| 15 to 19 Minutes | 125,340 (17.7%) | 107,551 (17.9%) |
| 20 to 24 Minutes | 102,519 (14.5%) | 87,790 (14.6%) |
| 25 to 29 Minutes | 42,559 (6.0%) | 36,677 (6.1%) |
| 30 to 34 Minutes | 75,571 (10.7%) | 54,129 (9.0%) |
| 35 to 39 Minutes | 16,368 (2.3%) | 11,695 (1.9%) |
| 40 to 44 Minutes | 17,236 (2.4%) | 13,158 (2.2%) |
| 45 to 59 Minutes | 30,259 (4.3%) | 19,770 (3.3%) |
| 60 to 89 Minutes | 18,798 (2.7%) | 9,674 (1.6%) |
| 90 or more Minutes | 11,429 (1.6%) | 6,094 (1.0%) |
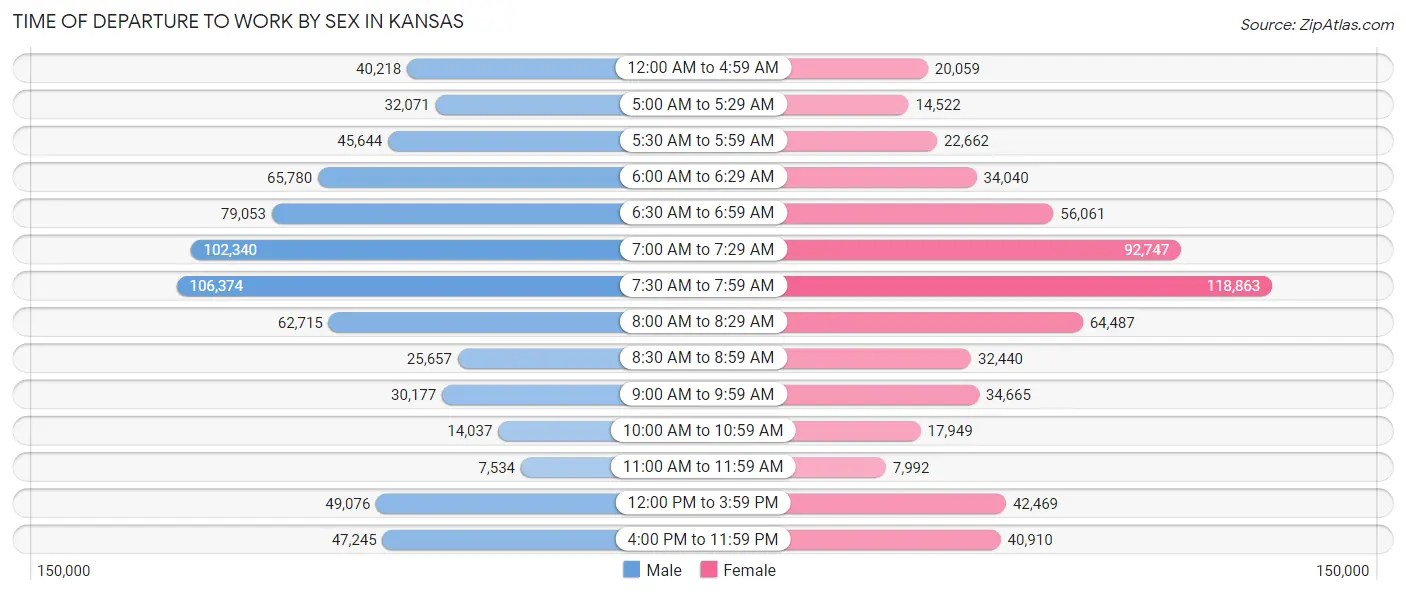
Time of Departure to Work by Sex in Kansas
The most frequent times of departure to work in Kansas are 7:30 AM to 7:59 AM (106,374, 15.0%) for males and 7:30 AM to 7:59 AM (118,863, 19.8%) for females.
| Time of Departure | Male | Female |
| 12:00 AM to 4:59 AM | 40,218 (5.7%) | 20,059 (3.3%) |
| 5:00 AM to 5:29 AM | 32,071 (4.5%) | 14,522 (2.4%) |
| 5:30 AM to 5:59 AM | 45,644 (6.5%) | 22,662 (3.8%) |
| 6:00 AM to 6:29 AM | 65,780 (9.3%) | 34,040 (5.7%) |
| 6:30 AM to 6:59 AM | 79,053 (11.2%) | 56,061 (9.3%) |
| 7:00 AM to 7:29 AM | 102,340 (14.5%) | 92,747 (15.5%) |
| 7:30 AM to 7:59 AM | 106,374 (15.0%) | 118,863 (19.8%) |
| 8:00 AM to 8:29 AM | 62,715 (8.9%) | 64,487 (10.7%) |
| 8:30 AM to 8:59 AM | 25,657 (3.6%) | 32,440 (5.4%) |
| 9:00 AM to 9:59 AM | 30,177 (4.3%) | 34,665 (5.8%) |
| 10:00 AM to 10:59 AM | 14,037 (2.0%) | 17,949 (3.0%) |
| 11:00 AM to 11:59 AM | 7,534 (1.1%) | 7,992 (1.3%) |
| 12:00 PM to 3:59 PM | 49,076 (6.9%) | 42,469 (7.1%) |
| 4:00 PM to 11:59 PM | 47,245 (6.7%) | 40,910 (6.8%) |
| Total | 707,921 (100.0%) | 599,866 (100.0%) |
Housing Occupancy in Kansas
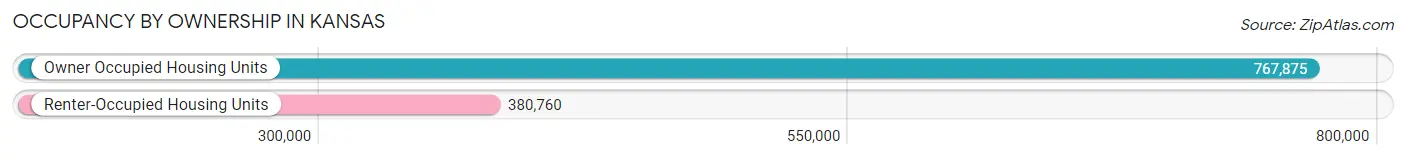
Occupancy by Ownership in Kansas
Of the total 1,148,635 dwellings in Kansas, owner-occupied units account for 767,875 (66.8%), while renter-occupied units make up 380,760 (33.2%).
| Occupancy | # Housing Units | % Housing Units |
| Owner Occupied Housing Units | 767,875 | 66.8% |
| Renter-Occupied Housing Units | 380,760 | 33.2% |
| Total Occupied Housing Units | 1,148,635 | 100.0% |
Occupancy by Household Size in Kansas
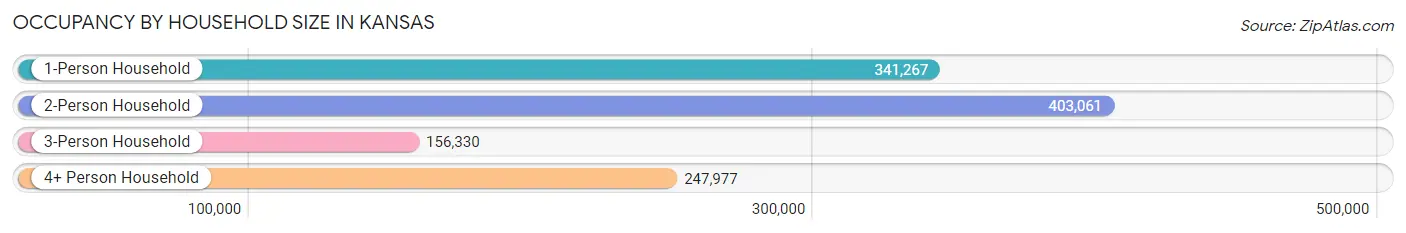
| Household Size | # Housing Units | % Housing Units |
| 1-Person Household | 341,267 | 29.7% |
| 2-Person Household | 403,061 | 35.1% |
| 3-Person Household | 156,330 | 13.6% |
| 4+ Person Household | 247,977 | 21.6% |
| Total Housing Units | 1,148,635 | 100.0% |
Occupancy by Ownership by Household Size in Kansas
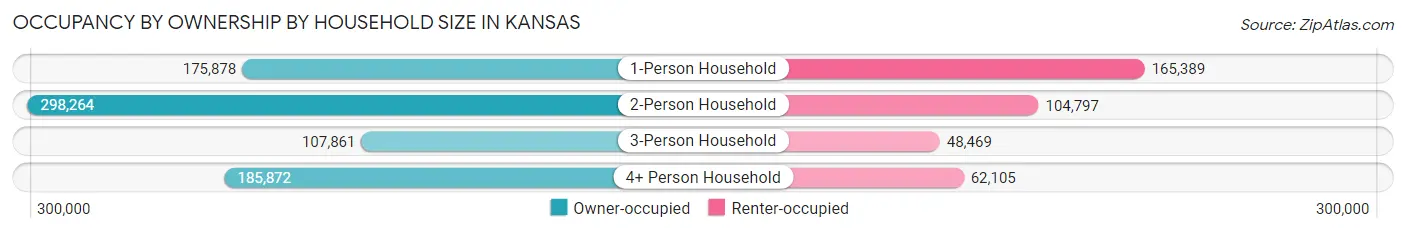
| Household Size | Owner-occupied | Renter-occupied |
| 1-Person Household | 175,878 (51.5%) | 165,389 (48.5%) |
| 2-Person Household | 298,264 (74.0%) | 104,797 (26.0%) |
| 3-Person Household | 107,861 (69.0%) | 48,469 (31.0%) |
| 4+ Person Household | 185,872 (75.0%) | 62,105 (25.0%) |
| Total Housing Units | 767,875 (66.8%) | 380,760 (33.2%) |
Occupancy by Educational Attainment in Kansas
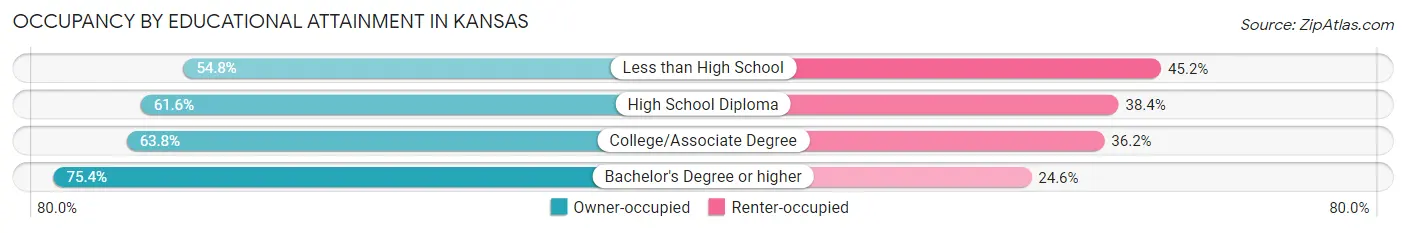
| Household Size | Owner-occupied | Renter-occupied |
| Less than High School | 43,413 (54.8%) | 35,801 (45.2%) |
| High School Diploma | 165,739 (61.6%) | 103,501 (38.4%) |
| College/Associate Degree | 245,241 (63.8%) | 139,133 (36.2%) |
| Bachelor's Degree or higher | 313,482 (75.4%) | 102,325 (24.6%) |
Occupancy by Age of Householder in Kansas
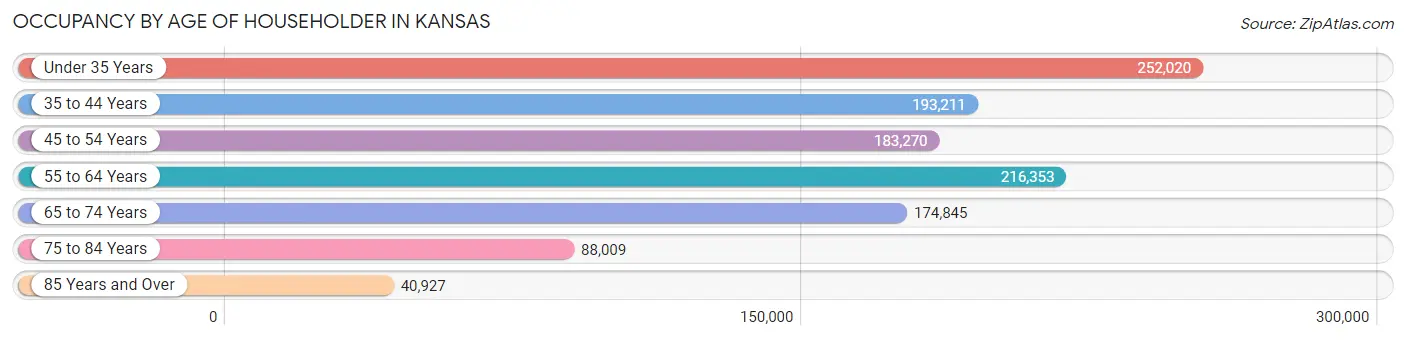
| Age Bracket | # Households | % Households |
| Under 35 Years | 252,020 | 21.9% |
| 35 to 44 Years | 193,211 | 16.8% |
| 45 to 54 Years | 183,270 | 16.0% |
| 55 to 64 Years | 216,353 | 18.8% |
| 65 to 74 Years | 174,845 | 15.2% |
| 75 to 84 Years | 88,009 | 7.7% |
| 85 Years and Over | 40,927 | 3.6% |
| Total | 1,148,635 | 100.0% |
Housing Finances in Kansas
Median Income by Occupancy in Kansas
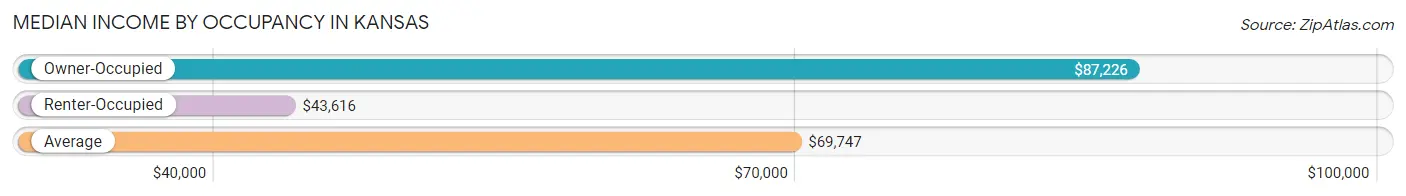
| Occupancy Type | # Households | Median Income |
| Owner-Occupied | 767,875 (66.8%) | $87,226 |
| Renter-Occupied | 380,760 (33.2%) | $43,616 |
| Average | 1,148,635 (100.0%) | $69,747 |
Occupancy by Householder Income Bracket in Kansas
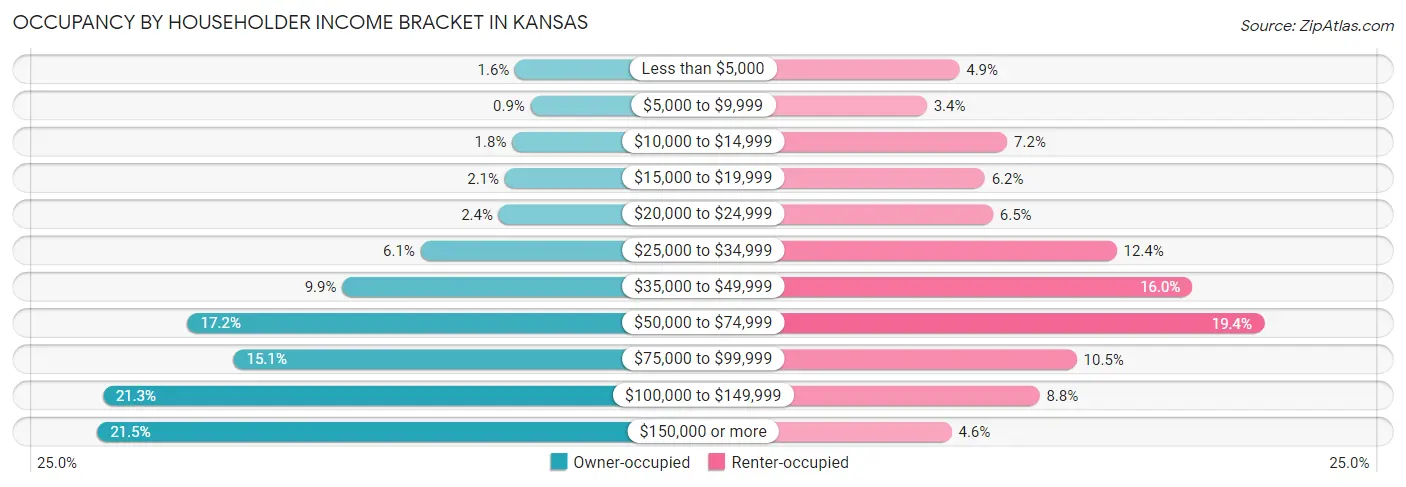
| Income Bracket | Owner-occupied | Renter-occupied |
| Less than $5,000 | 12,623 (1.6%) | 18,822 (4.9%) |
| $5,000 to $9,999 | 6,915 (0.9%) | 12,906 (3.4%) |
| $10,000 to $14,999 | 13,701 (1.8%) | 27,474 (7.2%) |
| $15,000 to $19,999 | 16,349 (2.1%) | 23,415 (6.1%) |
| $20,000 to $24,999 | 18,610 (2.4%) | 24,899 (6.5%) |
| $25,000 to $34,999 | 47,115 (6.1%) | 47,347 (12.4%) |
| $35,000 to $49,999 | 75,825 (9.9%) | 61,018 (16.0%) |
| $50,000 to $74,999 | 132,411 (17.2%) | 74,035 (19.4%) |
| $75,000 to $99,999 | 115,544 (15.0%) | 40,079 (10.5%) |
| $100,000 to $149,999 | 163,375 (21.3%) | 33,363 (8.8%) |
| $150,000 or more | 165,407 (21.5%) | 17,402 (4.6%) |
| Total | 767,875 (100.0%) | 380,760 (100.0%) |
Monthly Housing Cost Tiers in Kansas
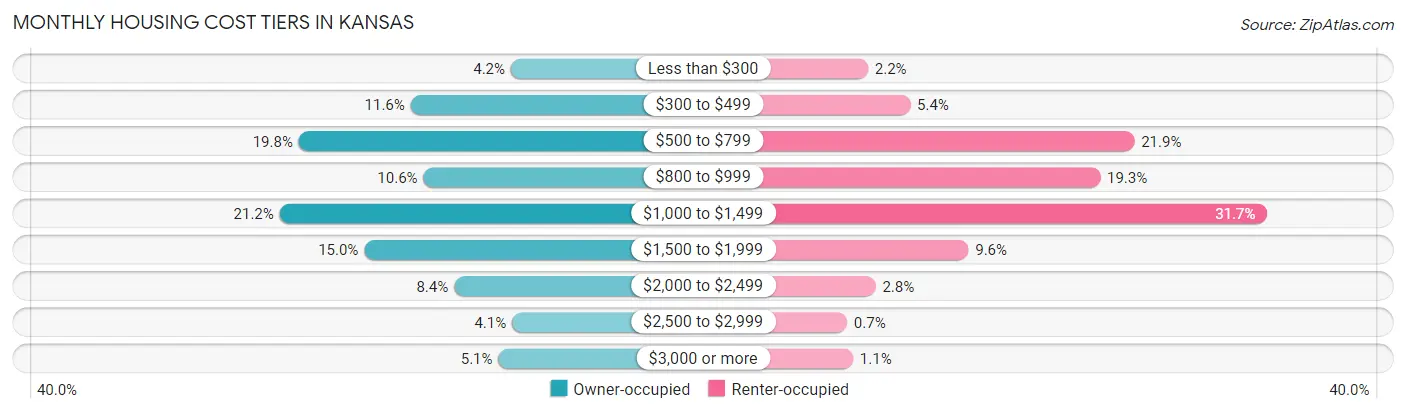
| Monthly Cost | Owner-occupied | Renter-occupied |
| Less than $300 | 32,160 (4.2%) | 8,525 (2.2%) |
| $300 to $499 | 88,881 (11.6%) | 20,388 (5.3%) |
| $500 to $799 | 152,102 (19.8%) | 83,220 (21.9%) |
| $800 to $999 | 81,656 (10.6%) | 73,654 (19.3%) |
| $1,000 to $1,499 | 162,911 (21.2%) | 120,537 (31.7%) |
| $1,500 to $1,999 | 115,127 (15.0%) | 36,721 (9.6%) |
| $2,000 to $2,499 | 64,275 (8.4%) | 10,647 (2.8%) |
| $2,500 to $2,999 | 31,516 (4.1%) | 2,654 (0.7%) |
| $3,000 or more | 39,247 (5.1%) | 4,337 (1.1%) |
| Total | 767,875 (100.0%) | 380,760 (100.0%) |
Physical Housing Characteristics in Kansas
Housing Structures in Kansas
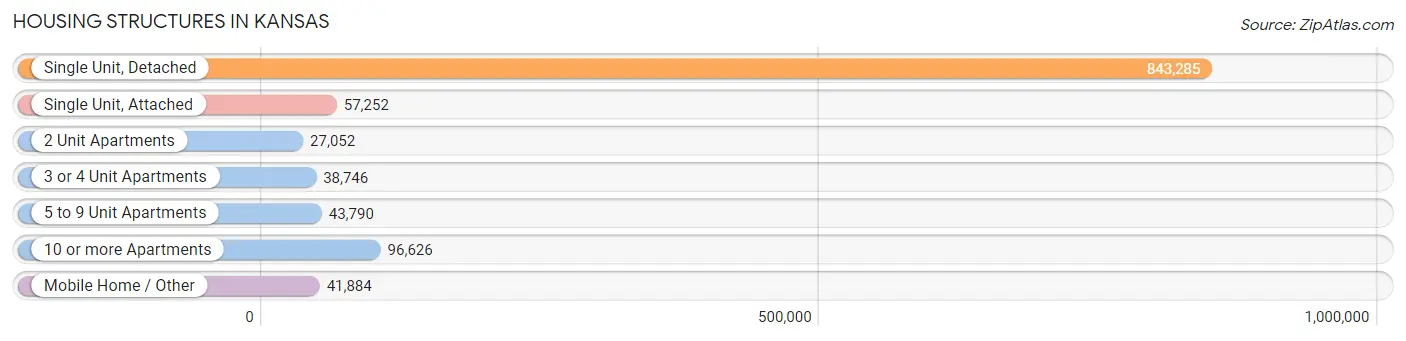
| Structure Type | # Housing Units | % Housing Units |
| Single Unit, Detached | 843,285 | 73.4% |
| Single Unit, Attached | 57,252 | 5.0% |
| 2 Unit Apartments | 27,052 | 2.4% |
| 3 or 4 Unit Apartments | 38,746 | 3.4% |
| 5 to 9 Unit Apartments | 43,790 | 3.8% |
| 10 or more Apartments | 96,626 | 8.4% |
| Mobile Home / Other | 41,884 | 3.6% |
| Total | 1,148,635 | 100.0% |
Housing Structures by Occupancy in Kansas
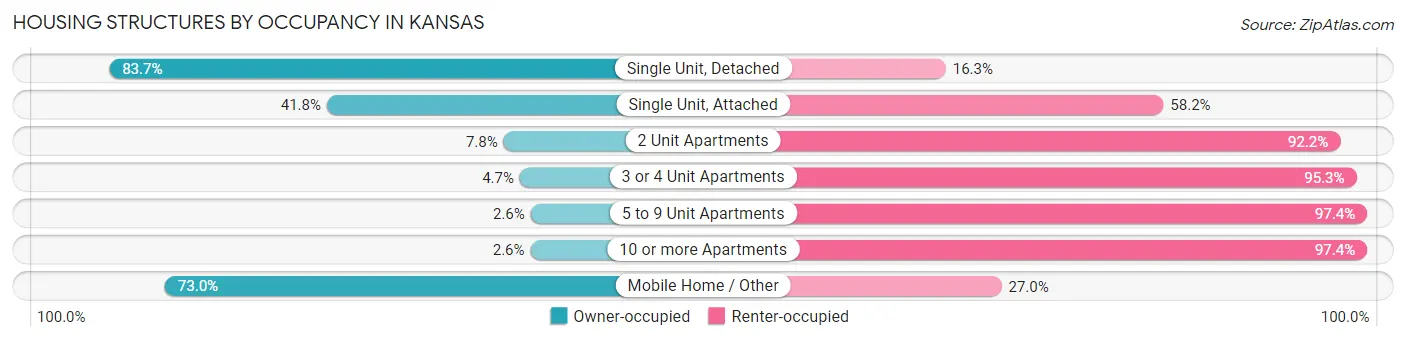
| Structure Type | Owner-occupied | Renter-occupied |
| Single Unit, Detached | 705,790 (83.7%) | 137,495 (16.3%) |
| Single Unit, Attached | 23,938 (41.8%) | 33,314 (58.2%) |
| 2 Unit Apartments | 2,107 (7.8%) | 24,945 (92.2%) |
| 3 or 4 Unit Apartments | 1,805 (4.7%) | 36,941 (95.3%) |
| 5 to 9 Unit Apartments | 1,136 (2.6%) | 42,654 (97.4%) |
| 10 or more Apartments | 2,534 (2.6%) | 94,092 (97.4%) |
| Mobile Home / Other | 30,565 (73.0%) | 11,319 (27.0%) |
| Total | 767,875 (66.8%) | 380,760 (33.2%) |
Housing Structures by Number of Rooms in Kansas
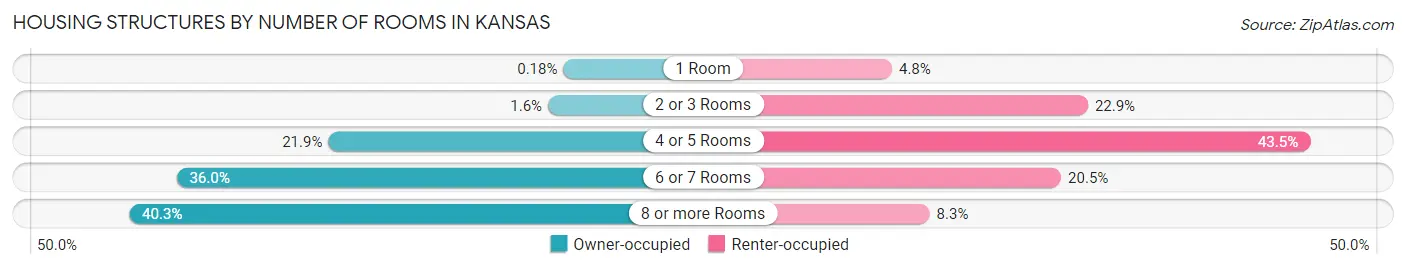
| Number of Rooms | Owner-occupied | Renter-occupied |
| 1 Room | 1,419 (0.2%) | 18,365 (4.8%) |
| 2 or 3 Rooms | 12,297 (1.6%) | 87,363 (22.9%) |
| 4 or 5 Rooms | 168,280 (21.9%) | 165,520 (43.5%) |
| 6 or 7 Rooms | 276,082 (35.9%) | 77,915 (20.5%) |
| 8 or more Rooms | 309,797 (40.3%) | 31,597 (8.3%) |
| Total | 767,875 (100.0%) | 380,760 (100.0%) |
Housing Structure by Heating Type in Kansas
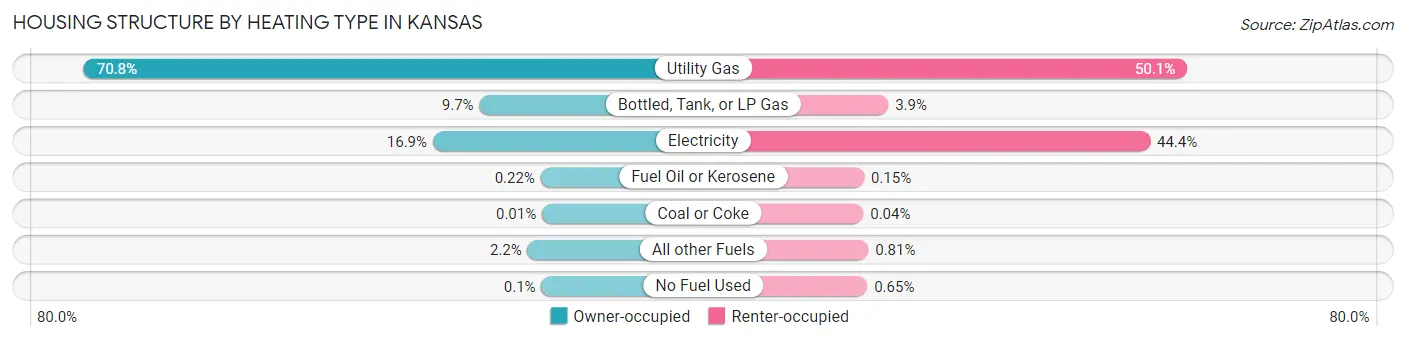
| Heating Type | Owner-occupied | Renter-occupied |
| Utility Gas | 543,965 (70.8%) | 190,725 (50.1%) |
| Bottled, Tank, or LP Gas | 74,425 (9.7%) | 14,825 (3.9%) |
| Electricity | 129,719 (16.9%) | 168,936 (44.4%) |
| Fuel Oil or Kerosene | 1,724 (0.2%) | 562 (0.2%) |
| Coal or Coke | 92 (0.0%) | 166 (0.0%) |
| All other Fuels | 17,168 (2.2%) | 3,087 (0.8%) |
| No Fuel Used | 782 (0.1%) | 2,459 (0.6%) |
| Total | 767,875 (100.0%) | 380,760 (100.0%) |
Household Vehicle Usage in Kansas
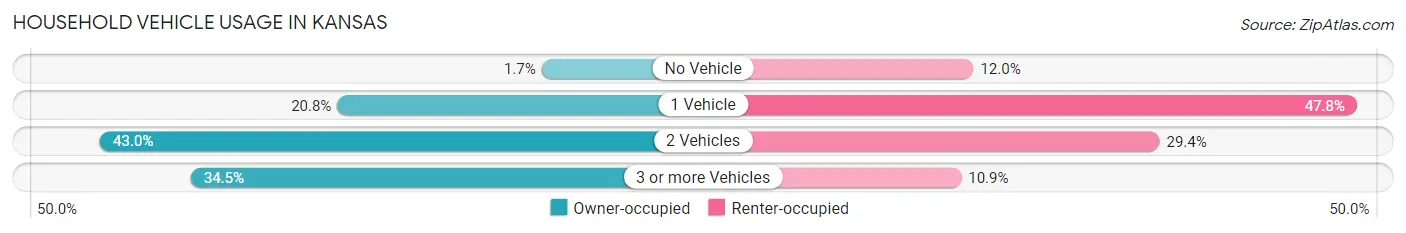
| Vehicles per Household | Owner-occupied | Renter-occupied |
| No Vehicle | 13,343 (1.7%) | 45,677 (12.0%) |
| 1 Vehicle | 159,884 (20.8%) | 181,925 (47.8%) |
| 2 Vehicles | 329,914 (43.0%) | 111,826 (29.4%) |
| 3 or more Vehicles | 264,734 (34.5%) | 41,332 (10.9%) |
| Total | 767,875 (100.0%) | 380,760 (100.0%) |
Real Estate & Mortgages in Kansas
Real Estate and Mortgage Overview in Kansas
| Characteristic | Without Mortgage | With Mortgage |
| Housing Units | 322,527 | 445,348 |
| Median Property Value | $155,200 | $212,300 |
| Median Household Income | $66,108 | $119,505 |
| Monthly Housing Costs | $592 | $38,427 |
| Real Estate Taxes | $2,214 | $7,867 |
Property Value by Mortgage Status in Kansas
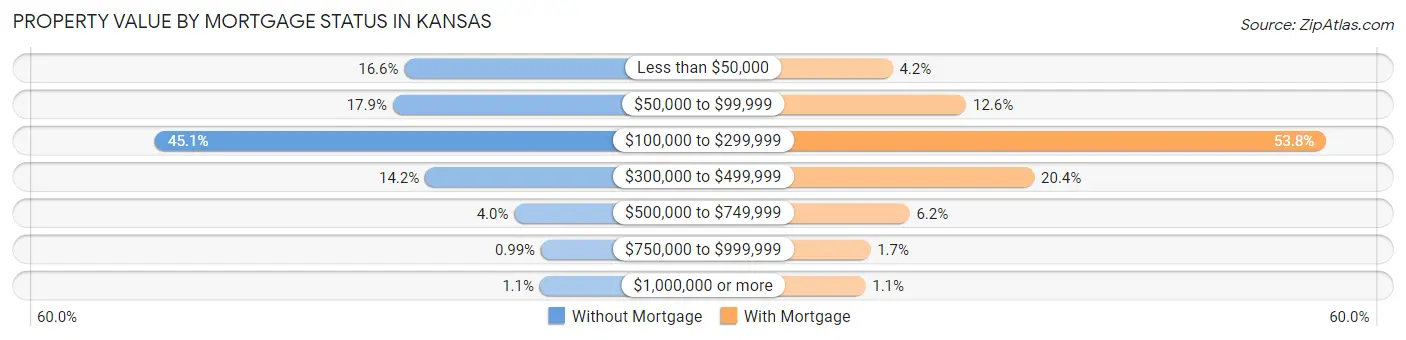
| Property Value | Without Mortgage | With Mortgage |
| Less than $50,000 | 53,566 (16.6%) | 18,804 (4.2%) |
| $50,000 to $99,999 | 57,817 (17.9%) | 56,265 (12.6%) |
| $100,000 to $299,999 | 145,438 (45.1%) | 239,508 (53.8%) |
| $300,000 to $499,999 | 45,901 (14.2%) | 90,886 (20.4%) |
| $500,000 to $749,999 | 12,996 (4.0%) | 27,455 (6.2%) |
| $750,000 to $999,999 | 3,193 (1.0%) | 7,499 (1.7%) |
| $1,000,000 or more | 3,616 (1.1%) | 4,931 (1.1%) |
| Total | 322,527 (100.0%) | 445,348 (100.0%) |
Household Income by Mortgage Status in Kansas
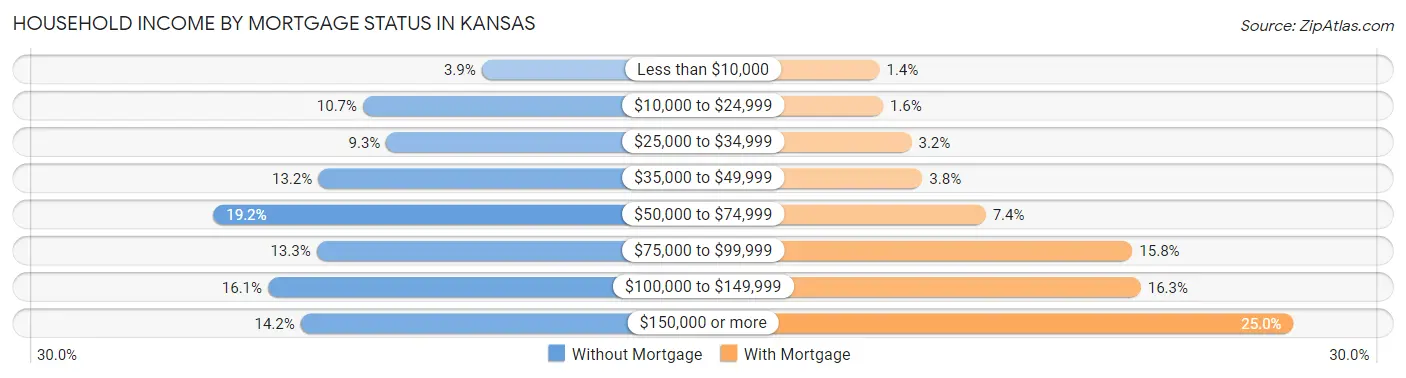
| Household Income | Without Mortgage | With Mortgage |
| Less than $10,000 | 12,556 (3.9%) | 6,096 (1.4%) |
| $10,000 to $24,999 | 34,428 (10.7%) | 6,982 (1.6%) |
| $25,000 to $34,999 | 30,124 (9.3%) | 14,232 (3.2%) |
| $35,000 to $49,999 | 42,677 (13.2%) | 16,991 (3.8%) |
| $50,000 to $74,999 | 61,949 (19.2%) | 33,148 (7.4%) |
| $75,000 to $99,999 | 42,958 (13.3%) | 70,462 (15.8%) |
| $100,000 to $149,999 | 51,933 (16.1%) | 72,586 (16.3%) |
| $150,000 or more | 45,902 (14.2%) | 111,442 (25.0%) |
| Total | 322,527 (100.0%) | 445,348 (100.0%) |
Property Value to Household Income Ratio in Kansas
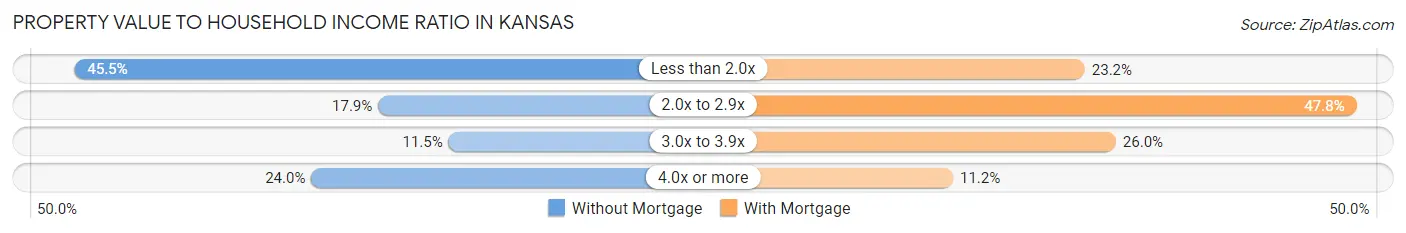
| Value-to-Income Ratio | Without Mortgage | With Mortgage |
| Less than 2.0x | 146,692 (45.5%) | 103,083 (23.2%) |
| 2.0x to 2.9x | 57,744 (17.9%) | 212,899 (47.8%) |
| 3.0x to 3.9x | 37,102 (11.5%) | 115,660 (26.0%) |
| 4.0x or more | 77,307 (24.0%) | 49,776 (11.2%) |
| Total | 322,527 (100.0%) | 445,348 (100.0%) |
Real Estate Taxes by Mortgage Status in Kansas
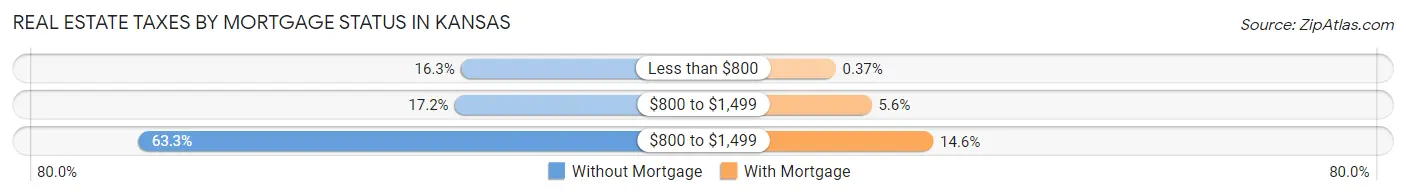
| Property Taxes | Without Mortgage | With Mortgage |
| Less than $800 | 52,548 (16.3%) | 1,670 (0.4%) |
| $800 to $1,499 | 55,476 (17.2%) | 24,970 (5.6%) |
| $800 to $1,499 | 204,169 (63.3%) | 65,119 (14.6%) |
| Total | 322,527 (100.0%) | 445,348 (100.0%) |
Health & Disability in Kansas
Health Insurance Coverage by Age in Kansas
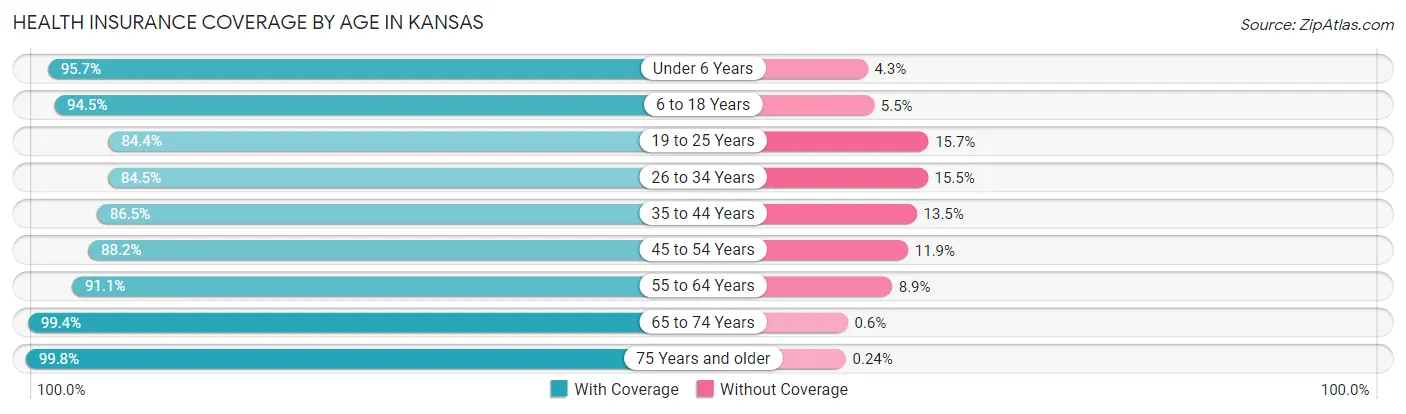
| Age Bracket | With Coverage | Without Coverage |
| Under 6 Years | 209,137 (95.7%) | 9,435 (4.3%) |
| 6 to 18 Years | 497,783 (94.5%) | 29,018 (5.5%) |
| 19 to 25 Years | 244,435 (84.4%) | 45,351 (15.7%) |
| 26 to 34 Years | 276,058 (84.5%) | 50,762 (15.5%) |
| 35 to 44 Years | 311,480 (86.5%) | 48,527 (13.5%) |
| 45 to 54 Years | 288,152 (88.1%) | 38,719 (11.8%) |
| 55 to 64 Years | 332,881 (91.1%) | 32,366 (8.9%) |
| 65 to 74 Years | 274,446 (99.4%) | 1,660 (0.6%) |
| 75 Years and older | 184,083 (99.8%) | 452 (0.2%) |
| Total | 2,618,455 (91.1%) | 256,290 (8.9%) |
Health Insurance Coverage by Citizenship Status in Kansas
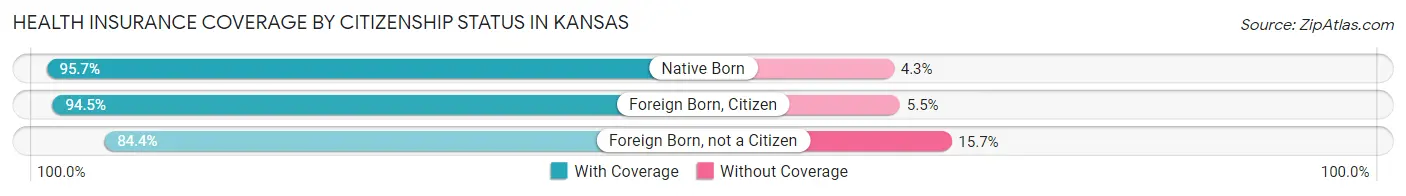
| Citizenship Status | With Coverage | Without Coverage |
| Native Born | 209,137 (95.7%) | 9,435 (4.3%) |
| Foreign Born, Citizen | 497,783 (94.5%) | 29,018 (5.5%) |
| Foreign Born, not a Citizen | 244,435 (84.4%) | 45,351 (15.7%) |
Health Insurance Coverage by Household Income in Kansas
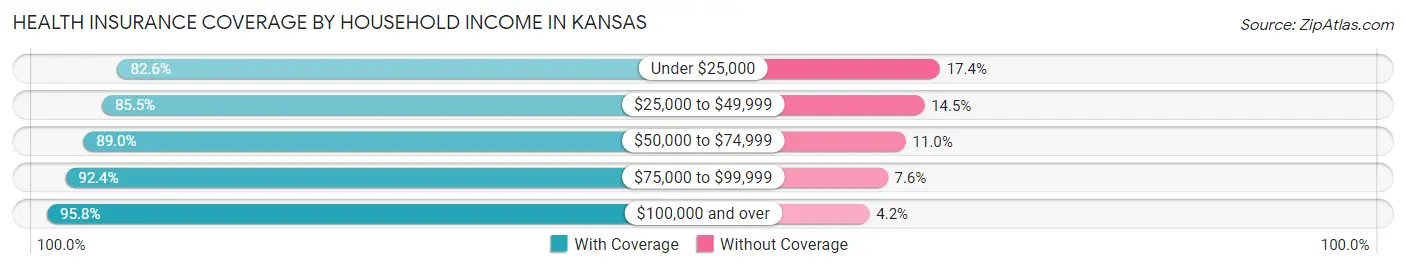
| Household Income | With Coverage | Without Coverage |
| Under $25,000 | 240,617 (82.6%) | 50,707 (17.4%) |
| $25,000 to $49,999 | 391,826 (85.5%) | 66,456 (14.5%) |
| $50,000 to $74,999 | 429,070 (89.0%) | 53,024 (11.0%) |
| $75,000 to $99,999 | 397,997 (92.4%) | 32,853 (7.6%) |
| $100,000 and over | 1,122,948 (95.8%) | 49,552 (4.2%) |
Public vs Private Health Insurance Coverage by Age in Kansas
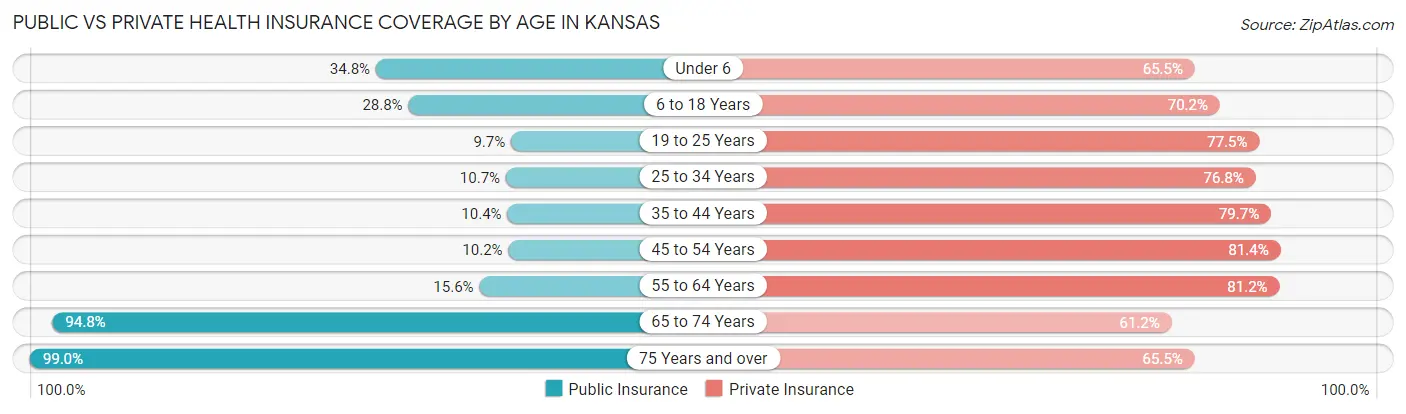
| Age Bracket | Public Insurance | Private Insurance |
| Under 6 | 76,035 (34.8%) | 143,187 (65.5%) |
| 6 to 18 Years | 151,473 (28.7%) | 369,596 (70.2%) |
| 19 to 25 Years | 28,151 (9.7%) | 224,551 (77.5%) |
| 25 to 34 Years | 34,855 (10.7%) | 251,042 (76.8%) |
| 35 to 44 Years | 37,356 (10.4%) | 286,780 (79.7%) |
| 45 to 54 Years | 33,337 (10.2%) | 266,182 (81.4%) |
| 55 to 64 Years | 56,920 (15.6%) | 296,636 (81.2%) |
| 65 to 74 Years | 261,825 (94.8%) | 168,994 (61.2%) |
| 75 Years and over | 182,730 (99.0%) | 120,845 (65.5%) |
| Total | 862,682 (30.0%) | 2,127,813 (74.0%) |
Disability Status by Sex by Age in Kansas
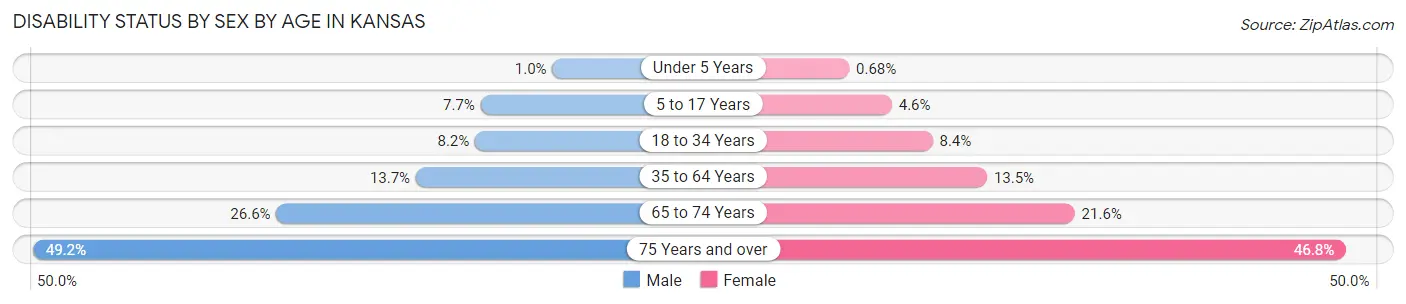
| Age Bracket | Male | Female |
| Under 5 Years | 941 (1.0%) | 595 (0.7%) |
| 5 to 17 Years | 20,438 (7.7%) | 11,756 (4.6%) |
| 18 to 34 Years | 27,513 (8.2%) | 27,417 (8.4%) |
| 35 to 64 Years | 71,911 (13.7%) | 70,896 (13.5%) |
| 65 to 74 Years | 35,404 (26.6%) | 30,947 (21.6%) |
| 75 Years and over | 37,900 (49.2%) | 50,336 (46.8%) |
Disability Class by Sex by Age in Kansas
Disability Class: Hearing Difficulty
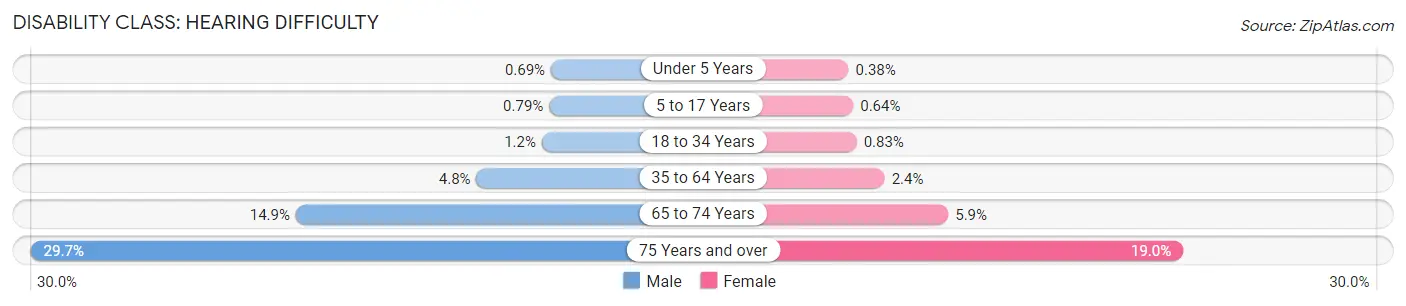
| Age Bracket | Male | Female |
| Under 5 Years | 639 (0.7%) | 335 (0.4%) |
| 5 to 17 Years | 2,110 (0.8%) | 1,627 (0.6%) |
| 18 to 34 Years | 4,029 (1.2%) | 2,697 (0.8%) |
| 35 to 64 Years | 25,465 (4.8%) | 12,606 (2.4%) |
| 65 to 74 Years | 19,807 (14.9%) | 8,485 (5.9%) |
| 75 Years and over | 22,832 (29.7%) | 20,440 (19.0%) |
Disability Class: Vision Difficulty
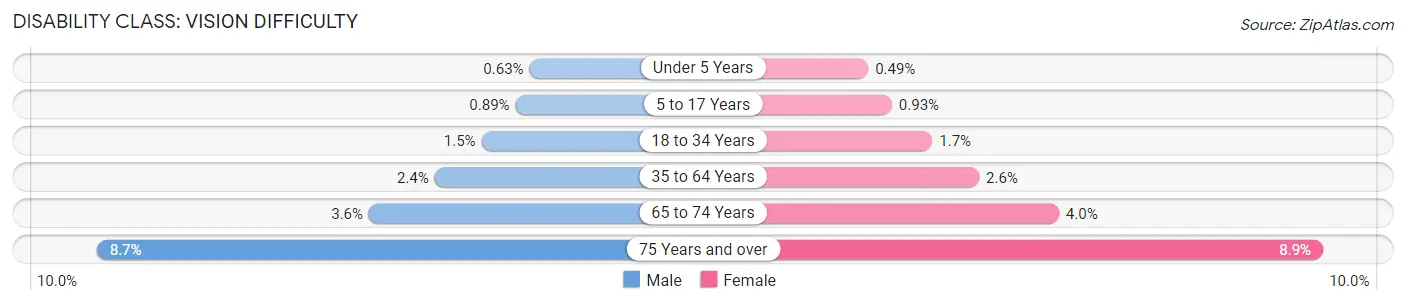
| Age Bracket | Male | Female |
| Under 5 Years | 585 (0.6%) | 428 (0.5%) |
| 5 to 17 Years | 2,364 (0.9%) | 2,367 (0.9%) |
| 18 to 34 Years | 5,105 (1.5%) | 5,485 (1.7%) |
| 35 to 64 Years | 12,544 (2.4%) | 13,449 (2.5%) |
| 65 to 74 Years | 4,801 (3.6%) | 5,770 (4.0%) |
| 75 Years and over | 6,669 (8.7%) | 9,608 (8.9%) |
Disability Class: Cognitive Difficulty
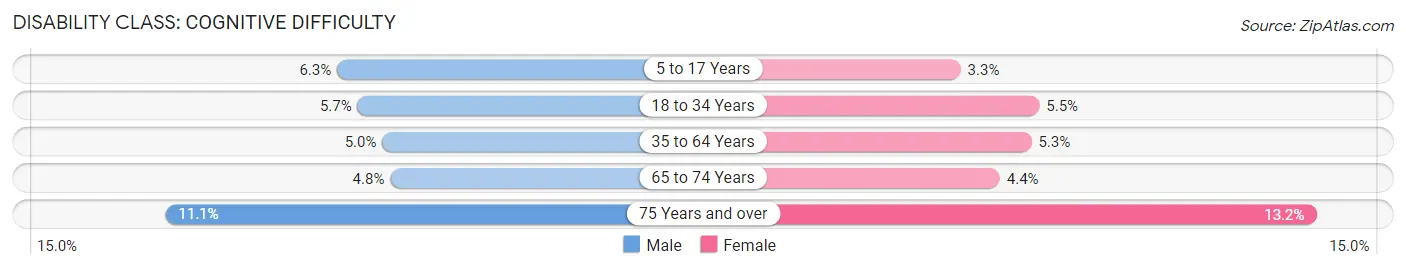
| Age Bracket | Male | Female |
| 5 to 17 Years | 16,793 (6.3%) | 8,405 (3.3%) |
| 18 to 34 Years | 19,230 (5.7%) | 17,894 (5.5%) |
| 35 to 64 Years | 26,513 (5.0%) | 27,772 (5.3%) |
| 65 to 74 Years | 6,409 (4.8%) | 6,299 (4.4%) |
| 75 Years and over | 8,532 (11.1%) | 14,204 (13.2%) |
Disability Class: Ambulatory Difficulty
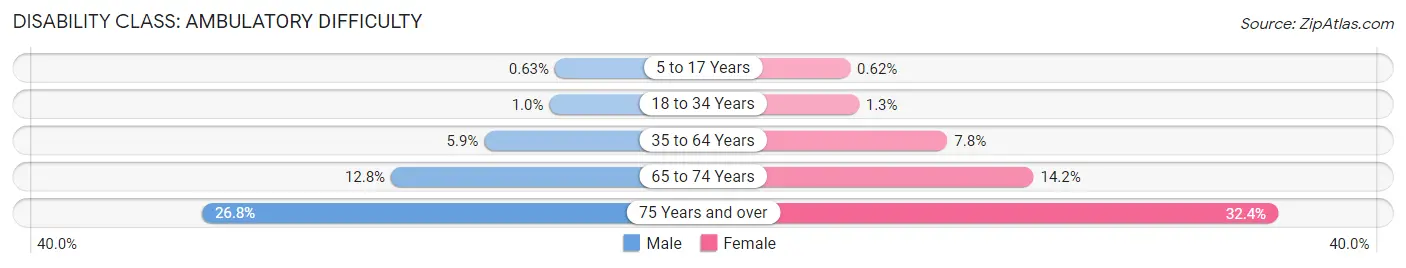
| Age Bracket | Male | Female |
| 5 to 17 Years | 1,686 (0.6%) | 1,579 (0.6%) |
| 18 to 34 Years | 3,484 (1.0%) | 4,087 (1.3%) |
| 35 to 64 Years | 30,922 (5.9%) | 41,285 (7.8%) |
| 65 to 74 Years | 17,014 (12.8%) | 20,384 (14.2%) |
| 75 Years and over | 20,652 (26.8%) | 34,833 (32.4%) |
Disability Class: Self-Care Difficulty
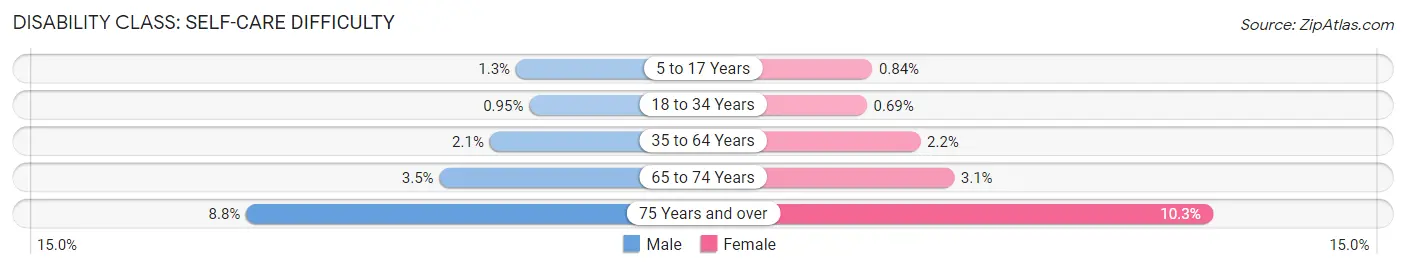
| Age Bracket | Male | Female |
| 5 to 17 Years | 3,526 (1.3%) | 2,123 (0.8%) |
| 18 to 34 Years | 3,201 (0.9%) | 2,259 (0.7%) |
| 35 to 64 Years | 10,764 (2.1%) | 11,497 (2.2%) |
| 65 to 74 Years | 4,583 (3.5%) | 4,472 (3.1%) |
| 75 Years and over | 6,794 (8.8%) | 11,101 (10.3%) |
Technology Access in Kansas
Computing Device Access in Kansas
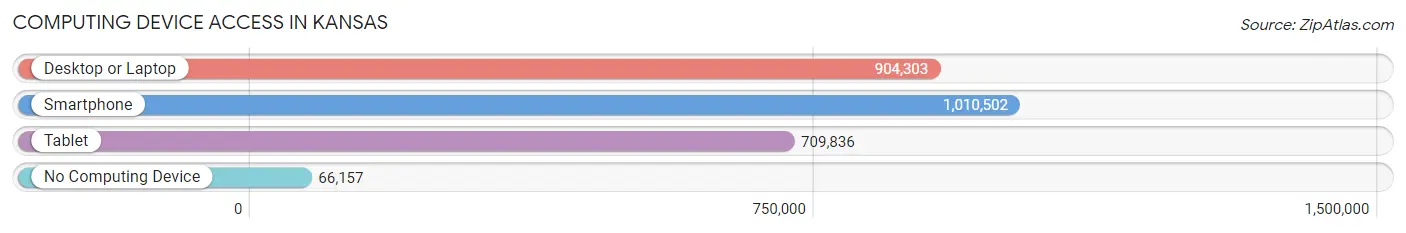
| Device Type | # Households | % Households |
| Desktop or Laptop | 904,303 | 78.7% |
| Smartphone | 1,010,502 | 88.0% |
| Tablet | 709,836 | 61.8% |
| No Computing Device | 66,157 | 5.8% |
| Total | 1,148,635 | 100.0% |
Internet Access in Kansas
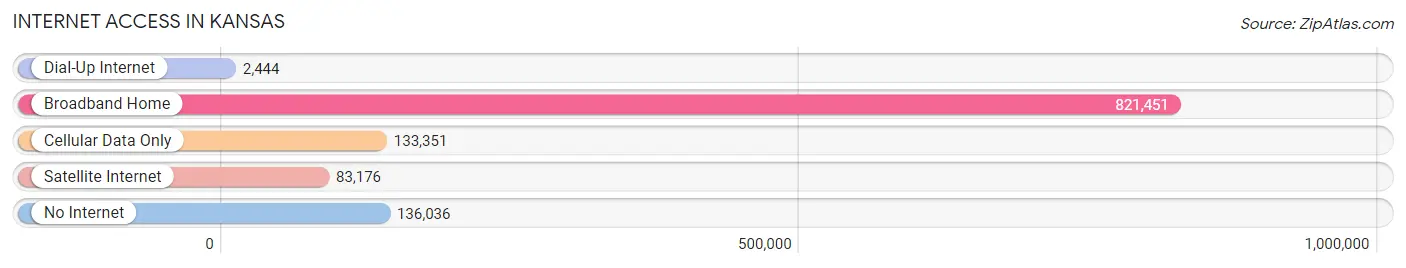
| Internet Type | # Households | % Households |
| Dial-Up Internet | 2,444 | 0.2% |
| Broadband Home | 821,451 | 71.5% |
| Cellular Data Only | 133,351 | 11.6% |
| Satellite Internet | 83,176 | 7.2% |
| No Internet | 136,036 | 11.8% |
| Total | 1,148,635 | 100.0% |
Kansas Summary
Kansas is a state located in the Midwestern United States. It is bordered by Nebraska to the north, Missouri to the east, Oklahoma to the south, and Colorado to the west. Kansas is the 15th most populous state in the United States, with a population of 2,913,314 as of 2020.
Geography
Kansas is located in the Great Plains region of the United States. It is the 15th largest state in the country, with an area of 82,278 square miles. The state is divided into 105 counties and has 628 incorporated cities and towns. The highest point in Kansas is Mount Sunflower, which has an elevation of 4,041 feet. The state is home to several rivers, including the Arkansas, Kansas, Missouri, and Republican rivers.
The climate of Kansas is generally continental, with hot summers and cold winters. The average annual temperature is 54°F, with the highest temperatures occurring in July and August. The average annual precipitation is 28 inches, with the highest amounts occurring in the eastern part of the state.
History
The area that is now Kansas was first inhabited by Native American tribes, including the Kansa, Osage, and Pawnee. The first Europeans to explore the area were French explorers in the late 17th century. In 1803, the United States acquired the area as part of the Louisiana Purchase.
In 1854, the Kansas-Nebraska Act was passed, which allowed settlers to decide whether Kansas would become a free or slave state. This led to a period of violence known as “Bleeding Kansas”, as pro-slavery and anti-slavery forces clashed. In 1861, Kansas was admitted to the Union as a free state.
During the Civil War, Kansas was a major supplier of troops and supplies to the Union Army. After the war, the state experienced a period of growth and prosperity, as railroads and other industries developed. In the early 20th century, Kansas was a major producer of wheat and other grains.
Economy
The economy of Kansas is largely based on agriculture, manufacturing, and services. The state is a major producer of wheat, corn, sorghum, and soybeans. Other important agricultural products include cattle, hogs, dairy products, and eggs.
Manufacturing is also an important part of the state’s economy. Major products include aircraft, automobiles, machinery, and food products. The service sector is also important, with major industries including finance, insurance, real estate, and health care.
Demographics
As of 2020, the population of Kansas was 2,913,314. The state has a population density of 35.3 people per square mile. The largest city in the state is Wichita, with a population of 389,255. Other major cities include Kansas City, Topeka, and Olathe.
The racial makeup of Kansas is 85.3% White, 6.3% Black or African American, 2.7% Asian, 0.7% Native American, and 4.0% from other races. The state has a large Hispanic or Latino population, making up 11.2% of the population.
The median household income in Kansas is $56,845, and the median home value is $164,400. The state has a poverty rate of 11.2%. The largest employers in the state are the University of Kansas, the State of Kansas, and the Kansas City Public Schools.
Common Questions
When was Kansas Incorporated?
Kansas was Incorporated into the Union on Jan 29, 1861.
What is the Total Area of Kansas?
Total Area of Kansas is 82,278 Square Miles.
What is the Total Land Area of Kansas?
Total Land Area of Kansas is 81,762 Square Miles.
What is the Total Water Area of Kansas?
Total Water Area of Kansas is 516 Square Miles.
What is the Average Elevation in Kansas?
Average Elevation in Kansas is 2,000 Feet.
What is the Highest Elevation in Kansas?
Highest Elevation in Kansas is 4,039 Feet.
What is the Lowest Elevation in Kansas?
Lowest Elevation in Kansas is 679 Feet.
What is the Population Density in Kansas?
Population Density in Kansas is 35.9 People per Square Mile.
What is Per Capita Income in Kansas?
Per Capita income in Kansas is $38,108.
What is the Median Family Income in Kansas?
Median Family Income in Kansas is $89,535.
What is the Median Household income in Kansas?
Median Household Income in Kansas is $69,747.
What is Income or Wage Gap in Kansas?
Income or Wage Gap in Kansas is 30.4%.
Women in Kansas earn 69.6 cents for every dollar earned by a man.
What is Family Income Deficit in Kansas?
Family Income Deficit in Kansas is $10,648.
Families that are below poverty line in Kansas earn $10,648 less on average than the poverty threshold level.
What is Inequality or Gini Index in Kansas?
Inequality or Gini Index in Kansas is 0.46.
What is the Total Population of Kansas?
Total Population of Kansas is 2,935,922.
What is the Total Male Population of Kansas?
Total Male Population of Kansas is 1,474,948.
What is the Total Female Population of Kansas?
Total Female Population of Kansas is 1,460,974.
What is the Ratio of Males per 100 Females in Kansas?
There are 100.96 Males per 100 Females in Kansas.
What is the Ratio of Females per 100 Males in Kansas?
There are 99.05 Females per 100 Males in Kansas.
What is the Median Population Age in Kansas?
Median Population Age in Kansas is 37.1 Years.
What is the Average Family Size in Kansas
Average Family Size in Kansas is 3.1 People.
What is the Average Household Size in Kansas
Average Household Size in Kansas is 2.5 People.
How Large is the Labor Force in Kansas?
There are 1,532,831 People in the Labor Forcein in Kansas.
What is the Percentage of People in the Labor Force in Kansas?
66.2% of People are in the Labor Force in Kansas.
What is the Unemployment Rate in Kansas?
Unemployment Rate in Kansas is 4.0%.