Cities with the Largest Dutch West Indian Community in California
RELATED REPORTS & OPTIONS
Dutch West Indian
California
Compare Cities
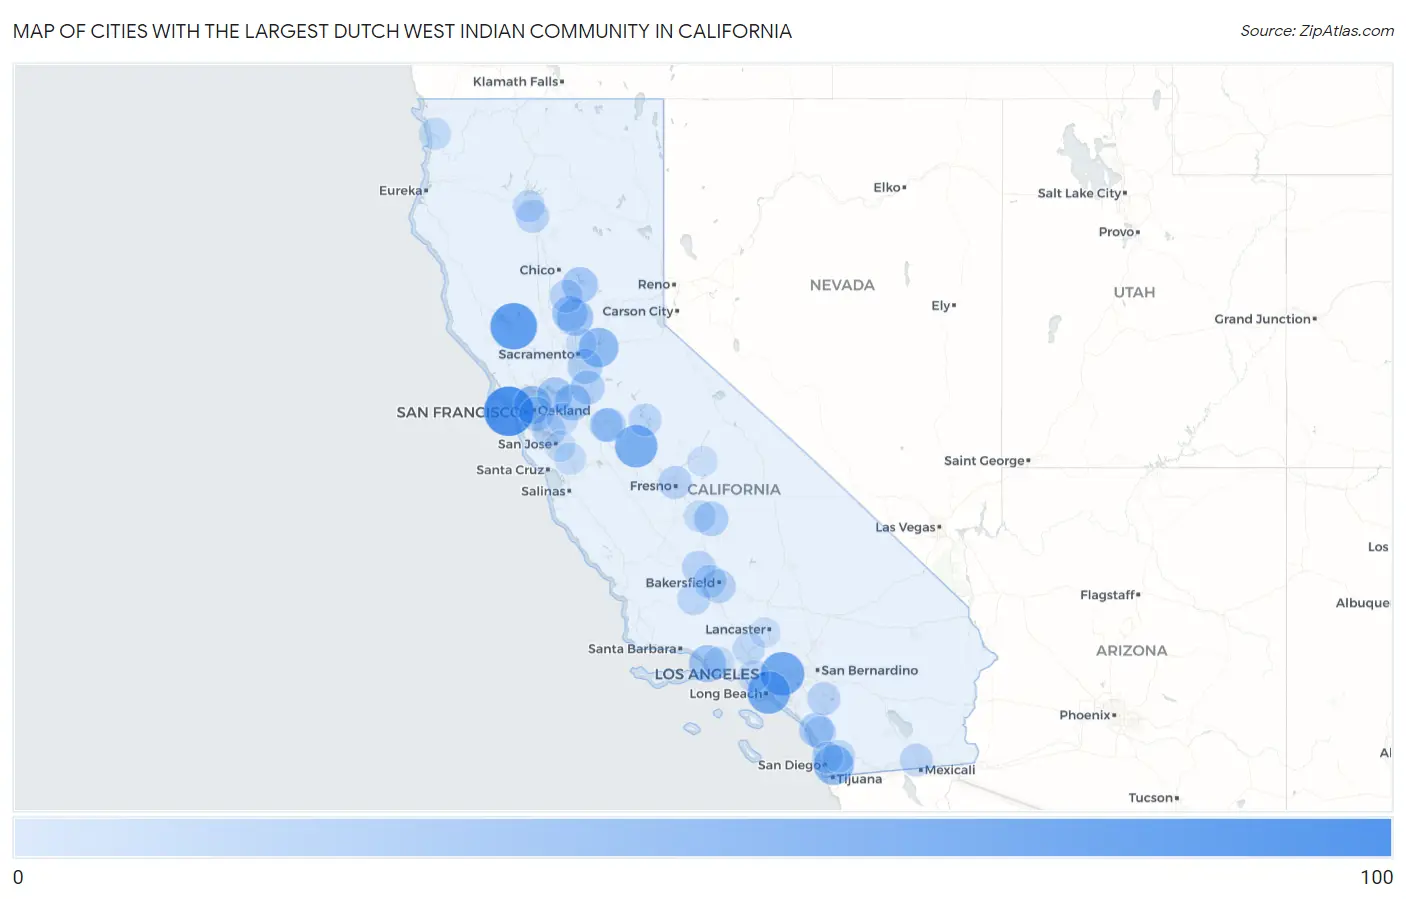
Map of Cities with the Largest Dutch West Indian Community in California
0
100
Cities with the Largest Dutch West Indian Community in California
| City | Dutch West Indian | vs State | vs National | |
| 1. | San Francisco | 83 | 1,056(7.86%)#1 | 27,716(0.30%)#37 |
| 2. | Clearlake | 70 | 1,056(6.63%)#2 | 27,716(0.25%)#48 |
| 3. | West Covina | 57 | 1,056(5.40%)#3 | 27,716(0.21%)#69 |
| 4. | Long Beach | 53 | 1,056(5.02%)#4 | 27,716(0.19%)#78 |
| 5. | Merced | 52 | 1,056(4.92%)#5 | 27,716(0.19%)#82 |
| 6. | La Presa | 41 | 1,056(3.88%)#6 | 27,716(0.15%)#115 |
| 7. | Folsom | 39 | 1,056(3.69%)#7 | 27,716(0.14%)#123 |
| 8. | Berkeley | 32 | 1,056(3.03%)#8 | 27,716(0.12%)#153 |
| 9. | Oxnard | 29 | 1,056(2.75%)#9 | 27,716(0.10%)#173 |
| 10. | Olivehurst | 27 | 1,056(2.56%)#10 | 27,716(0.10%)#190 |
| 11. | Discovery Bay | 25 | 1,056(2.37%)#11 | 27,716(0.09%)#204 |
| 12. | Kelly Ridge | 24 | 1,056(2.27%)#12 | 27,716(0.09%)#216 |
| 13. | Yuba City | 23 | 1,056(2.18%)#13 | 27,716(0.08%)#222 |
| 14. | Pittsburg | 22 | 1,056(2.08%)#14 | 27,716(0.08%)#229 |
| 15. | Elk Grove | 20 | 1,056(1.89%)#15 | 27,716(0.07%)#243 |
| 16. | Oceanside | 18 | 1,056(1.70%)#16 | 27,716(0.06%)#277 |
| 17. | Exeter | 18 | 1,056(1.70%)#17 | 27,716(0.06%)#283 |
| 18. | Oakland | 17 | 1,056(1.61%)#18 | 27,716(0.06%)#291 |
| 19. | Lodi | 17 | 1,056(1.61%)#19 | 27,716(0.06%)#294 |
| 20. | Ceres | 17 | 1,056(1.61%)#20 | 27,716(0.06%)#295 |
| 21. | Bakersfield | 15 | 1,056(1.42%)#21 | 27,716(0.05%)#329 |
| 22. | Modesto | 14 | 1,056(1.33%)#22 | 27,716(0.05%)#337 |
| 23. | Wasco | 14 | 1,056(1.33%)#23 | 27,716(0.05%)#345 |
| 24. | Fresno | 13 | 1,056(1.23%)#24 | 27,716(0.05%)#357 |
| 25. | Fremont | 13 | 1,056(1.23%)#25 | 27,716(0.05%)#360 |
| 26. | Menifee | 13 | 1,056(1.23%)#26 | 27,716(0.05%)#363 |
| 27. | Anderson | 13 | 1,056(1.23%)#27 | 27,716(0.05%)#370 |
| 28. | Gridley | 13 | 1,056(1.23%)#28 | 27,716(0.05%)#373 |
| 29. | El Centro | 12 | 1,056(1.14%)#29 | 27,716(0.04%)#387 |
| 30. | Rosedale | 12 | 1,056(1.14%)#30 | 27,716(0.04%)#391 |
| 31. | Lake Don Pedro | 12 | 1,056(1.14%)#31 | 27,716(0.04%)#403 |
| 32. | Taft Heights | 11 | 1,056(1.04%)#32 | 27,716(0.04%)#422 |
| 33. | Vista | 10 | 1,056(0.95%)#33 | 27,716(0.04%)#441 |
| 34. | Winter Gardens | 10 | 1,056(0.95%)#34 | 27,716(0.04%)#447 |
| 35. | Santa Clarita | 9 | 1,056(0.85%)#35 | 27,716(0.03%)#478 |
| 36. | Redding | 9 | 1,056(0.85%)#36 | 27,716(0.03%)#482 |
| 37. | Los Angeles | 8 | 1,056(0.76%)#37 | 27,716(0.03%)#511 |
| 38. | Visalia | 8 | 1,056(0.76%)#38 | 27,716(0.03%)#513 |
| 39. | Klamath | 8 | 1,056(0.76%)#39 | 27,716(0.03%)#536 |
| 40. | San Diego | 7 | 1,056(0.66%)#40 | 27,716(0.03%)#545 |
| 41. | Livermore | 7 | 1,056(0.66%)#41 | 27,716(0.03%)#550 |
| 42. | Morgan Hill | 7 | 1,056(0.66%)#42 | 27,716(0.03%)#555 |
| 43. | Camarillo | 6 | 1,056(0.57%)#43 | 27,716(0.02%)#580 |
| 44. | San Jose | 5 | 1,056(0.47%)#44 | 27,716(0.02%)#614 |
| 45. | Elverta | 3 | 1,056(0.28%)#45 | 27,716(0.01%)#722 |
| 46. | Quartz Hill | 2 | 1,056(0.19%)#46 | 27,716(0.01%)#770 |
| 47. | Shaver Lake | 2 | 1,056(0.19%)#47 | 27,716(0.01%)#811 |
Common Questions
What are the Top 10 Cities with the Largest Dutch West Indian Community in California?
Top 10 Cities with the Largest Dutch West Indian Community in California are:
#1
83
#2
70
#3
57
#4
53
#5
52
#6
41
#7
39
#8
32
#9
29
#10
27
What city has the Largest Dutch West Indian Community in California?
San Francisco has the Largest Dutch West Indian Community in California with 83.
What is the Total Dutch West Indian Population in the State of California?
Total Dutch West Indian Population in California is 1,056.
What is the Total Dutch West Indian Population in the United States?
Total Dutch West Indian Population in the United States is 27,716.