Hawaii Map & Demographics
Hawaii Map
Hawaii Overview
Aug 21, 1959
INCORPORATED
10,926
TOTAL AREA [ SQ MI ]
6,428
LAND AREA [ SQ MI ]
4,499
WATER AREA [ SQ MI ]
3,030
ELEVATION AVG [ FT ]
13,796
ELEVATION HIGH [ FT ]
Sea Level
ELEVATION LOW [ FT ]
225.7
POP DENSITY [ PPL / SQ MI ]
$42,683
PER CAPITA INCOME
$111,678
AVG FAMILY INCOME
$94,814
AVG HOUSEHOLD INCOME
22.5%
WAGE / INCOME GAP [ % ]
77.5¢/ $1
WAGE / INCOME GAP [ $ ]
$11,295
FAMILY INCOME DEFICIT
0.45
INEQUALITY / GINI INDEX
96706
LARGEST ZIP CODE
Urban Honolulu
LARGEST CITY
Honolulu County
LARGEST COUNTY
1,450,589
TOTAL POPULATION
732,060
MALE POPULATION
718,529
FEMALE POPULATION
101.88
MALES / 100 FEMALES
98.15
FEMALES / 100 MALES
39.9
MEDIAN AGE
3.5
AVG FAMILY SIZE
2.9
AVG HOUSEHOLD SIZE
760,259
LABOR FORCE [ PEOPLE ]
64.6%
PERCENT IN LABOR FORCE
5.1%
UNEMPLOYMENT RATE
Hawaii Area Codes
Income in Hawaii
Income Overview in Hawaii
Per Capita Income in Hawaii is $42,683, while median incomes of families and households are $111,678 and $94,814 respectively.
| Characteristic | Number | Measure |
| Per Capita Income | 1,450,589 | $42,683 |
| Median Family Income | 332,605 | $111,678 |
| Mean Family Income | 332,605 | $137,891 |
| Median Household Income | 483,906 | $94,814 |
| Mean Household Income | 483,906 | $122,902 |
| Income Deficit | 332,605 | $11,295 |
| Wage / Income Gap (%) | 1,450,589 | 22.54% |
| Wage / Income Gap ($) | 1,450,589 | 77.46¢ per $1 |
| Gini / Inequality Index | 1,450,589 | 0.45 |
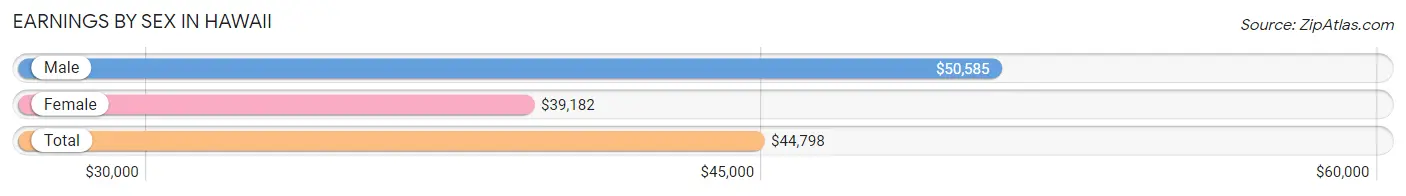
Earnings by Sex in Hawaii
Average Earnings in Hawaii are $44,798, $50,585 for men and $39,182 for women, a difference of 22.5%.
| Sex | Number | Average Earnings |
| Male | 418,304 (53.2%) | $50,585 |
| Female | 368,108 (46.8%) | $39,182 |
| Total | 786,412 (100.0%) | $44,798 |
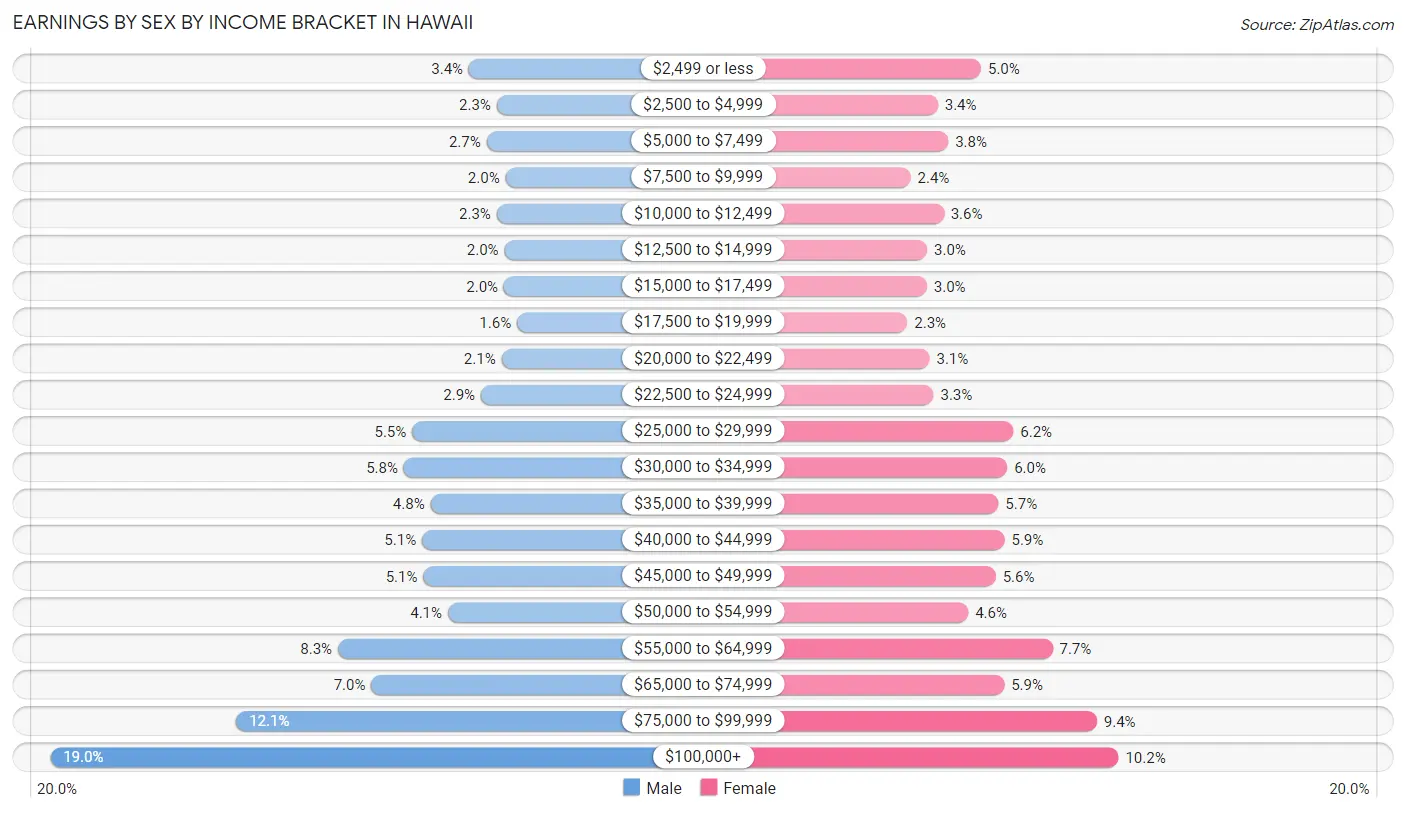
Earnings by Sex by Income Bracket in Hawaii
The most common earnings brackets in Hawaii are $100,000+ for men (79,626 | 19.0%) and $100,000+ for women (37,464 | 10.2%).
| Income | Male | Female |
| $2,499 or less | 14,028 (3.4%) | 18,507 (5.0%) |
| $2,500 to $4,999 | 9,654 (2.3%) | 12,543 (3.4%) |
| $5,000 to $7,499 | 11,261 (2.7%) | 13,977 (3.8%) |
| $7,500 to $9,999 | 8,280 (2.0%) | 8,809 (2.4%) |
| $10,000 to $12,499 | 9,679 (2.3%) | 13,359 (3.6%) |
| $12,500 to $14,999 | 8,436 (2.0%) | 11,085 (3.0%) |
| $15,000 to $17,499 | 8,515 (2.0%) | 11,048 (3.0%) |
| $17,500 to $19,999 | 6,479 (1.5%) | 8,367 (2.3%) |
| $20,000 to $22,499 | 8,892 (2.1%) | 11,402 (3.1%) |
| $22,500 to $24,999 | 12,114 (2.9%) | 11,971 (3.3%) |
| $25,000 to $29,999 | 22,911 (5.5%) | 22,960 (6.2%) |
| $30,000 to $34,999 | 24,205 (5.8%) | 22,121 (6.0%) |
| $35,000 to $39,999 | 20,035 (4.8%) | 20,899 (5.7%) |
| $40,000 to $44,999 | 21,369 (5.1%) | 21,757 (5.9%) |
| $45,000 to $49,999 | 21,155 (5.1%) | 20,526 (5.6%) |
| $50,000 to $54,999 | 17,301 (4.1%) | 16,731 (4.5%) |
| $55,000 to $64,999 | 34,558 (8.3%) | 28,365 (7.7%) |
| $65,000 to $74,999 | 29,317 (7.0%) | 21,707 (5.9%) |
| $75,000 to $99,999 | 50,489 (12.1%) | 34,510 (9.4%) |
| $100,000+ | 79,626 (19.0%) | 37,464 (10.2%) |
| Total | 418,304 (100.0%) | 368,108 (100.0%) |
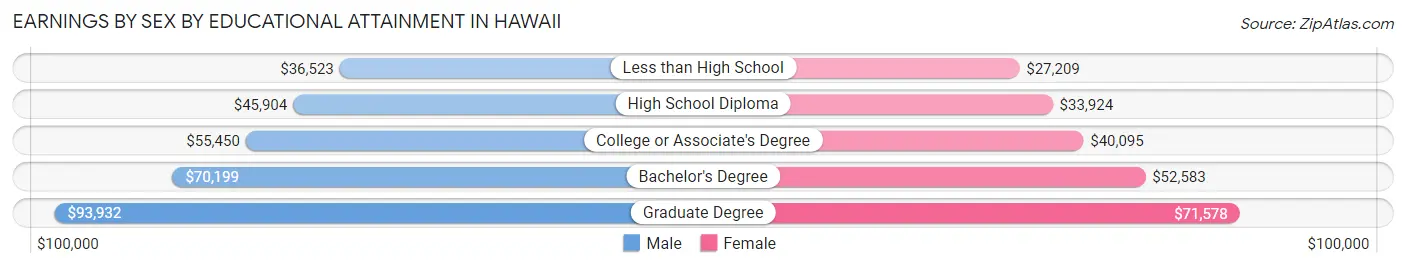
Earnings by Sex by Educational Attainment in Hawaii
Average earnings in Hawaii are $57,252 for men and $43,642 for women, a difference of 23.8%. Men with an educational attainment of graduate degree enjoy the highest average annual earnings of $93,932, while those with less than high school education earn the least with $36,523. Women with an educational attainment of graduate degree earn the most with the average annual earnings of $71,578, while those with less than high school education have the smallest earnings of $27,209.
| Educational Attainment | Male Income | Female Income |
| Less than High School | $36,523 | $27,209 |
| High School Diploma | $45,904 | $33,924 |
| College or Associate's Degree | $55,450 | $40,095 |
| Bachelor's Degree | $70,199 | $52,583 |
| Graduate Degree | $93,932 | $71,578 |
| Total | $57,252 | $43,642 |
Family Income in Hawaii
Family Income Brackets in Hawaii
According to the Hawaii family income data, there are 77,164 families falling into the $100,000 to $149,999 income range, which is the most common income bracket and makes up 23.2% of all families. Conversely, the $10,000 to $14,999 income bracket is the least frequent group with only 4,656 families (1.4%) belonging to this category.
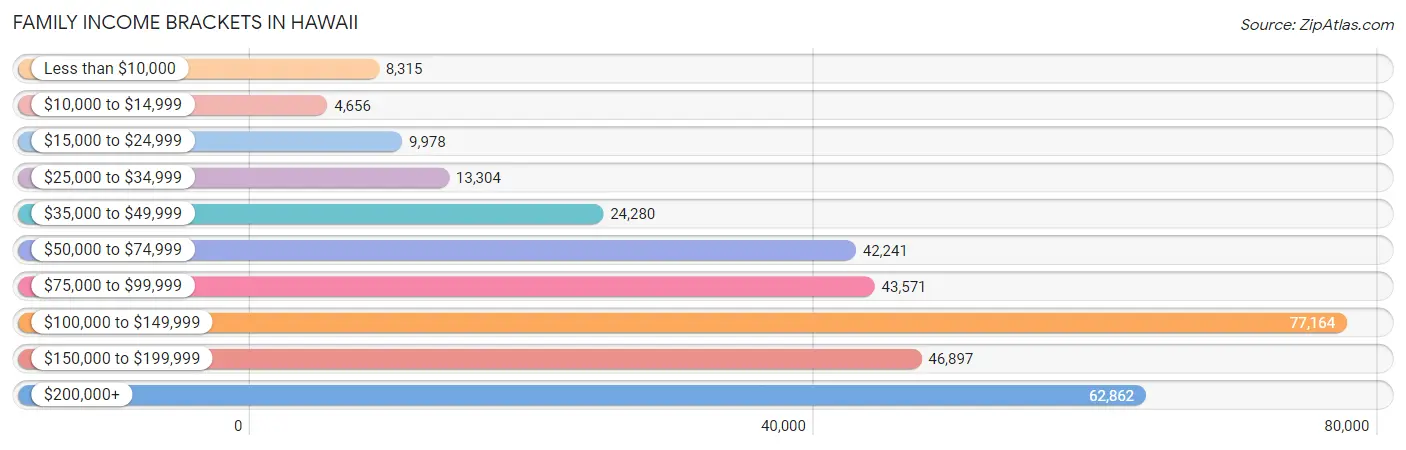
| Income Bracket | # Families | % Families |
| Less than $10,000 | 8,315 | 2.5% |
| $10,000 to $14,999 | 4,656 | 1.4% |
| $15,000 to $24,999 | 9,978 | 3.0% |
| $25,000 to $34,999 | 13,304 | 4.0% |
| $35,000 to $49,999 | 24,280 | 7.3% |
| $50,000 to $74,999 | 42,241 | 12.7% |
| $75,000 to $99,999 | 43,571 | 13.1% |
| $100,000 to $149,999 | 77,164 | 23.2% |
| $150,000 to $199,999 | 46,897 | 14.1% |
| $200,000+ | 62,862 | 18.9% |
Family Income by Famaliy Size in Hawaii
7+ person families (15,172 | 4.6%) account for the highest median family income in Hawaii with $184,069 per family, while 2-person families (142,136 | 42.7%) have the highest median income of $46,657 per family member.

| Income Bracket | # Families | Median Income |
| 2-Person Families | 142,136 (42.7%) | $93,314 |
| 3-Person Families | 73,678 (22.2%) | $112,096 |
| 4-Person Families | 58,385 (17.5%) | $129,108 |
| 5-Person Families | 29,134 (8.8%) | $129,221 |
| 6-Person Families | 14,100 (4.2%) | $141,300 |
| 7+ Person Families | 15,172 (4.6%) | $184,069 |
| Total | 332,605 (100.0%) | $111,678 |
Family Income by Number of Earners in Hawaii
The median family income in Hawaii is $111,678, with families comprising 3+ earners (56,499) having the highest median family income of $173,623, while families with no earners (44,418) have the lowest median family income of $60,076, accounting for 17.0% and 13.4% of families, respectively.
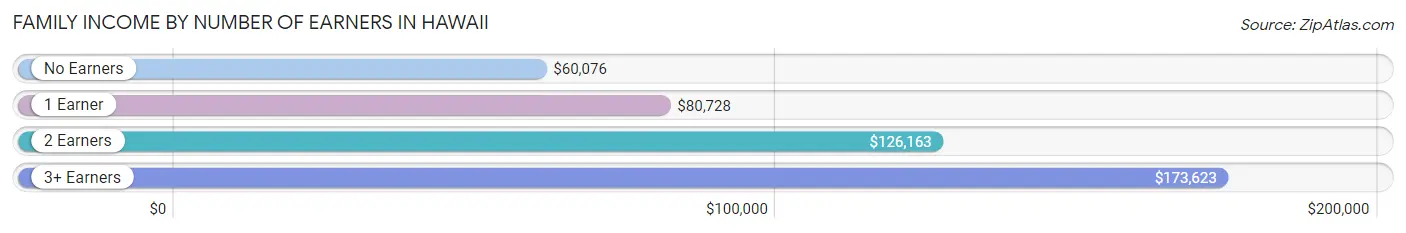
| Number of Earners | # Families | Median Income |
| No Earners | 44,418 (13.4%) | $60,076 |
| 1 Earner | 97,231 (29.2%) | $80,728 |
| 2 Earners | 134,457 (40.4%) | $126,163 |
| 3+ Earners | 56,499 (17.0%) | $173,623 |
| Total | 332,605 (100.0%) | $111,678 |
Household Income in Hawaii
Household Income Brackets in Hawaii
With 96,297 households falling in the category, the $100,000 to $149,999 income range is the most frequent in Hawaii, accounting for 19.9% of all households. In contrast, only 12,582 households (2.6%) fall into the $10,000 to $14,999 income bracket, making it the least populous group.

| Income Bracket | # Households | % Households |
| Less than $10,000 | 20,324 | 4.2% |
| $10,000 to $14,999 | 12,582 | 2.6% |
| $15,000 to $24,999 | 23,711 | 4.9% |
| $25,000 to $34,999 | 25,163 | 5.2% |
| $35,000 to $49,999 | 41,132 | 8.5% |
| $50,000 to $74,999 | 68,231 | 14.1% |
| $75,000 to $99,999 | 62,908 | 13.0% |
| $100,000 to $149,999 | 96,297 | 19.9% |
| $150,000 to $199,999 | 56,617 | 11.7% |
| $200,000+ | 76,941 | 15.9% |
Household Income by Householder Age in Hawaii
The median household income in Hawaii is $94,814, with the highest median household income of $110,596 found in the 45 to 64 years age bracket for the primary householder. A total of 172,856 households (35.7%) fall into this category. Meanwhile, the 15 to 24 years age bracket for the primary householder has the lowest median household income of $55,565, with 14,018 households (2.9%) in this group.
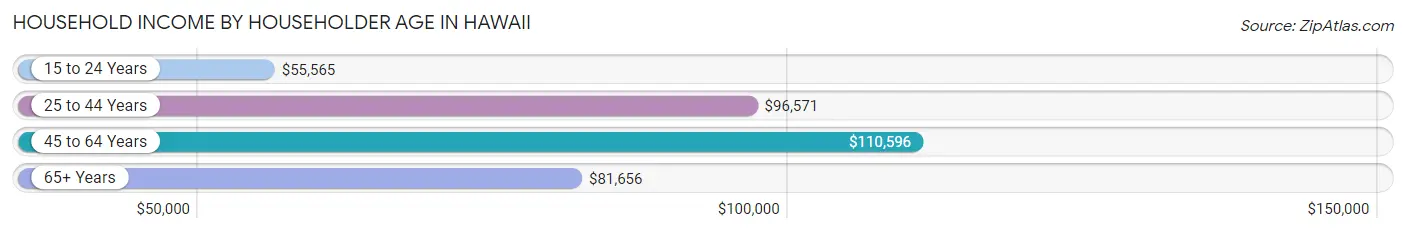
| Income Bracket | # Households | Median Income |
| 15 to 24 Years | 14,018 (2.9%) | $55,565 |
| 25 to 44 Years | 141,456 (29.2%) | $96,571 |
| 45 to 64 Years | 172,856 (35.7%) | $110,596 |
| 65+ Years | 155,576 (32.2%) | $81,656 |
| Total | 483,906 (100.0%) | $94,814 |
Poverty in Hawaii
Income Below Poverty by Sex and Age in Hawaii
With 9.0% poverty level for males and 10.2% for females among the residents of Hawaii, 6 to 11 year old males and 16 and 17 year old females are the most vulnerable to poverty, with 6,944 males (13.1%) and 2,316 females (14.9%) in their respective age groups living below the poverty level.
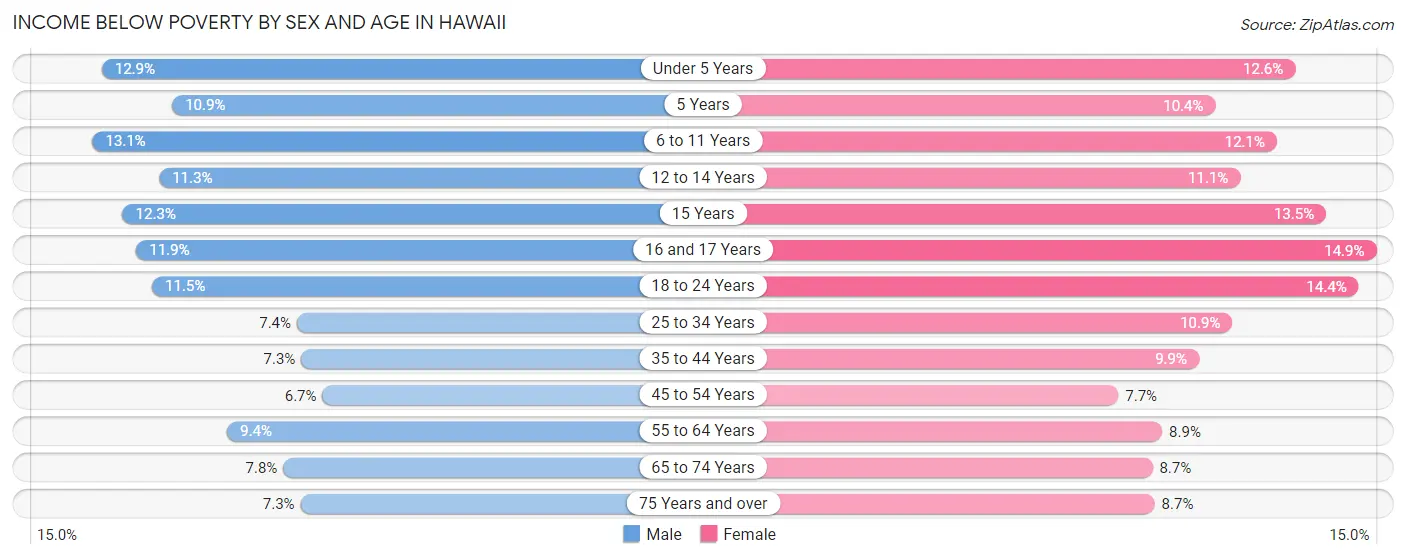
| Age Bracket | Male | Female |
| Under 5 Years | 5,403 (12.9%) | 4,988 (12.6%) |
| 5 Years | 887 (10.9%) | 760 (10.4%) |
| 6 to 11 Years | 6,944 (13.1%) | 6,001 (12.1%) |
| 12 to 14 Years | 2,959 (11.3%) | 2,720 (11.1%) |
| 15 Years | 1,067 (12.3%) | 1,040 (13.5%) |
| 16 and 17 Years | 1,892 (11.9%) | 2,316 (14.9%) |
| 18 to 24 Years | 6,389 (11.5%) | 7,381 (14.4%) |
| 25 to 34 Years | 7,391 (7.4%) | 10,207 (10.9%) |
| 35 to 44 Years | 7,002 (7.3%) | 9,141 (9.9%) |
| 45 to 54 Years | 5,796 (6.7%) | 6,547 (7.7%) |
| 55 to 64 Years | 8,425 (9.4%) | 8,153 (8.9%) |
| 65 to 74 Years | 5,945 (7.8%) | 7,009 (8.6%) |
| 75 Years and over | 3,613 (7.3%) | 5,965 (8.7%) |
| Total | 63,713 (9.0%) | 72,228 (10.2%) |
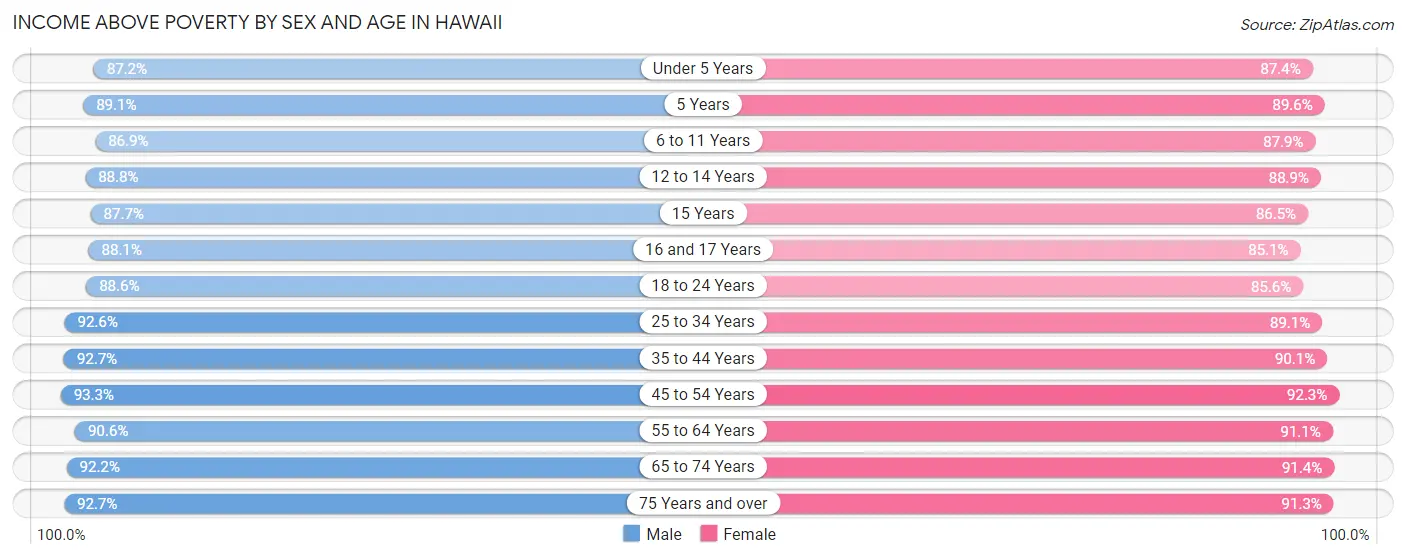
Income Above Poverty by Sex and Age in Hawaii
According to the poverty statistics in Hawaii, males aged 45 to 54 years and females aged 45 to 54 years are the age groups that are most secure financially, with 93.3% of males and 92.3% of females in these age groups living above the poverty line.
| Age Bracket | Male | Female |
| Under 5 Years | 36,656 (87.2%) | 34,542 (87.4%) |
| 5 Years | 7,260 (89.1%) | 6,545 (89.6%) |
| 6 to 11 Years | 46,010 (86.9%) | 43,569 (87.9%) |
| 12 to 14 Years | 23,345 (88.7%) | 21,816 (88.9%) |
| 15 Years | 7,632 (87.7%) | 6,676 (86.5%) |
| 16 and 17 Years | 14,014 (88.1%) | 13,246 (85.1%) |
| 18 to 24 Years | 49,388 (88.5%) | 43,915 (85.6%) |
| 25 to 34 Years | 92,169 (92.6%) | 83,717 (89.1%) |
| 35 to 44 Years | 88,979 (92.7%) | 82,788 (90.1%) |
| 45 to 54 Years | 80,595 (93.3%) | 78,480 (92.3%) |
| 55 to 64 Years | 81,593 (90.6%) | 83,250 (91.1%) |
| 65 to 74 Years | 70,258 (92.2%) | 74,003 (91.3%) |
| 75 Years and over | 45,729 (92.7%) | 62,520 (91.3%) |
| Total | 643,628 (91.0%) | 635,067 (89.8%) |
Income Below Poverty Among Married-Couple Families in Hawaii
The poverty statistics for married-couple families in Hawaii show that 3.8% or 9,220 of the total 244,407 families live below the poverty line. Families with 5 or more children have the highest poverty rate of 22.8%, comprising of 577 families. On the other hand, families with 1 or 2 children have the lowest poverty rate of 3.0%, which includes 2,367 families.

| Children | Above Poverty | Below Poverty |
| No Children | 139,766 (96.8%) | 4,661 (3.2%) |
| 1 or 2 Children | 75,200 (97.0%) | 2,367 (3.0%) |
| 3 or 4 Children | 18,268 (91.9%) | 1,615 (8.1%) |
| 5 or more Children | 1,953 (77.2%) | 577 (22.8%) |
| Total | 235,187 (96.2%) | 9,220 (3.8%) |
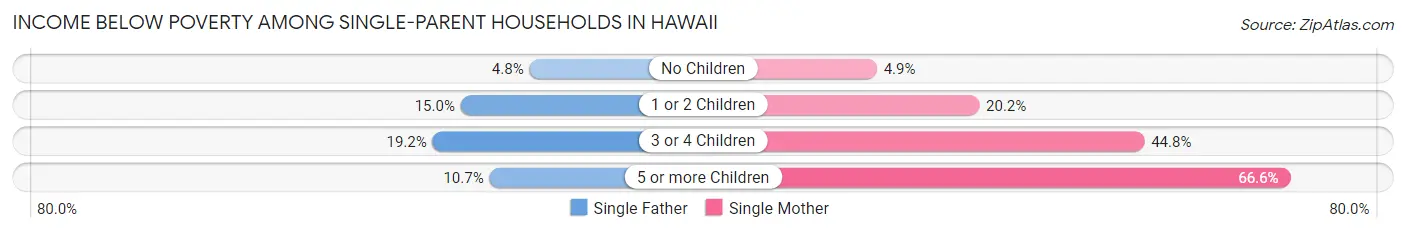
Income Below Poverty Among Single-Parent Households in Hawaii
According to the poverty data in Hawaii, 10.2% or 2,760 single-father households and 15.9% or 9,720 single-mother households are living below the poverty line. Among single-father households, those with 3 or 4 children have the highest poverty rate, with 455 households (19.2%) experiencing poverty. Likewise, among single-mother households, those with 5 or more children have the highest poverty rate, with 448 households (66.6%) falling below the poverty line.
| Children | Single Father | Single Mother |
| No Children | 649 (4.8%) | 1,401 (4.9%) |
| 1 or 2 Children | 1,637 (15.0%) | 5,298 (20.2%) |
| 3 or 4 Children | 455 (19.2%) | 2,573 (44.8%) |
| 5 or more Children | 19 (10.7%) | 448 (66.6%) |
| Total | 2,760 (10.2%) | 9,720 (15.9%) |
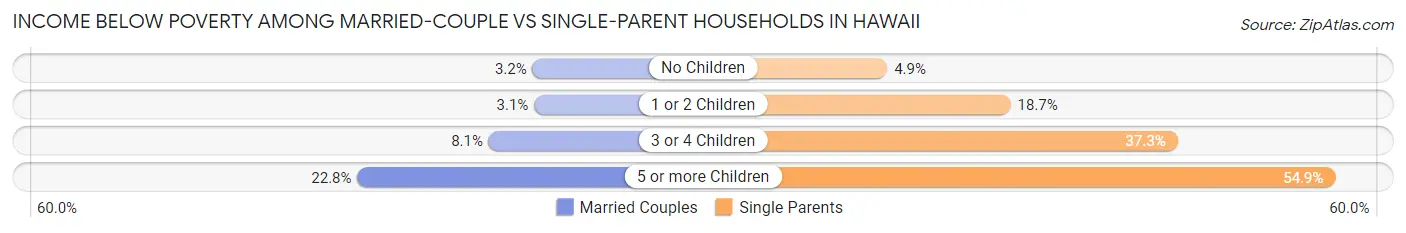
Income Below Poverty Among Married-Couple vs Single-Parent Households in Hawaii
The poverty data for Hawaii shows that 9,220 of the married-couple family households (3.8%) and 12,480 of the single-parent households (14.1%) are living below the poverty level. Within the married-couple family households, those with 5 or more children have the highest poverty rate, with 577 households (22.8%) falling below the poverty line. Among the single-parent households, those with 5 or more children have the highest poverty rate, with 467 household (54.9%) living below poverty.
| Children | Married-Couple Families | Single-Parent Households |
| No Children | 4,661 (3.2%) | 2,050 (4.9%) |
| 1 or 2 Children | 2,367 (3.0%) | 6,935 (18.7%) |
| 3 or 4 Children | 1,615 (8.1%) | 3,028 (37.3%) |
| 5 or more Children | 577 (22.8%) | 467 (54.9%) |
| Total | 9,220 (3.8%) | 12,480 (14.1%) |
Largest Zip Codes by Population in Hawaii
The largest zip codes in Hawaii by population are 96706 (82,504), 96797 (72,605), 96818 (57,938), 96744 (55,888), and 96817 (55,316).
1.96706
82,504 (5.69%)
2.96797
72,605 (5.01%)
3.96818
57,938 (3.99%)
4.96744
55,888 (3.85%)
5.96817
55,316 (3.81%)
6.96789
54,362 (3.75%)
7.96819
52,328 (3.61%)
8.96734
51,966 (3.58%)
9.96792
51,367 (3.54%)
10.96816
50,793 (3.50%)
11.96720
50,453 (3.48%)
12.96707
49,623 (3.42%)
13.96822
45,038 (3.10%)
14.96786
42,778 (2.95%)
15.96701
41,560 (2.87%)
16.96740
40,886 (2.82%)
17.96782
38,674 (2.67%)
18.96793
33,414 (2.30%)
19.96825
30,444 (2.10%)
20.96826
30,068 (2.07%)
21.96753
28,909 (1.99%)
22.96815
27,010 (1.86%)
23.96813
25,957 (1.79%)
24.96732
25,902 (1.79%)
25.96761
23,214 (1.60%)
26.96814
22,723 (1.57%)
27.96746
20,473 (1.41%)
28.96821
18,802 (1.30%)
29.96768
18,662 (1.29%)
30.96749
18,482 (1.27%)
Largest Cities by Population in Hawaii
The largest cities in Hawaii by population are Urban Honolulu (348,547), East Honolulu (49,491), Hilo (47,627), Pearl City (46,812), and Kailua CDP Honolulu County (40,323).
348,547 (24.03%)
49,491 (3.41%)
3.Hilo
47,627 (3.28%)
46,812 (3.23%)
40,323 (2.78%)
6.Waipahu
39,873 (2.75%)
7.Kaneohe
35,493 (2.45%)
27,423 (1.89%)
9.Kahului
27,233 (1.88%)
10.Ewa Gentry
27,198 (1.87%)
11.Kapolei
22,701 (1.56%)
12.Kihei
22,247 (1.53%)
21,546 (1.49%)
21,449 (1.48%)
15.Makakilo
21,055 (1.45%)
18,133 (1.25%)
17.Wahiawa
17,400 (1.20%)
18.Wailuku
16,590 (1.14%)
19.Ocean Pointe
16,173 (1.11%)
20.Ewa Beach
15,167 (1.05%)
21.Halawa
14,411 (0.99%)
22.Waimalu
13,932 (0.96%)
23.Royal Kunia
13,919 (0.96%)
24.Waianae
13,749 (0.95%)
13,041 (0.90%)
26.Lahaina
12,906 (0.89%)
27.Nanakuli
12,370 (0.85%)
28.Maili
12,114 (0.84%)
29.Kaiminani
11,731 (0.81%)
30.Kaneohe Base
11,683 (0.81%)
Largest Counties by Population in Hawaii
The largest counties in Hawaii by population are Honolulu County (1,010,100), Hawaii County (202,163), Maui County (164,765), Kauai County (73,511), and Kalawao County (50).
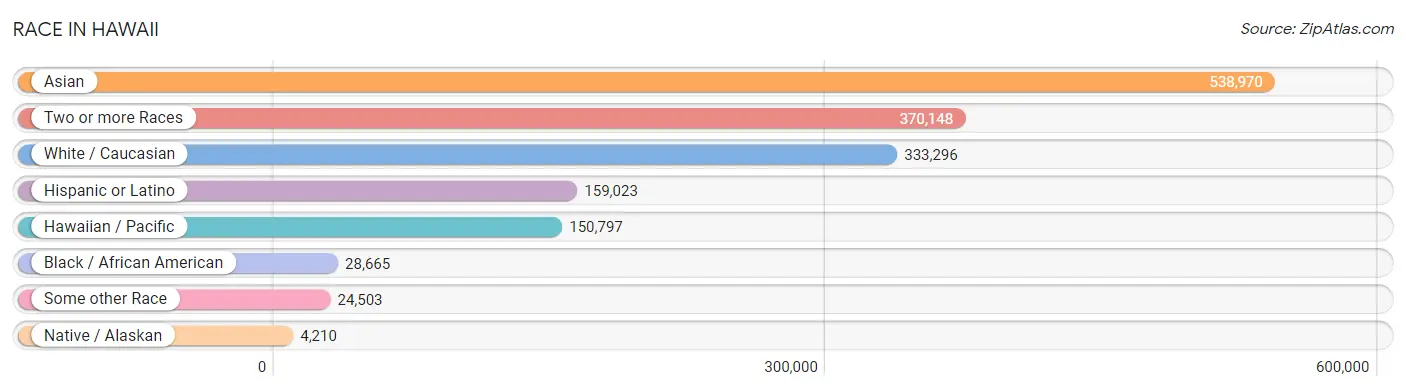
Race in Hawaii
The most populous races in Hawaii are Asian (538,970 | 37.2%), Two or more Races (370,148 | 25.5%), and White / Caucasian (333,296 | 23.0%).
| Race | # Population | % Population |
| Asian | 538,970 | 37.2% |
| Black / African American | 28,665 | 2.0% |
| Hawaiian / Pacific | 150,797 | 10.4% |
| Hispanic or Latino | 159,023 | 11.0% |
| Native / Alaskan | 4,210 | 0.3% |
| White / Caucasian | 333,296 | 23.0% |
| Two or more Races | 370,148 | 25.5% |
| Some other Race | 24,503 | 1.7% |
| Total | 1,450,589 | 100.0% |
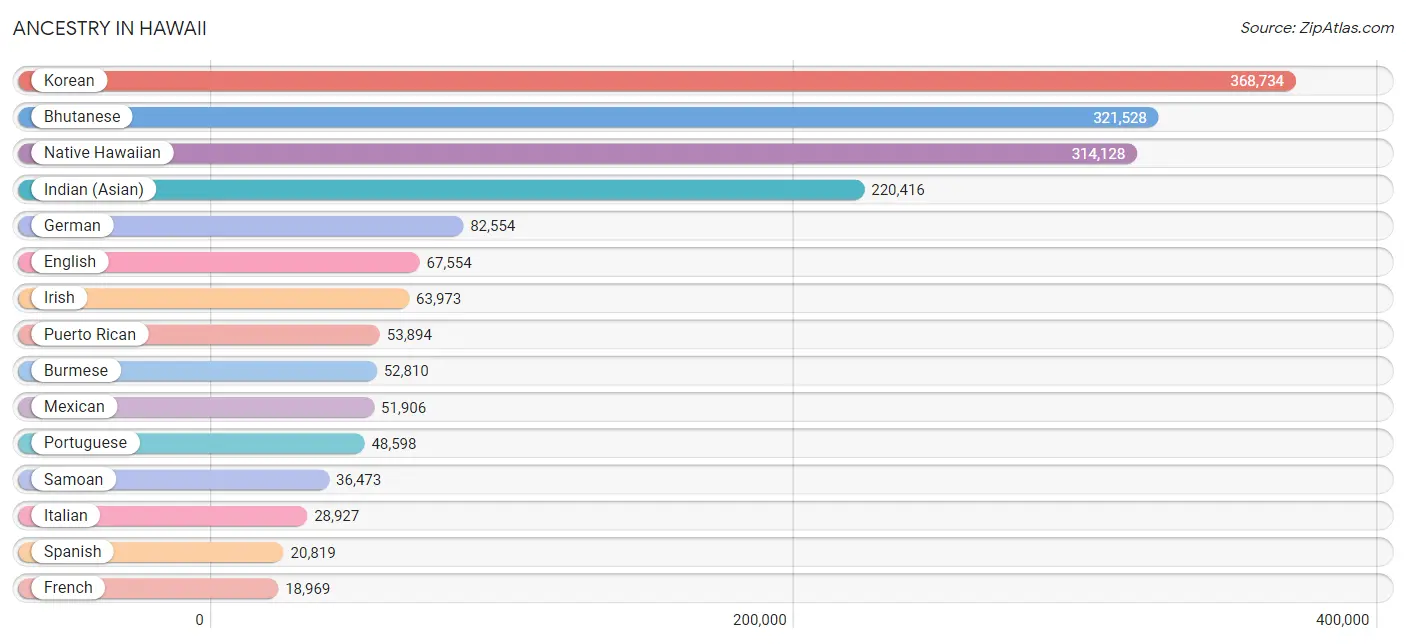
Ancestry in Hawaii
The most populous ancestries reported in Hawaii are Korean (368,734 | 25.4%), Bhutanese (321,528 | 22.2%), Native Hawaiian (314,128 | 21.7%), Indian (Asian) (220,416 | 15.2%), and German (82,554 | 5.7%), together accounting for 90.1% of all Hawaii residents.
| Ancestry | # Population | % Population |
| Afghan | 90 | 0.0% |
| African | 2,411 | 0.2% |
| Alaska Native | 73 | 0.0% |
| Alaskan Athabascan | 160 | 0.0% |
| Albanian | 60 | 0.0% |
| Aleut | 53 | 0.0% |
| Alsatian | 36 | 0.0% |
| American | 18,350 | 1.3% |
| Apache | 1,358 | 0.1% |
| Arab | 2,371 | 0.2% |
| Argentinean | 805 | 0.1% |
| Armenian | 324 | 0.0% |
| Assyrian / Chaldean / Syriac | 20 | 0.0% |
| Australian | 765 | 0.1% |
| Austrian | 1,574 | 0.1% |
| Bangladeshi | 142 | 0.0% |
| Barbadian | 20 | 0.0% |
| Basque | 141 | 0.0% |
| Belgian | 676 | 0.1% |
| Belizean | 164 | 0.0% |
| Bermudan | 39 | 0.0% |
| Bhutanese | 321,528 | 22.2% |
| Blackfeet | 1,825 | 0.1% |
| Bolivian | 131 | 0.0% |
| Brazilian | 946 | 0.1% |
| British | 4,279 | 0.3% |
| British West Indian | 113 | 0.0% |
| Bulgarian | 483 | 0.0% |
| Burmese | 52,810 | 3.6% |
| Cajun | 27 | 0.0% |
| Cambodian | 293 | 0.0% |
| Canadian | 1,537 | 0.1% |
| Cape Verdean | 56 | 0.0% |
| Celtic | 67 | 0.0% |
| Central American | 5,460 | 0.4% |
| Central American Indian | 1,251 | 0.1% |
| Cherokee | 10,889 | 0.7% |
| Cheyenne | 260 | 0.0% |
| Chickasaw | 285 | 0.0% |
| Chilean | 551 | 0.0% |
| Chinese | 10,403 | 0.7% |
| Chippewa | 837 | 0.1% |
| Choctaw | 955 | 0.1% |
| Colombian | 1,620 | 0.1% |
| Colville | 47 | 0.0% |
| Comanche | 81 | 0.0% |
| Costa Rican | 250 | 0.0% |
| Cree | 43 | 0.0% |
| Creek | 211 | 0.0% |
| Croatian | 795 | 0.1% |
| Crow | 26 | 0.0% |
| Cuban | 1,993 | 0.1% |
| Czech | 2,043 | 0.1% |
| Czechoslovakian | 512 | 0.0% |
| Danish | 3,114 | 0.2% |
| Delaware | 92 | 0.0% |
| Dominican | 1,521 | 0.1% |
| Dutch | 6,607 | 0.5% |
| Eastern European | 1,533 | 0.1% |
| Ecuadorian | 470 | 0.0% |
| Egyptian | 315 | 0.0% |
| English | 67,554 | 4.7% |
| Estonian | 175 | 0.0% |
| Ethiopian | 92 | 0.0% |
| European | 15,063 | 1.0% |
| Fijian | 9,253 | 0.6% |
| Filipino | 2,167 | 0.2% |
| Finnish | 1,669 | 0.1% |
| French | 18,969 | 1.3% |
| French American Indian | 88 | 0.0% |
| French Canadian | 2,692 | 0.2% |
| German | 82,554 | 5.7% |
| German Russian | 17 | 0.0% |
| Ghanaian | 251 | 0.0% |
| Greek | 2,868 | 0.2% |
| Guamanian / Chamorro | 6,640 | 0.5% |
| Guatemalan | 1,592 | 0.1% |
| Guyanese | 96 | 0.0% |
| Haitian | 957 | 0.1% |
| Honduran | 776 | 0.1% |
| Hopi | 24 | 0.0% |
| Hungarian | 2,340 | 0.2% |
| Icelander | 307 | 0.0% |
| Indian (Asian) | 220,416 | 15.2% |
| Indonesian | 190 | 0.0% |
| Inupiat | 111 | 0.0% |
| Iranian | 1,029 | 0.1% |
| Iraqi | 16 | 0.0% |
| Irish | 63,973 | 4.4% |
| Iroquois | 736 | 0.1% |
| Israeli | 294 | 0.0% |
| Italian | 28,927 | 2.0% |
| Jamaican | 1,121 | 0.1% |
| Japanese | 869 | 0.1% |
| Jordanian | 23 | 0.0% |
| Kenyan | 81 | 0.0% |
| Kiowa | 5 | 0.0% |
| Korean | 368,734 | 25.4% |
| Laotian | 1,169 | 0.1% |
| Latvian | 244 | 0.0% |
| Lebanese | 849 | 0.1% |
| Liberian | 42 | 0.0% |
| Lithuanian | 946 | 0.1% |
| Lumbee | 207 | 0.0% |
| Luxembourger | 86 | 0.0% |
| Macedonian | 63 | 0.0% |
| Malaysian | 2,670 | 0.2% |
| Maltese | 23 | 0.0% |
| Marshallese | 4,393 | 0.3% |
| Menominee | 3 | 0.0% |
| Mexican | 51,906 | 3.6% |
| Mexican American Indian | 1,726 | 0.1% |
| Mongolian | 193 | 0.0% |
| Moroccan | 128 | 0.0% |
| Native Hawaiian | 314,128 | 21.7% |
| Navajo | 1,283 | 0.1% |
| Nepalese | 20 | 0.0% |
| New Zealander | 190 | 0.0% |
| Nicaraguan | 298 | 0.0% |
| Nigerian | 336 | 0.0% |
| Northern European | 1,739 | 0.1% |
| Norwegian | 10,112 | 0.7% |
| Okinawan | 94 | 0.0% |
| Osage | 64 | 0.0% |
| Ottawa | 24 | 0.0% |
| Paiute | 72 | 0.0% |
| Pakistani | 5,697 | 0.4% |
| Palestinian | 206 | 0.0% |
| Panamanian | 883 | 0.1% |
| Paraguayan | 38 | 0.0% |
| Pennsylvania German | 217 | 0.0% |
| Peruvian | 1,123 | 0.1% |
| Pima | 4 | 0.0% |
| Polish | 12,682 | 0.9% |
| Portuguese | 48,598 | 3.4% |
| Potawatomi | 98 | 0.0% |
| Pueblo | 547 | 0.0% |
| Puerto Rican | 53,894 | 3.7% |
| Puget Sound Salish | 9 | 0.0% |
| Romanian | 917 | 0.1% |
| Russian | 6,548 | 0.4% |
| Salvadoran | 1,650 | 0.1% |
| Samoan | 36,473 | 2.5% |
| Scandinavian | 3,266 | 0.2% |
| Scotch-Irish | 5,985 | 0.4% |
| Scottish | 12,888 | 0.9% |
| Seminole | 205 | 0.0% |
| Serbian | 480 | 0.0% |
| Shoshone | 146 | 0.0% |
| Sierra Leonean | 5 | 0.0% |
| Sioux | 758 | 0.1% |
| Slavic | 337 | 0.0% |
| Slovak | 585 | 0.0% |
| Slovene | 234 | 0.0% |
| South African | 400 | 0.0% |
| South American | 5,818 | 0.4% |
| South American Indian | 360 | 0.0% |
| Soviet Union | 19 | 0.0% |
| Spaniard | 11,658 | 0.8% |
| Spanish | 20,819 | 1.4% |
| Spanish American | 367 | 0.0% |
| Spanish American Indian | 63 | 0.0% |
| Sri Lankan | 17,032 | 1.2% |
| Subsaharan African | 4,165 | 0.3% |
| Sudanese | 23 | 0.0% |
| Swedish | 9,035 | 0.6% |
| Swiss | 2,342 | 0.2% |
| Syrian | 189 | 0.0% |
| Taiwanese | 42 | 0.0% |
| Thai | 5,578 | 0.4% |
| Tlingit-Haida | 365 | 0.0% |
| Tohono O'Odham | 71 | 0.0% |
| Tongan | 9,535 | 0.7% |
| Trinidadian and Tobagonian | 143 | 0.0% |
| Tsimshian | 22 | 0.0% |
| Turkish | 350 | 0.0% |
| Ukrainian | 2,079 | 0.1% |
| Uruguayan | 89 | 0.0% |
| Ute | 89 | 0.0% |
| Venezuelan | 925 | 0.1% |
| Vietnamese | 139 | 0.0% |
| Welsh | 4,265 | 0.3% |
| West Indian | 482 | 0.0% |
| Yaqui | 279 | 0.0% |
| Yugoslavian | 296 | 0.0% |
| Yuman | 3 | 0.0% |
| Yup'ik | 66 | 0.0% |
| Zimbabwean | 118 | 0.0% | View All 188 Rows |
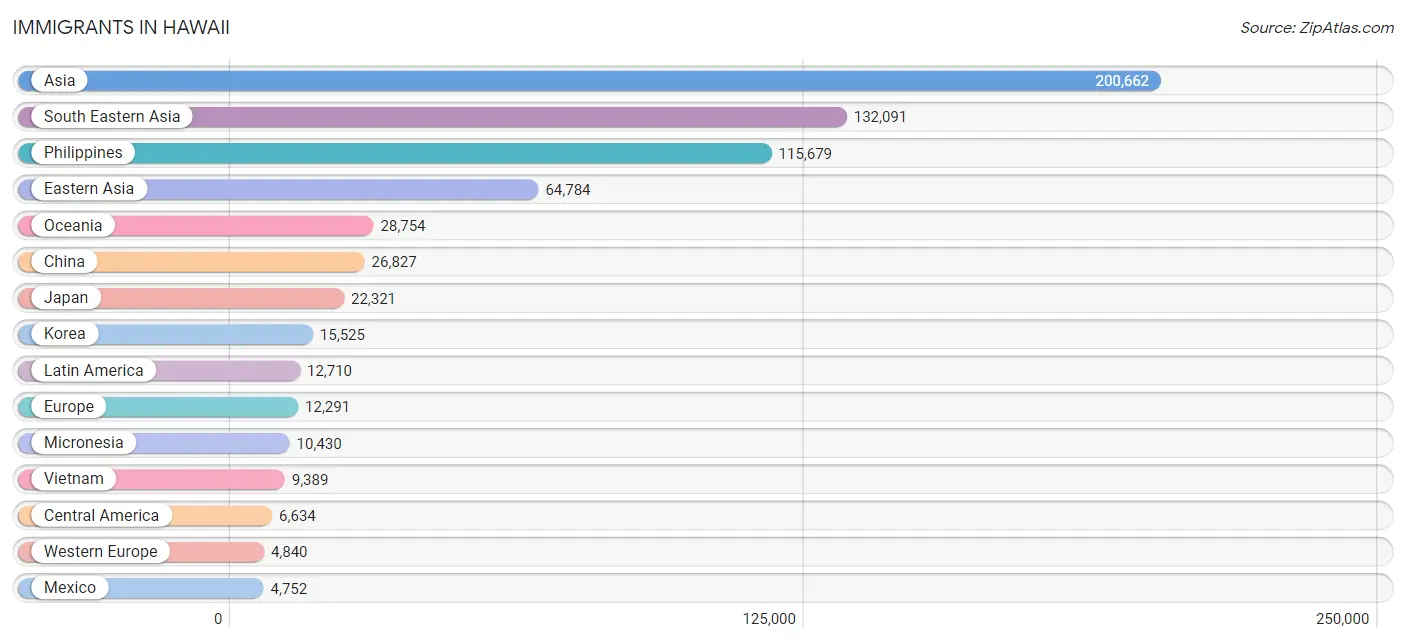
Immigrants in Hawaii
The most numerous immigrant groups reported in Hawaii came from Asia (200,662 | 13.8%), South Eastern Asia (132,091 | 9.1%), Philippines (115,679 | 8.0%), Eastern Asia (64,784 | 4.5%), and Oceania (28,754 | 2.0%), together accounting for 37.4% of all Hawaii residents.
| Immigration Origin | # Population | % Population |
| Afghanistan | 49 | 0.0% |
| Africa | 2,290 | 0.2% |
| Albania | 4 | 0.0% |
| Argentina | 326 | 0.0% |
| Asia | 200,662 | 13.8% |
| Australia | 1,171 | 0.1% |
| Austria | 126 | 0.0% |
| Azores | 4 | 0.0% |
| Bahamas | 35 | 0.0% |
| Bangladesh | 80 | 0.0% |
| Barbados | 34 | 0.0% |
| Belarus | 77 | 0.0% |
| Belgium | 177 | 0.0% |
| Belize | 121 | 0.0% |
| Bolivia | 13 | 0.0% |
| Bosnia and Herzegovina | 99 | 0.0% |
| Brazil | 1,617 | 0.1% |
| Bulgaria | 476 | 0.0% |
| Cabo Verde | 19 | 0.0% |
| Cambodia | 331 | 0.0% |
| Cameroon | 101 | 0.0% |
| Canada | 4,635 | 0.3% |
| Caribbean | 1,942 | 0.1% |
| Central America | 6,634 | 0.5% |
| Chile | 363 | 0.0% |
| China | 26,827 | 1.8% |
| Colombia | 608 | 0.0% |
| Congo | 120 | 0.0% |
| Costa Rica | 72 | 0.0% |
| Croatia | 122 | 0.0% |
| Cuba | 180 | 0.0% |
| Czechoslovakia | 249 | 0.0% |
| Denmark | 183 | 0.0% |
| Dominica | 1 | 0.0% |
| Dominican Republic | 288 | 0.0% |
| Eastern Africa | 384 | 0.0% |
| Eastern Asia | 64,784 | 4.5% |
| Eastern Europe | 3,409 | 0.2% |
| Ecuador | 201 | 0.0% |
| Egypt | 190 | 0.0% |
| El Salvador | 282 | 0.0% |
| England | 893 | 0.1% |
| Eritrea | 31 | 0.0% |
| Ethiopia | 17 | 0.0% |
| Europe | 12,291 | 0.9% |
| Fiji | 393 | 0.0% |
| France | 979 | 0.1% |
| Germany | 2,843 | 0.2% |
| Ghana | 268 | 0.0% |
| Greece | 50 | 0.0% |
| Grenada | 99 | 0.0% |
| Guatemala | 726 | 0.1% |
| Guyana | 69 | 0.0% |
| Haiti | 378 | 0.0% |
| Honduras | 398 | 0.0% |
| Hong Kong | 4,291 | 0.3% |
| Hungary | 107 | 0.0% |
| India | 1,303 | 0.1% |
| Indonesia | 798 | 0.1% |
| Iran | 712 | 0.1% |
| Iraq | 33 | 0.0% |
| Ireland | 277 | 0.0% |
| Israel | 221 | 0.0% |
| Italy | 333 | 0.0% |
| Jamaica | 469 | 0.0% |
| Japan | 22,321 | 1.5% |
| Jordan | 25 | 0.0% |
| Kazakhstan | 61 | 0.0% |
| Kenya | 103 | 0.0% |
| Korea | 15,525 | 1.1% |
| Laos | 1,164 | 0.1% |
| Latin America | 12,710 | 0.9% |
| Latvia | 48 | 0.0% |
| Lebanon | 48 | 0.0% |
| Liberia | 35 | 0.0% |
| Lithuania | 83 | 0.0% |
| Malaysia | 1,009 | 0.1% |
| Mexico | 4,752 | 0.3% |
| Micronesia | 10,430 | 0.7% |
| Middle Africa | 238 | 0.0% |
| Moldova | 29 | 0.0% |
| Morocco | 9 | 0.0% |
| Nepal | 191 | 0.0% |
| Netherlands | 363 | 0.0% |
| Nicaragua | 131 | 0.0% |
| Nigeria | 55 | 0.0% |
| North Macedonia | 11 | 0.0% |
| Northern Africa | 303 | 0.0% |
| Northern Europe | 3,139 | 0.2% |
| Norway | 138 | 0.0% |
| Oceania | 28,754 | 2.0% |
| Pakistan | 82 | 0.0% |
| Panama | 152 | 0.0% |
| Peru | 314 | 0.0% |
| Philippines | 115,679 | 8.0% |
| Poland | 404 | 0.0% |
| Portugal | 182 | 0.0% |
| Romania | 286 | 0.0% |
| Russia | 734 | 0.1% |
| Saudi Arabia | 64 | 0.0% |
| Scotland | 19 | 0.0% |
| Serbia | 109 | 0.0% |
| Sierra Leone | 27 | 0.0% |
| Singapore | 305 | 0.0% |
| South Africa | 787 | 0.1% |
| South America | 4,134 | 0.3% |
| South Central Asia | 2,865 | 0.2% |
| South Eastern Asia | 132,091 | 9.1% |
| Southern Europe | 891 | 0.1% |
| Spain | 314 | 0.0% |
| Sri Lanka | 238 | 0.0% |
| Sudan | 45 | 0.0% |
| Sweden | 246 | 0.0% |
| Switzerland | 352 | 0.0% |
| Taiwan | 2,701 | 0.2% |
| Thailand | 3,276 | 0.2% |
| Trinidad and Tobago | 346 | 0.0% |
| Turkey | 215 | 0.0% |
| Ukraine | 331 | 0.0% |
| Uruguay | 82 | 0.0% |
| Uzbekistan | 34 | 0.0% |
| Venezuela | 504 | 0.0% |
| Vietnam | 9,389 | 0.6% |
| West Indies | 23 | 0.0% |
| Western Africa | 492 | 0.0% |
| Western Asia | 648 | 0.0% |
| Western Europe | 4,840 | 0.3% |
| Yemen | 3 | 0.0% |
| Zaire | 5 | 0.0% |
| Zimbabwe | 104 | 0.0% | View All 130 Rows |
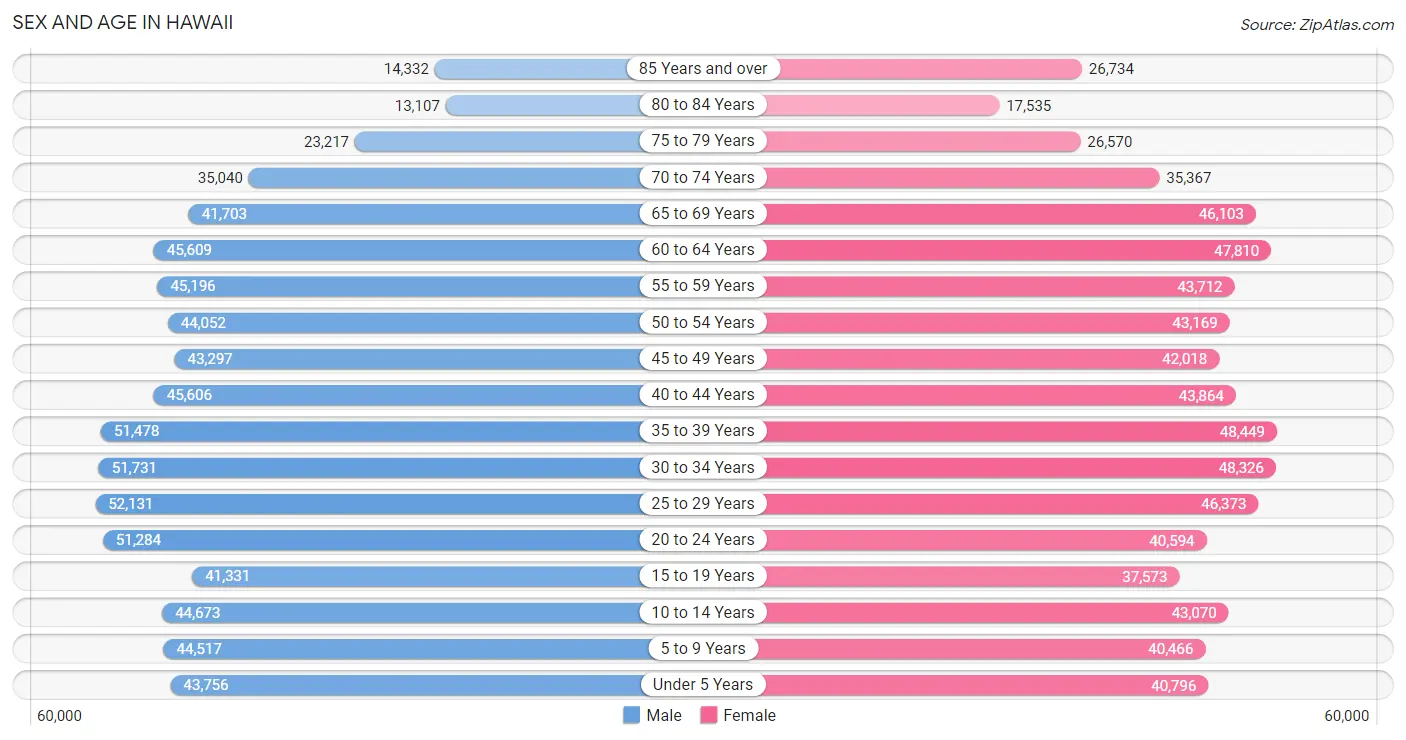
Sex and Age in Hawaii
Sex and Age in Hawaii
The most populous age groups in Hawaii are 25 to 29 Years (52,131 | 7.1%) for men and 35 to 39 Years (48,449 | 6.7%) for women.
| Age Bracket | Male | Female |
| Under 5 Years | 43,756 (6.0%) | 40,796 (5.7%) |
| 5 to 9 Years | 44,517 (6.1%) | 40,466 (5.6%) |
| 10 to 14 Years | 44,673 (6.1%) | 43,070 (6.0%) |
| 15 to 19 Years | 41,331 (5.7%) | 37,573 (5.2%) |
| 20 to 24 Years | 51,284 (7.0%) | 40,594 (5.7%) |
| 25 to 29 Years | 52,131 (7.1%) | 46,373 (6.5%) |
| 30 to 34 Years | 51,731 (7.1%) | 48,326 (6.7%) |
| 35 to 39 Years | 51,478 (7.0%) | 48,449 (6.7%) |
| 40 to 44 Years | 45,606 (6.2%) | 43,864 (6.1%) |
| 45 to 49 Years | 43,297 (5.9%) | 42,018 (5.9%) |
| 50 to 54 Years | 44,052 (6.0%) | 43,169 (6.0%) |
| 55 to 59 Years | 45,196 (6.2%) | 43,712 (6.1%) |
| 60 to 64 Years | 45,609 (6.2%) | 47,810 (6.7%) |
| 65 to 69 Years | 41,703 (5.7%) | 46,103 (6.4%) |
| 70 to 74 Years | 35,040 (4.8%) | 35,367 (4.9%) |
| 75 to 79 Years | 23,217 (3.2%) | 26,570 (3.7%) |
| 80 to 84 Years | 13,107 (1.8%) | 17,535 (2.4%) |
| 85 Years and over | 14,332 (2.0%) | 26,734 (3.7%) |
| Total | 732,060 (100.0%) | 718,529 (100.0%) |
Families and Households in Hawaii
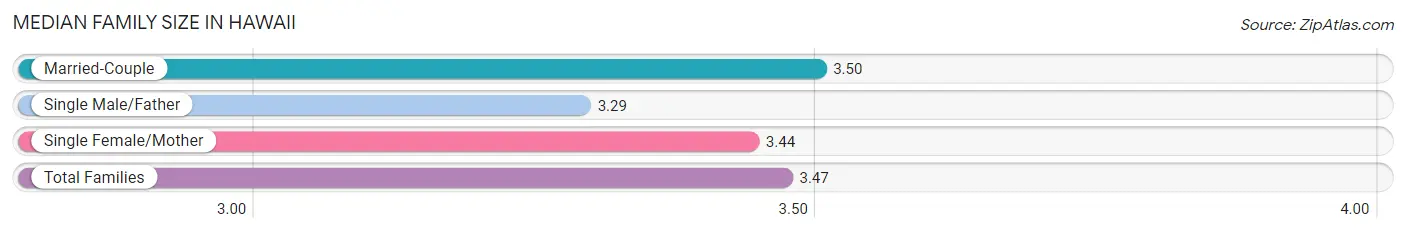
Median Family Size in Hawaii
The median family size in Hawaii is 3.47 persons per family, with married-couple families (244,407 | 73.5%) accounting for the largest median family size of 3.5 persons per family. On the other hand, single male/father families (27,057 | 8.1%) represent the smallest median family size with 3.29 persons per family.
| Family Type | # Families | Family Size |
| Married-Couple | 244,407 (73.5%) | 3.50 |
| Single Male/Father | 27,057 (8.1%) | 3.29 |
| Single Female/Mother | 61,141 (18.4%) | 3.44 |
| Total Families | 332,605 (100.0%) | 3.47 |
Median Household Size in Hawaii
The median household size in Hawaii is 2.92 persons per household, with single female/mother households (61,141 | 12.6%) accounting for the largest median household size of 3.75 persons per household. non-family households (151,301 | 31.3%) represent the smallest median household size with 1.32 persons per household.
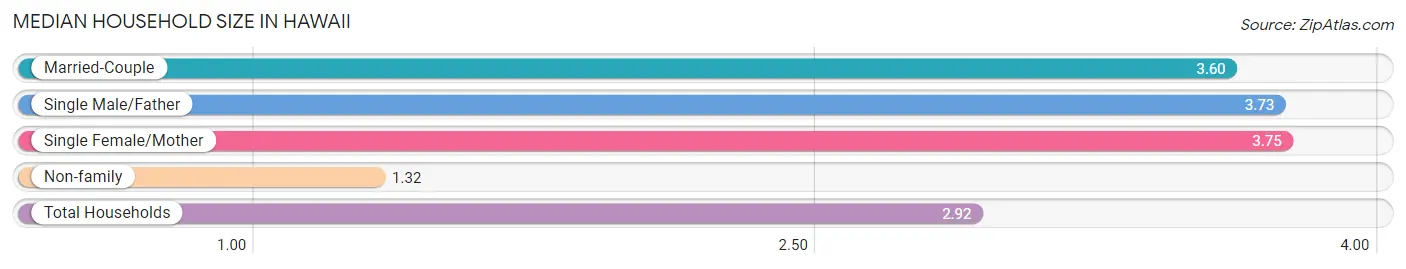
| Household Type | # Households | Household Size |
| Married-Couple | 244,407 (50.5%) | 3.60 |
| Single Male/Father | 27,057 (5.6%) | 3.73 |
| Single Female/Mother | 61,141 (12.6%) | 3.75 |
| Non-family | 151,301 (31.3%) | 1.32 |
| Total Households | 483,906 (100.0%) | 2.92 |
Household Size by Marriage Status in Hawaii
Out of a total of 483,906 households in Hawaii, 332,605 (68.7%) are family households, while 151,301 (31.3%) are nonfamily households. The most numerous type of family households are 2-person households, comprising 130,163, and the most common type of nonfamily households are 1-person households, comprising 118,744.
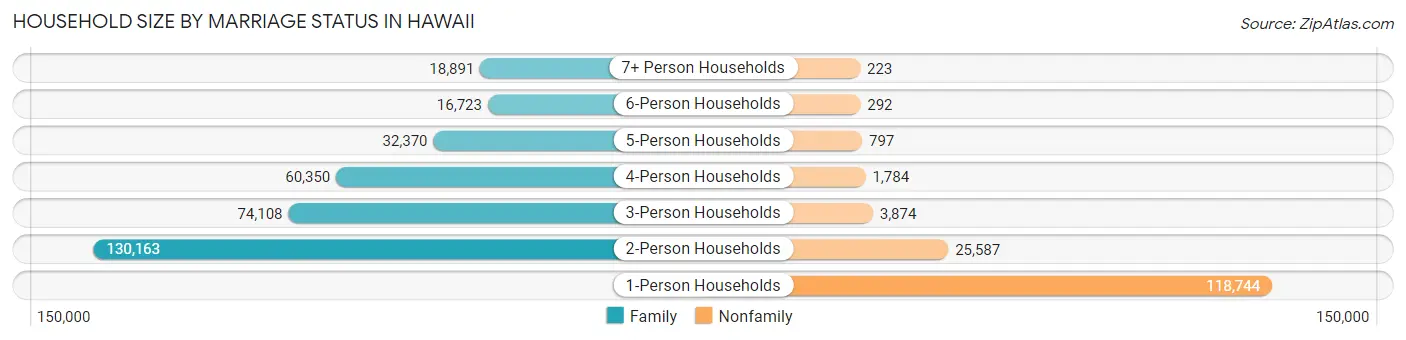
| Household Size | Family Households | Nonfamily Households |
| 1-Person Households | - | 118,744 (24.5%) |
| 2-Person Households | 130,163 (26.9%) | 25,587 (5.3%) |
| 3-Person Households | 74,108 (15.3%) | 3,874 (0.8%) |
| 4-Person Households | 60,350 (12.5%) | 1,784 (0.4%) |
| 5-Person Households | 32,370 (6.7%) | 797 (0.2%) |
| 6-Person Households | 16,723 (3.5%) | 292 (0.1%) |
| 7+ Person Households | 18,891 (3.9%) | 223 (0.1%) |
| Total | 332,605 (68.7%) | 151,301 (31.3%) |
Female Fertility in Hawaii
Fertility by Age in Hawaii
Average fertility rate in Hawaii is 57.0 births per 1,000 women. Women in the age bracket of 20 to 34 years have the highest fertility rate with 83.0 births per 1,000 women. Women in the age bracket of 20 to 34 years acount for 61.8% of all women with births.
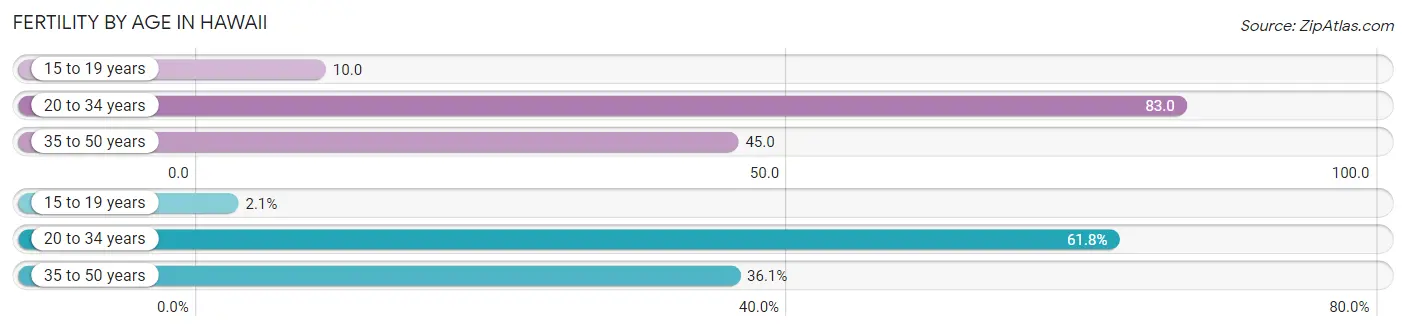
| Age Bracket | Women with Births | Births / 1,000 Women |
| 15 to 19 years | 374 (2.1%) | 10.0 |
| 20 to 34 years | 11,162 (61.8%) | 83.0 |
| 35 to 50 years | 6,519 (36.1%) | 45.0 |
| Total | 18,055 (100.0%) | 57.0 |
Fertility by Age by Marriage Status in Hawaii
70.7% of women with births (18,055) in Hawaii are married. The highest percentage of unmarried women with births falls into 15 to 19 years age bracket with 88.0% of them unmarried at the time of birth, while the lowest percentage of unmarried women with births belong to 35 to 50 years age bracket with 18.3% of them unmarried.

| Age Bracket | Married | Unmarried |
| 15 to 19 years | 45 (12.0%) | 329 (88.0%) |
| 20 to 34 years | 7,400 (66.3%) | 3,762 (33.7%) |
| 35 to 50 years | 5,326 (81.7%) | 1,193 (18.3%) |
| Total | 12,765 (70.7%) | 5,290 (29.3%) |
Fertility by Education in Hawaii
Average fertility rate in Hawaii is 57.0 births per 1,000 women. Women with the education attainment of graduate degree have the highest fertility rate of 65.0 births per 1,000 women, while women with the education attainment of less than high school have the lowest fertility at 30.0 births per 1,000 women. Women with the education attainment of college or associate's degree represent 33.7% of all women with births.

| Educational Attainment | Women with Births | Births / 1,000 Women |
| Less than High School | 1,100 (6.1%) | 30.0 |
| High School Diploma | 4,386 (24.3%) | 59.0 |
| College or Associate's Degree | 6,084 (33.7%) | 62.0 |
| Bachelor's Degree | 4,192 (23.2%) | 58.0 |
| Graduate Degree | 2,293 (12.7%) | 65.0 |
| Total | 18,055 (100.0%) | 57.0 |
Fertility by Education by Marriage Status in Hawaii
29.3% of women with births in Hawaii are unmarried. Women with the educational attainment of graduate degree are most likely to be married with 90.2% of them married at childbirth, while women with the educational attainment of less than high school are least likely to be married with 68.3% of them unmarried at childbirth.
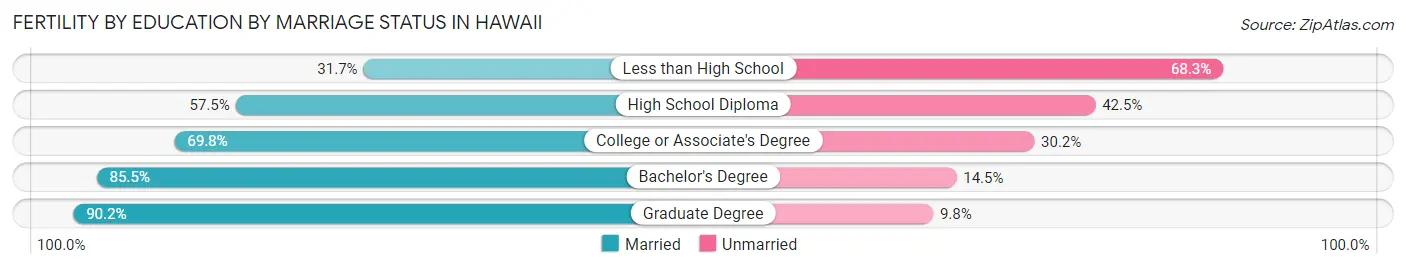
| Educational Attainment | Married | Unmarried |
| Less than High School | 349 (31.7%) | 751 (68.3%) |
| High School Diploma | 2,522 (57.5%) | 1,864 (42.5%) |
| College or Associate's Degree | 4,247 (69.8%) | 1,837 (30.2%) |
| Bachelor's Degree | 3,584 (85.5%) | 608 (14.5%) |
| Graduate Degree | 2,068 (90.2%) | 225 (9.8%) |
| Total | 12,765 (70.7%) | 5,290 (29.3%) |
Employment Characteristics in Hawaii
Employment by Class of Employer in Hawaii
Among the 704,432 employed individuals in Hawaii, private company employees (387,018 | 54.9%), federal government employees (96,148 | 13.7%), and state government employees (62,085 | 8.8%) make up the most common classes of employment.
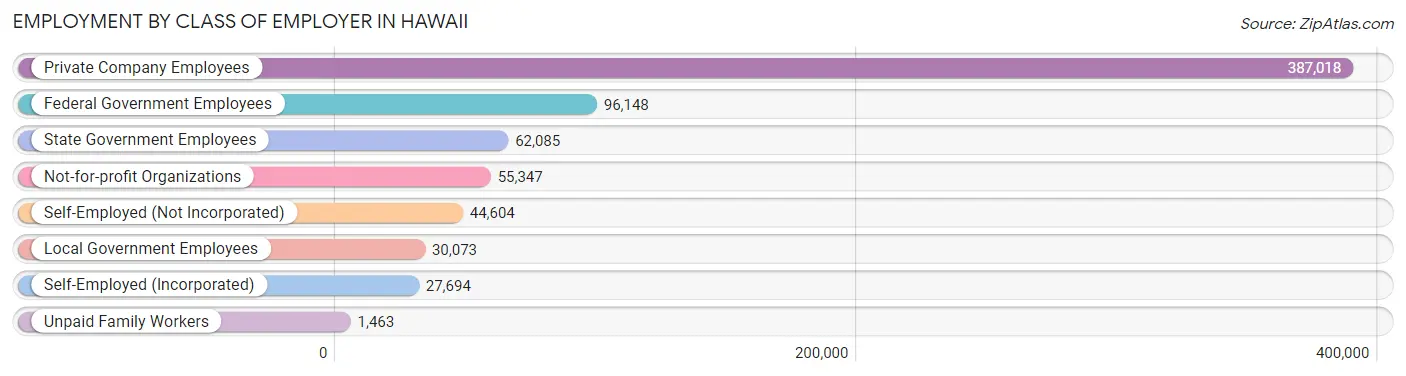
| Employer Class | # Employees | % Employees |
| Private Company Employees | 387,018 | 54.9% |
| Self-Employed (Incorporated) | 27,694 | 3.9% |
| Self-Employed (Not Incorporated) | 44,604 | 6.3% |
| Not-for-profit Organizations | 55,347 | 7.9% |
| Local Government Employees | 30,073 | 4.3% |
| State Government Employees | 62,085 | 8.8% |
| Federal Government Employees | 96,148 | 13.7% |
| Unpaid Family Workers | 1,463 | 0.2% |
| Total | 704,432 | 100.0% |
Employment Status by Age in Hawaii
According to the labor force statistics for Hawaii, out of the total population over 16 years of age (1,176,872), 64.6% or 760,259 individuals are in the labor force, with 5.1% or 38,773 of them unemployed. The age group with the highest labor force participation rate is 35 to 44 years, with 84.7% or 160,419 individuals in the labor force. Within the labor force, the 16 to 19 years age range has the highest percentage of unemployed individuals, with 16.2% or 3,855 of them being unemployed.
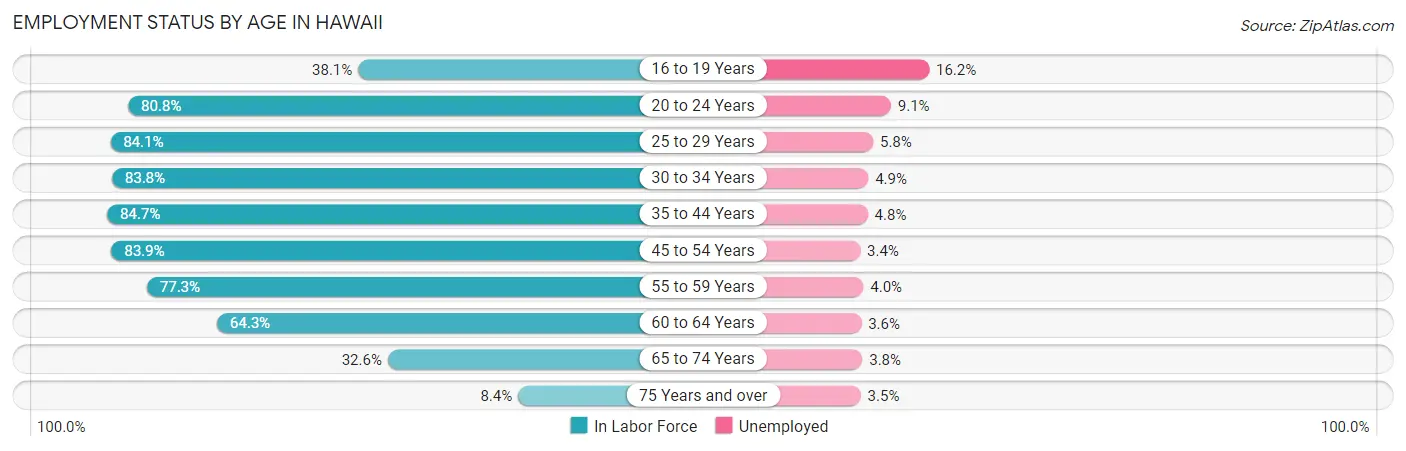
| Age Bracket | In Labor Force | Unemployed |
| 16 to 19 Years | 23,799 (38.1%) | 3,855 (16.2%) |
| 20 to 24 Years | 74,237 (80.8%) | 6,756 (9.1%) |
| 25 to 29 Years | 82,842 (84.1%) | 4,805 (5.8%) |
| 30 to 34 Years | 83,848 (83.8%) | 4,109 (4.9%) |
| 35 to 44 Years | 160,419 (84.7%) | 7,700 (4.8%) |
| 45 to 54 Years | 144,758 (83.9%) | 4,922 (3.4%) |
| 55 to 59 Years | 68,726 (77.3%) | 2,749 (4.0%) |
| 60 to 64 Years | 60,068 (64.3%) | 2,162 (3.6%) |
| 65 to 74 Years | 51,577 (32.6%) | 1,960 (3.8%) |
| 75 Years and over | 10,206 (8.4%) | 357 (3.5%) |
| Total | 760,259 (64.6%) | 38,773 (5.1%) |
Employment Status by Educational Attainment in Hawaii
According to labor force statistics for Hawaii, 80.8% of individuals (600,199) out of the total population between 25 and 64 years of age (742,821) are in the labor force, with 4.4% or 26,409 of them being unemployed. The group with the highest labor force participation rate are those with the educational attainment of bachelor's degree or higher, with 86.8% or 228,973 individuals in the labor force. Within the labor force, individuals with less than high school education have the highest percentage of unemployment, with 7.1% or 1,896 of them being unemployed.
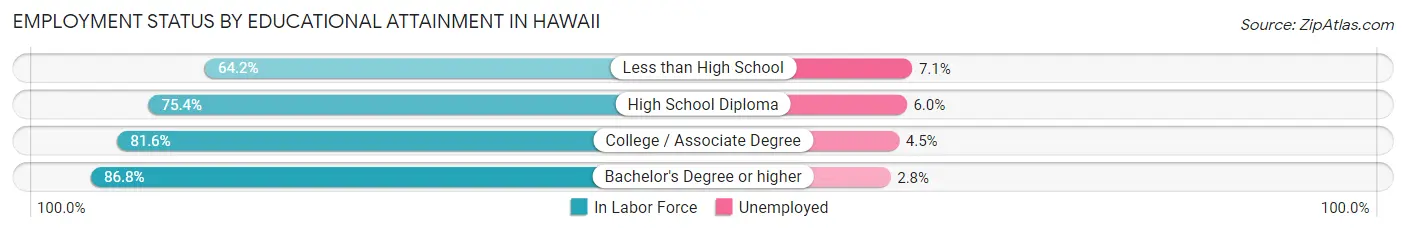
| Educational Attainment | In Labor Force | Unemployed |
| Less than High School | 26,707 (64.2%) | 2,954 (7.1%) |
| High School Diploma | 148,080 (75.4%) | 11,784 (6.0%) |
| College / Associate Degree | 196,685 (81.6%) | 10,847 (4.5%) |
| Bachelor's Degree or higher | 228,973 (86.8%) | 7,386 (2.8%) |
| Total | 600,199 (80.8%) | 32,684 (4.4%) |
Employment Occupations by Sex in Hawaii
Management, Business, Science and Arts Occupations
The most common Management, Business, Science and Arts occupations in Hawaii are Community & Social Service (80,294 | 11.9%), Management (69,072 | 10.2%), Education Instruction & Library (45,998 | 6.8%), Health Diagnosing & Treating (38,721 | 5.7%), and Computers, Engineering & Science (34,962 | 5.2%).
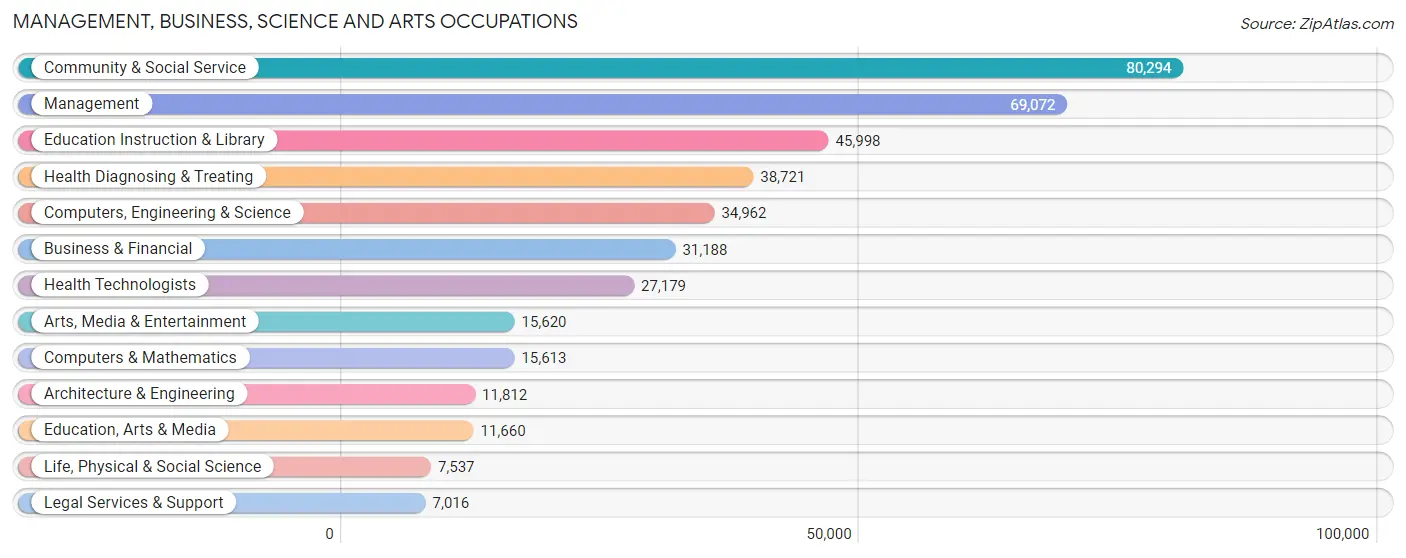
Management, Business, Science and Arts Occupations by Sex
Within the Management, Business, Science and Arts occupations in Hawaii, the most male-oriented occupations are Architecture & Engineering (85.0%), Computers & Mathematics (74.2%), and Computers, Engineering & Science (73.1%), while the most female-oriented occupations are Education Instruction & Library (72.3%), Health Diagnosing & Treating (68.0%), and Health Technologists (67.3%).
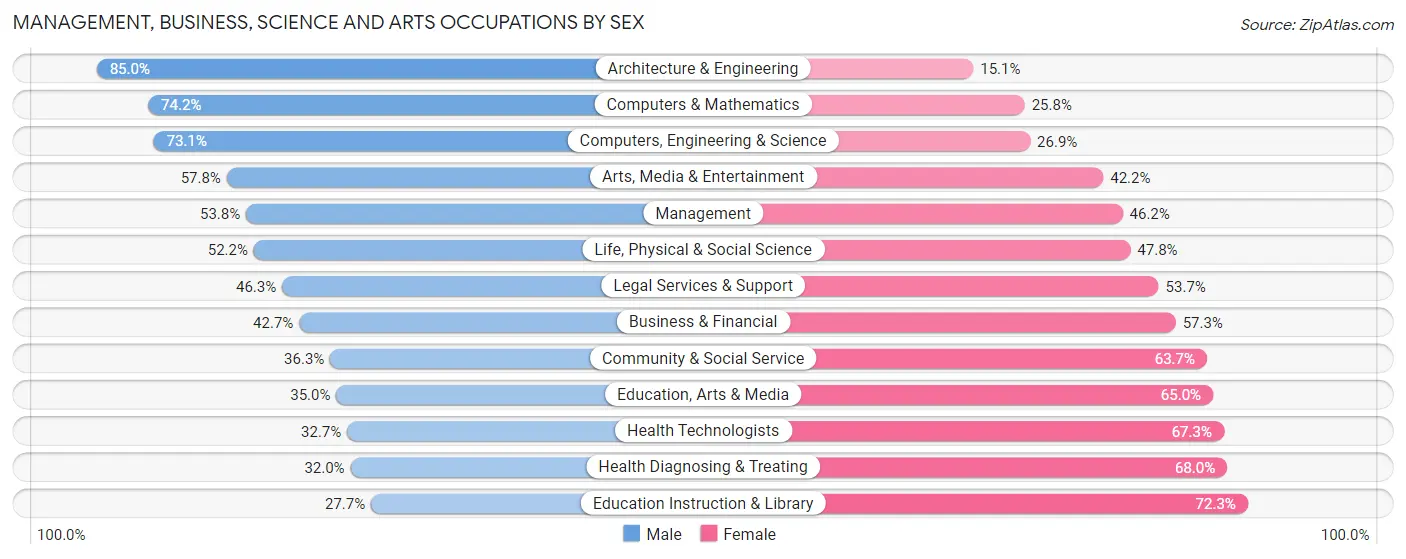
| Occupation | Male | Female |
| Management | 37,171 (53.8%) | 31,901 (46.2%) |
| Business & Financial | 13,328 (42.7%) | 17,860 (57.3%) |
| Computers, Engineering & Science | 25,555 (73.1%) | 9,407 (26.9%) |
| Computers & Mathematics | 11,588 (74.2%) | 4,025 (25.8%) |
| Architecture & Engineering | 10,034 (85.0%) | 1,778 (15.0%) |
| Life, Physical & Social Science | 3,933 (52.2%) | 3,604 (47.8%) |
| Community & Social Service | 29,118 (36.3%) | 51,176 (63.7%) |
| Education, Arts & Media | 4,079 (35.0%) | 7,581 (65.0%) |
| Legal Services & Support | 3,248 (46.3%) | 3,768 (53.7%) |
| Education Instruction & Library | 12,757 (27.7%) | 33,241 (72.3%) |
| Arts, Media & Entertainment | 9,034 (57.8%) | 6,586 (42.2%) |
| Health Diagnosing & Treating | 12,402 (32.0%) | 26,319 (68.0%) |
| Health Technologists | 8,893 (32.7%) | 18,286 (67.3%) |
| Total (Category) | 117,574 (46.3%) | 136,663 (53.7%) |
| Total (Overall) | 345,520 (51.2%) | 329,551 (48.8%) |
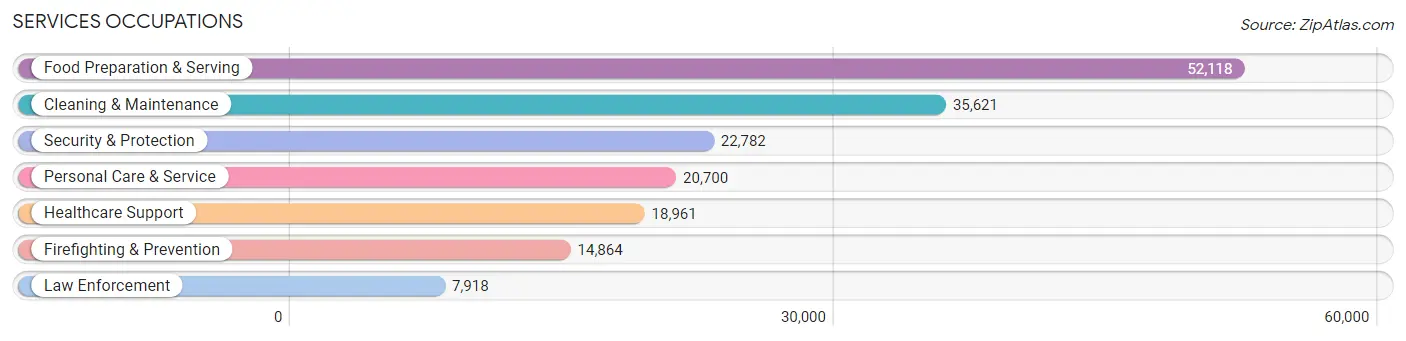
Services Occupations
The most common Services occupations in Hawaii are Food Preparation & Serving (52,118 | 7.7%), Cleaning & Maintenance (35,621 | 5.3%), Security & Protection (22,782 | 3.4%), Personal Care & Service (20,700 | 3.1%), and Healthcare Support (18,961 | 2.8%).
Services Occupations by Sex
Within the Services occupations in Hawaii, the most male-oriented occupations are Law Enforcement (83.7%), Security & Protection (83.3%), and Firefighting & Prevention (83.1%), while the most female-oriented occupations are Healthcare Support (86.6%), Personal Care & Service (64.1%), and Food Preparation & Serving (48.6%).
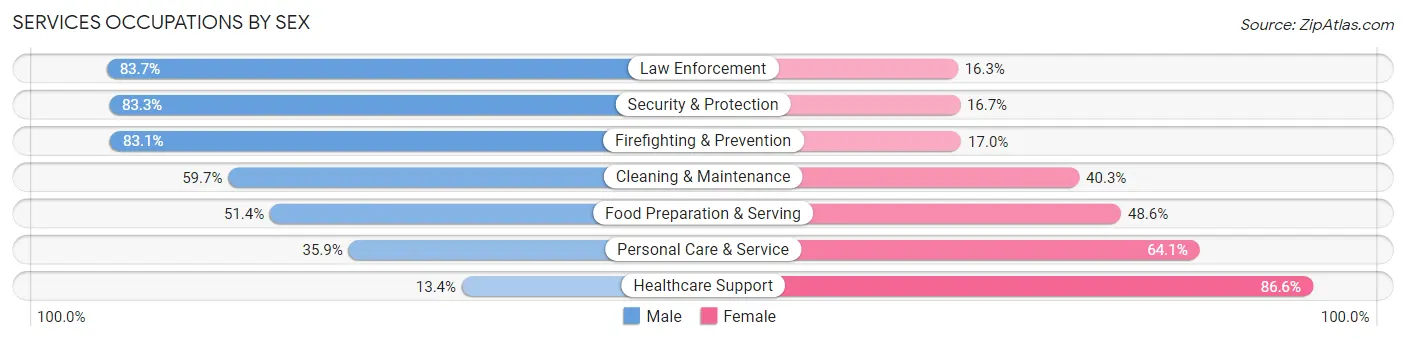
| Occupation | Male | Female |
| Healthcare Support | 2,543 (13.4%) | 16,418 (86.6%) |
| Security & Protection | 18,975 (83.3%) | 3,807 (16.7%) |
| Firefighting & Prevention | 12,345 (83.1%) | 2,519 (17.0%) |
| Law Enforcement | 6,630 (83.7%) | 1,288 (16.3%) |
| Food Preparation & Serving | 26,782 (51.4%) | 25,336 (48.6%) |
| Cleaning & Maintenance | 21,257 (59.7%) | 14,364 (40.3%) |
| Personal Care & Service | 7,423 (35.9%) | 13,277 (64.1%) |
| Total (Category) | 76,980 (51.3%) | 73,202 (48.7%) |
| Total (Overall) | 345,520 (51.2%) | 329,551 (48.8%) |
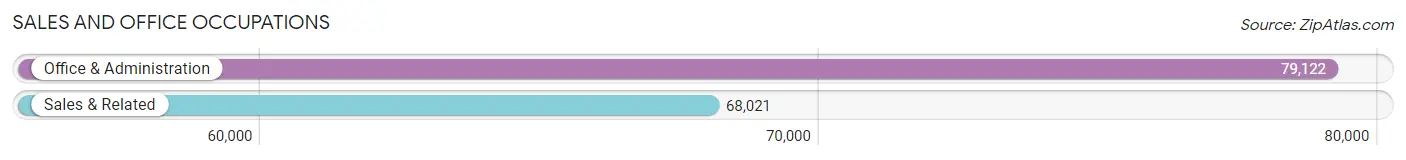
Sales and Office Occupations
The most common Sales and Office occupations in Hawaii are Office & Administration (79,122 | 11.7%), and Sales & Related (68,021 | 10.1%).
Sales and Office Occupations by Sex
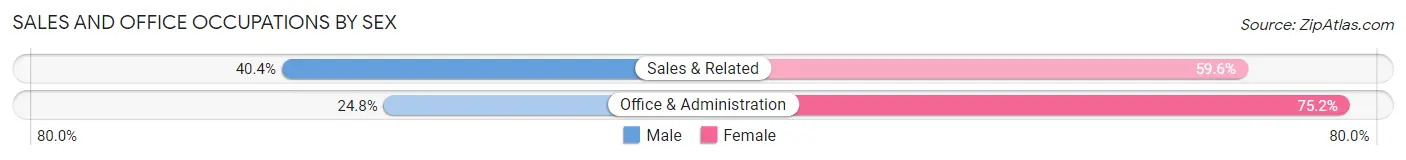
| Occupation | Male | Female |
| Sales & Related | 27,509 (40.4%) | 40,512 (59.6%) |
| Office & Administration | 19,606 (24.8%) | 59,516 (75.2%) |
| Total (Category) | 47,115 (32.0%) | 100,028 (68.0%) |
| Total (Overall) | 345,520 (51.2%) | 329,551 (48.8%) |
Natural Resources, Construction and Maintenance Occupations
The most common Natural Resources, Construction and Maintenance occupations in Hawaii are Construction & Extraction (35,825 | 5.3%), Installation, Maintenance & Repair (21,063 | 3.1%), and Farming, Fishing & Forestry (4,567 | 0.7%).

Natural Resources, Construction and Maintenance Occupations by Sex
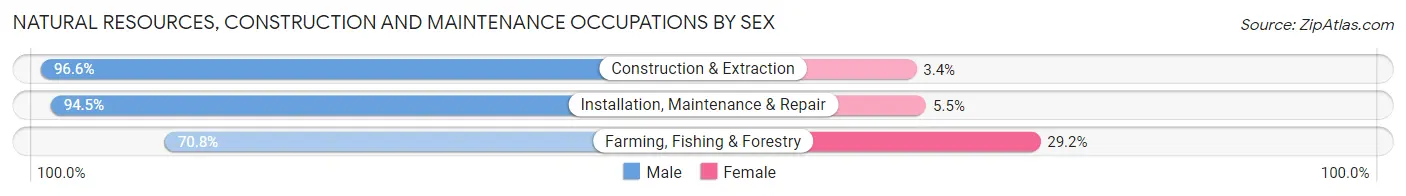
| Occupation | Male | Female |
| Farming, Fishing & Forestry | 3,233 (70.8%) | 1,334 (29.2%) |
| Construction & Extraction | 34,600 (96.6%) | 1,225 (3.4%) |
| Installation, Maintenance & Repair | 19,914 (94.5%) | 1,149 (5.5%) |
| Total (Category) | 57,747 (94.0%) | 3,708 (6.0%) |
| Total (Overall) | 345,520 (51.2%) | 329,551 (48.8%) |
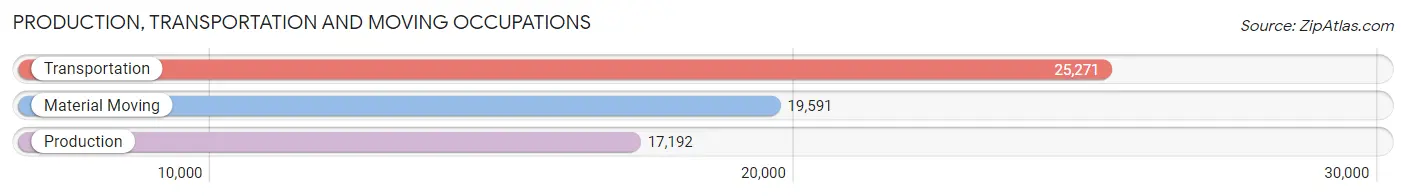
Production, Transportation and Moving Occupations
The most common Production, Transportation and Moving occupations in Hawaii are Transportation (25,271 | 3.7%), Material Moving (19,591 | 2.9%), and Production (17,192 | 2.5%).
Production, Transportation and Moving Occupations by Sex
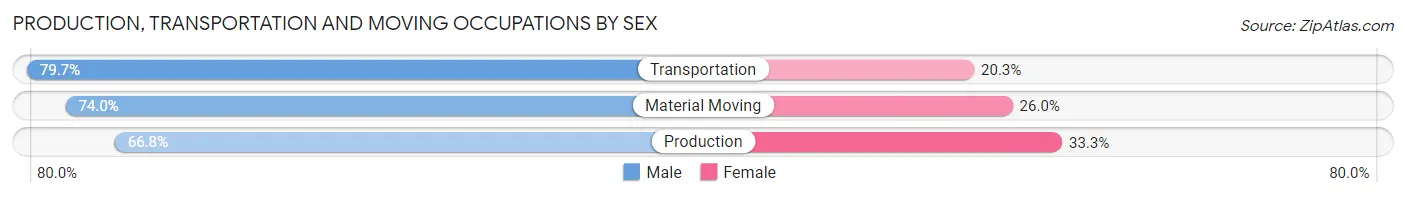
| Occupation | Male | Female |
| Production | 11,475 (66.7%) | 5,717 (33.3%) |
| Transportation | 20,132 (79.7%) | 5,139 (20.3%) |
| Material Moving | 14,497 (74.0%) | 5,094 (26.0%) |
| Total (Category) | 46,104 (74.3%) | 15,950 (25.7%) |
| Total (Overall) | 345,520 (51.2%) | 329,551 (48.8%) |
Employment Industries by Sex in Hawaii
Employment Industries in Hawaii
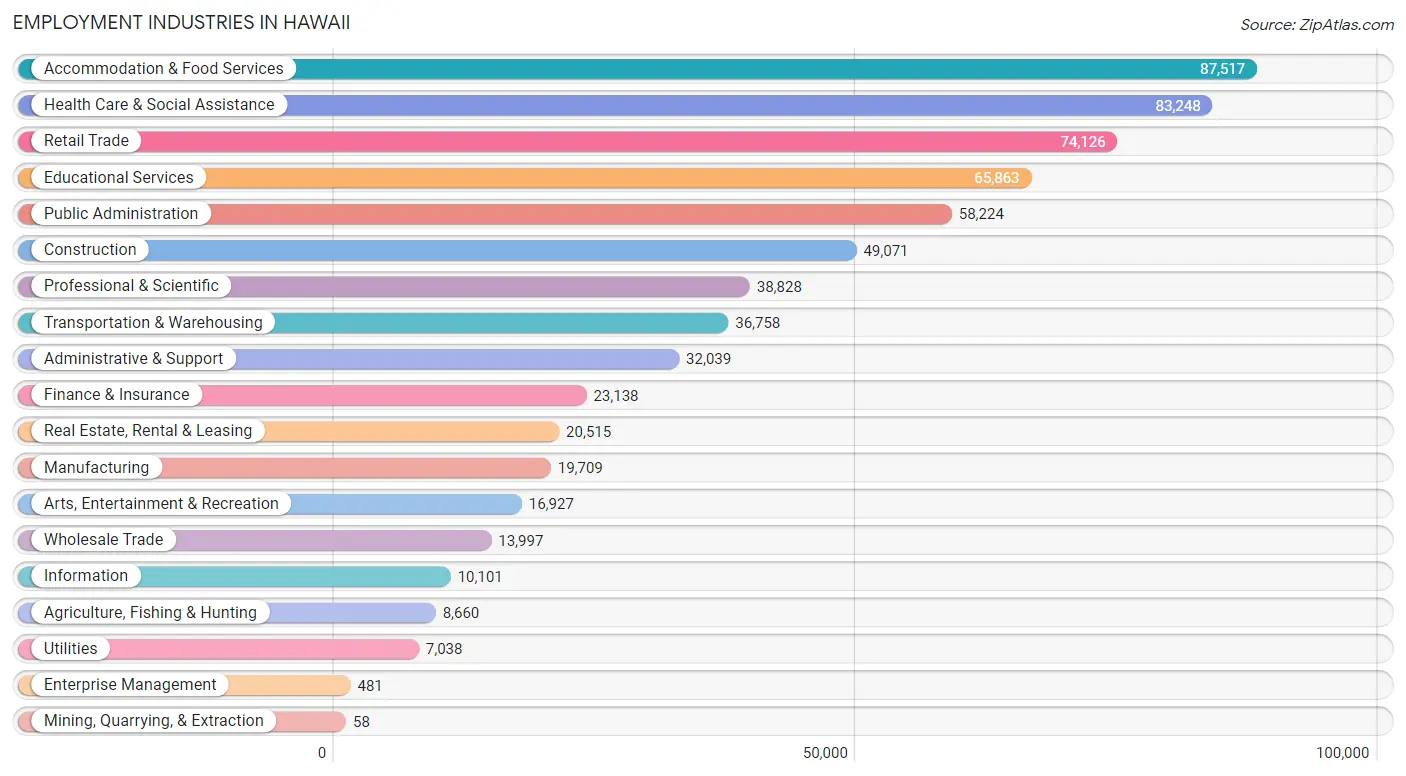
The major employment industries in Hawaii include Accommodation & Food Services (87,517 | 13.0%), Health Care & Social Assistance (83,248 | 12.3%), Retail Trade (74,126 | 11.0%), Educational Services (65,863 | 9.8%), and Public Administration (58,224 | 8.6%).
Employment Industries by Sex in Hawaii
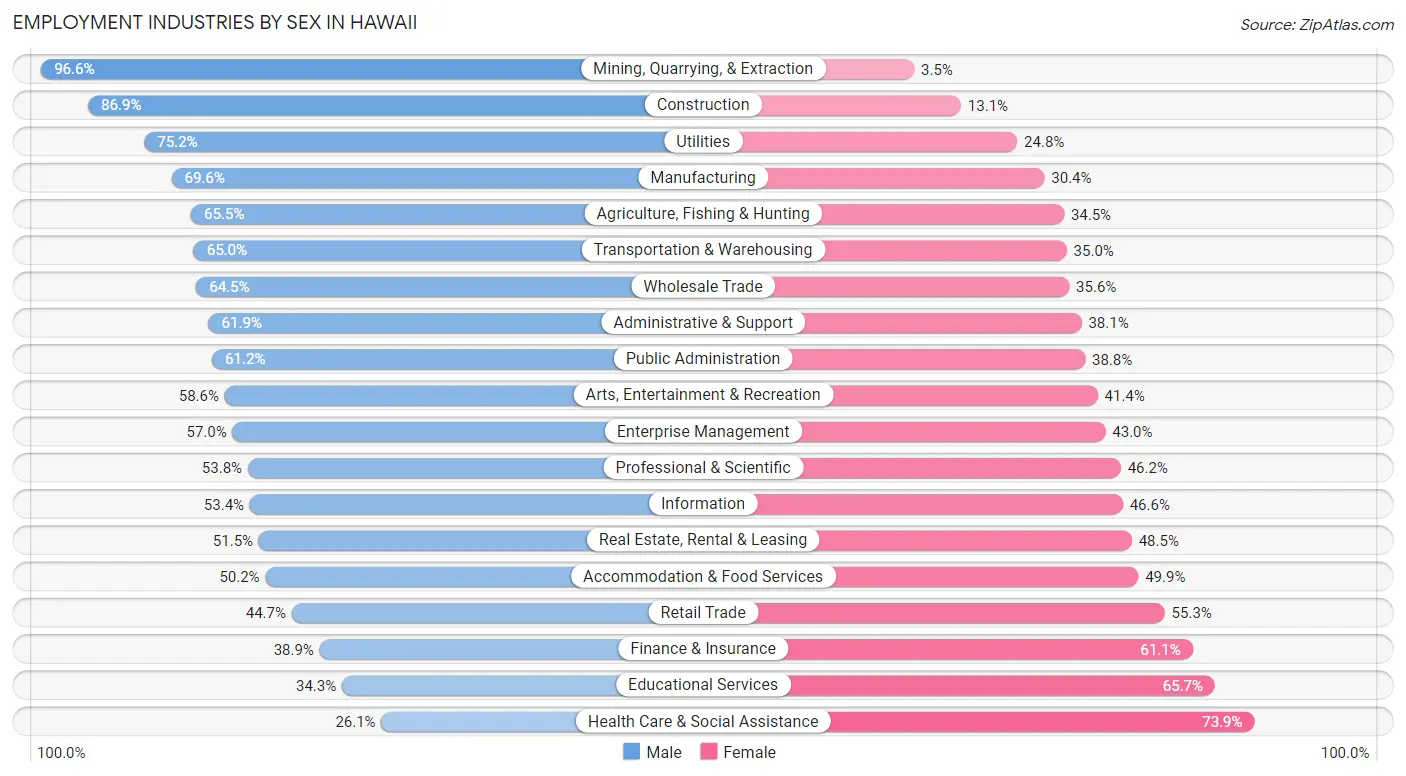
The Hawaii industries that see more men than women are Mining, Quarrying, & Extraction (96.6%), Construction (86.9%), and Utilities (75.2%), whereas the industries that tend to have a higher number of women are Health Care & Social Assistance (73.9%), Educational Services (65.7%), and Finance & Insurance (61.1%).
| Industry | Male | Female |
| Agriculture, Fishing & Hunting | 5,675 (65.5%) | 2,985 (34.5%) |
| Mining, Quarrying, & Extraction | 56 (96.6%) | 2 (3.5%) |
| Construction | 42,624 (86.9%) | 6,447 (13.1%) |
| Manufacturing | 13,713 (69.6%) | 5,996 (30.4%) |
| Wholesale Trade | 9,021 (64.4%) | 4,976 (35.5%) |
| Retail Trade | 33,128 (44.7%) | 40,998 (55.3%) |
| Transportation & Warehousing | 23,880 (65.0%) | 12,878 (35.0%) |
| Utilities | 5,294 (75.2%) | 1,744 (24.8%) |
| Information | 5,390 (53.4%) | 4,711 (46.6%) |
| Finance & Insurance | 9,005 (38.9%) | 14,133 (61.1%) |
| Real Estate, Rental & Leasing | 10,565 (51.5%) | 9,950 (48.5%) |
| Professional & Scientific | 20,883 (53.8%) | 17,945 (46.2%) |
| Enterprise Management | 274 (57.0%) | 207 (43.0%) |
| Administrative & Support | 19,833 (61.9%) | 12,206 (38.1%) |
| Educational Services | 22,591 (34.3%) | 43,272 (65.7%) |
| Health Care & Social Assistance | 21,759 (26.1%) | 61,489 (73.9%) |
| Arts, Entertainment & Recreation | 9,912 (58.6%) | 7,015 (41.4%) |
| Accommodation & Food Services | 43,892 (50.1%) | 43,625 (49.8%) |
| Public Administration | 35,614 (61.2%) | 22,610 (38.8%) |
| Total | 345,520 (51.2%) | 329,551 (48.8%) |
Education in Hawaii
School Enrollment in Hawaii
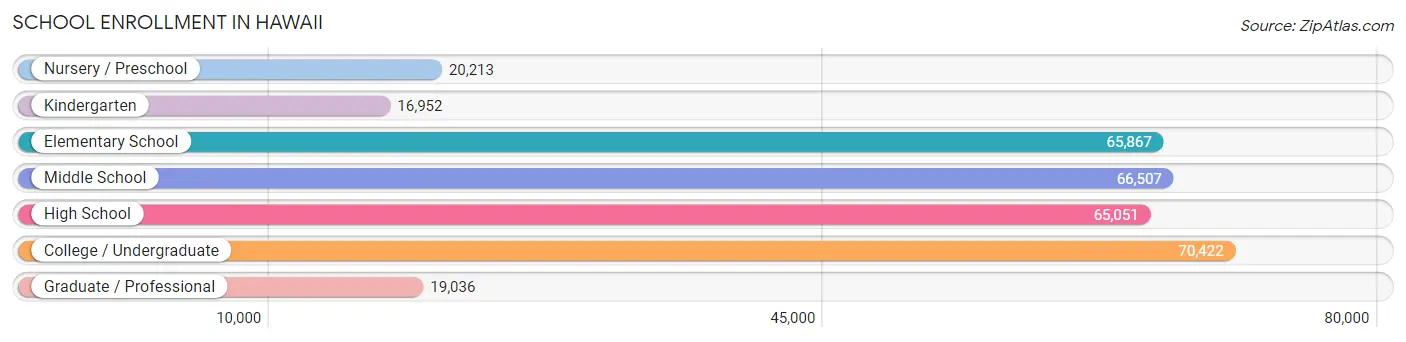
The most common levels of schooling among the 324,048 students in Hawaii are college / undergraduate (70,422 | 21.7%), middle school (66,507 | 20.5%), and elementary school (65,867 | 20.3%).
| School Level | # Students | % Students |
| Nursery / Preschool | 20,213 | 6.2% |
| Kindergarten | 16,952 | 5.2% |
| Elementary School | 65,867 | 20.3% |
| Middle School | 66,507 | 20.5% |
| High School | 65,051 | 20.1% |
| College / Undergraduate | 70,422 | 21.7% |
| Graduate / Professional | 19,036 | 5.9% |
| Total | 324,048 | 100.0% |
School Enrollment by Age by Funding Source in Hawaii
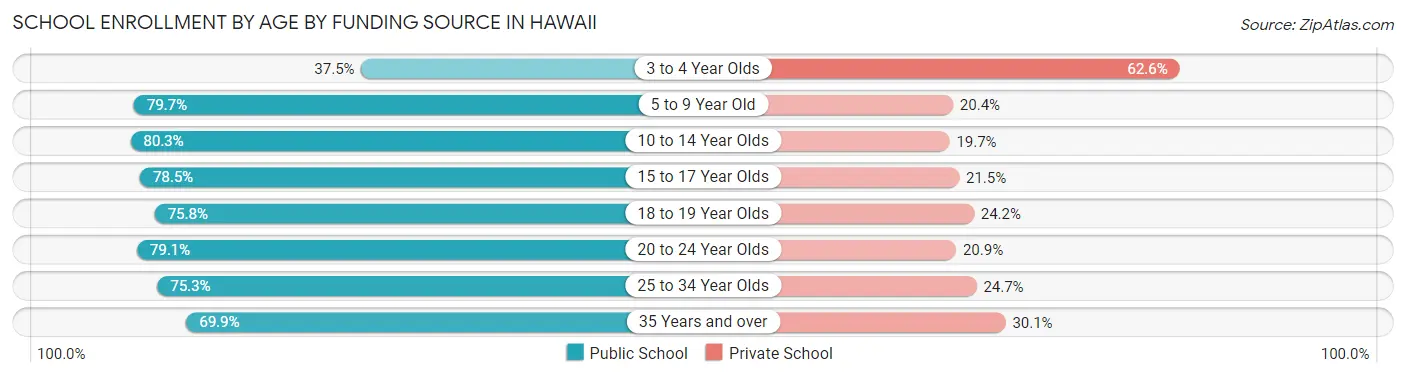
Out of a total of 324,048 students who are enrolled in schools in Hawaii, 77,123 (23.8%) attend a private institution, while the remaining 246,925 (76.2%) are enrolled in public schools. The age group of 3 to 4 year olds has the highest likelihood of being enrolled in private schools, with 10,012 (62.5% in the age bracket) enrolled. Conversely, the age group of 10 to 14 year olds has the lowest likelihood of being enrolled in a private school, with 67,794 (80.3% in the age bracket) attending a public institution.
| Age Bracket | Public School | Private School |
| 3 to 4 Year Olds | 5,994 (37.4%) | 10,012 (62.5%) |
| 5 to 9 Year Old | 63,503 (79.6%) | 16,229 (20.3%) |
| 10 to 14 Year Olds | 67,794 (80.3%) | 16,628 (19.7%) |
| 15 to 17 Year Olds | 36,005 (78.5%) | 9,856 (21.5%) |
| 18 to 19 Year Olds | 14,534 (75.8%) | 4,651 (24.2%) |
| 20 to 24 Year Olds | 23,654 (79.1%) | 6,256 (20.9%) |
| 25 to 34 Year Olds | 18,723 (75.3%) | 6,151 (24.7%) |
| 35 Years and over | 16,809 (69.9%) | 7,249 (30.1%) |
| Total | 246,925 (76.2%) | 77,123 (23.8%) |
Educational Attainment by Field of Study in Hawaii
Business (70,142 | 18.5%), social sciences (40,699 | 10.7%), education (39,971 | 10.5%), science & technology (37,564 | 9.9%), and bio, nature & agricultural (27,264 | 7.2%) are the most common fields of study among 379,881 individuals in Hawaii who have obtained a bachelor's degree or higher.
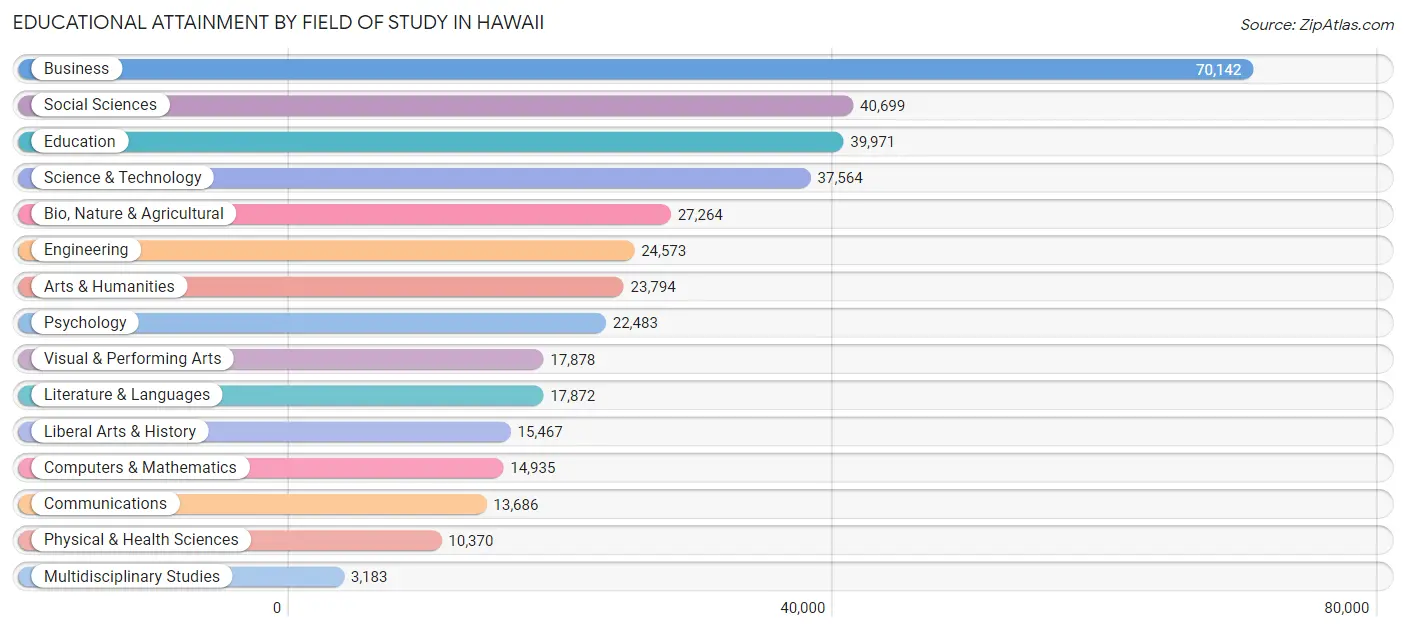
| Field of Study | # Graduates | % Graduates |
| Computers & Mathematics | 14,935 | 3.9% |
| Bio, Nature & Agricultural | 27,264 | 7.2% |
| Physical & Health Sciences | 10,370 | 2.7% |
| Psychology | 22,483 | 5.9% |
| Social Sciences | 40,699 | 10.7% |
| Engineering | 24,573 | 6.5% |
| Multidisciplinary Studies | 3,183 | 0.8% |
| Science & Technology | 37,564 | 9.9% |
| Business | 70,142 | 18.5% |
| Education | 39,971 | 10.5% |
| Literature & Languages | 17,872 | 4.7% |
| Liberal Arts & History | 15,467 | 4.1% |
| Visual & Performing Arts | 17,878 | 4.7% |
| Communications | 13,686 | 3.6% |
| Arts & Humanities | 23,794 | 6.3% |
| Total | 379,881 | 100.0% |
Transportation & Commute in Hawaii
Vehicle Availability by Sex in Hawaii
The most prevalent vehicle ownership categories in Hawaii are males with 2 vehicles (128,828, accounting for 35.4%) and females with 2 vehicles (110,256, making up 40.1%).
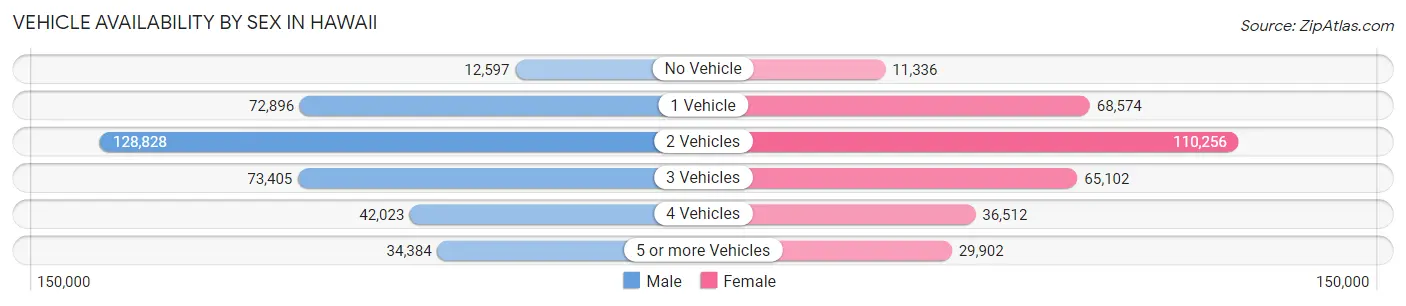
| Vehicles Available | Male | Female |
| No Vehicle | 12,597 (3.5%) | 11,336 (3.5%) |
| 1 Vehicle | 72,896 (20.0%) | 68,574 (21.3%) |
| 2 Vehicles | 128,828 (35.4%) | 110,256 (34.3%) |
| 3 Vehicles | 73,405 (20.2%) | 65,102 (20.2%) |
| 4 Vehicles | 42,023 (11.5%) | 36,512 (11.4%) |
| 5 or more Vehicles | 34,384 (9.4%) | 29,902 (9.3%) |
| Total | 364,133 (100.0%) | 321,682 (100.0%) |
Commute Time in Hawaii
The most frequently occuring commute durations in Hawaii are 30 to 34 minutes (112,555 commuters, 17.4%), 15 to 19 minutes (97,261 commuters, 15.0%), and 20 to 24 minutes (89,967 commuters, 13.9%).

| Commute Time | # Commuters | % Commuters |
| Less than 5 Minutes | 15,096 | 2.3% |
| 5 to 9 Minutes | 60,219 | 9.3% |
| 10 to 14 Minutes | 85,530 | 13.2% |
| 15 to 19 Minutes | 97,261 | 15.0% |
| 20 to 24 Minutes | 89,967 | 13.9% |
| 25 to 29 Minutes | 34,396 | 5.3% |
| 30 to 34 Minutes | 112,555 | 17.4% |
| 35 to 39 Minutes | 16,100 | 2.5% |
| 40 to 44 Minutes | 25,286 | 3.9% |
| 45 to 59 Minutes | 55,984 | 8.6% |
| 60 to 89 Minutes | 39,932 | 6.2% |
| 90 or more Minutes | 15,801 | 2.4% |
Commute Time by Sex in Hawaii
The most common commute times in Hawaii are 30 to 34 minutes (63,975 commuters, 18.1%) for males and 30 to 34 minutes (48,580 commuters, 16.5%) for females.
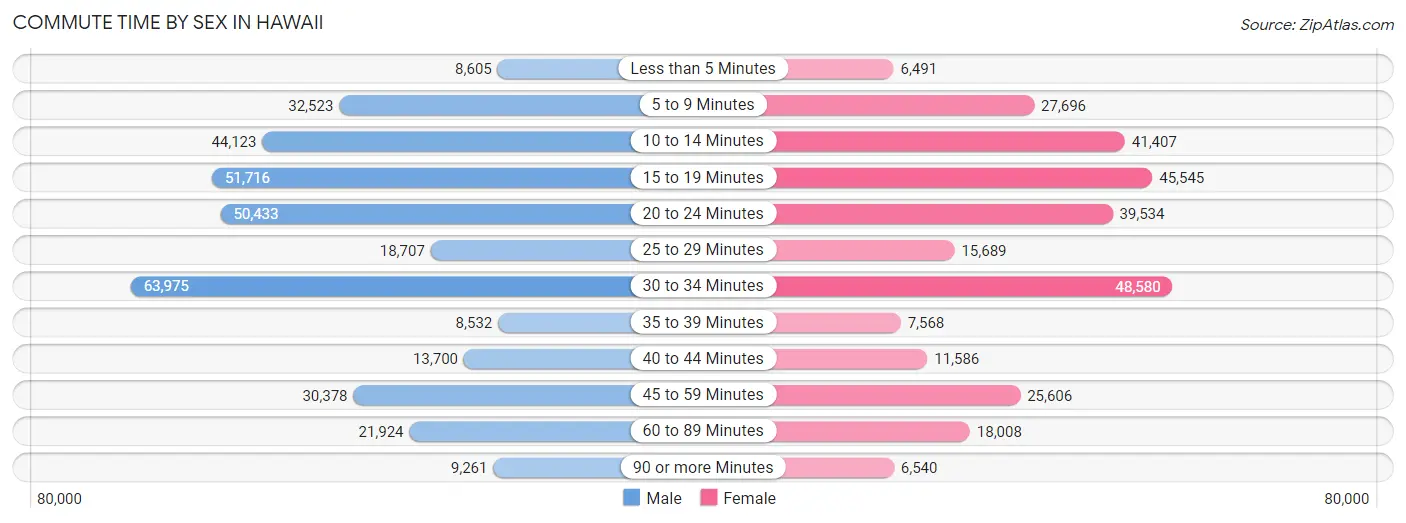
| Commute Time | Male | Female |
| Less than 5 Minutes | 8,605 (2.4%) | 6,491 (2.2%) |
| 5 to 9 Minutes | 32,523 (9.2%) | 27,696 (9.4%) |
| 10 to 14 Minutes | 44,123 (12.5%) | 41,407 (14.1%) |
| 15 to 19 Minutes | 51,716 (14.6%) | 45,545 (15.5%) |
| 20 to 24 Minutes | 50,433 (14.2%) | 39,534 (13.4%) |
| 25 to 29 Minutes | 18,707 (5.3%) | 15,689 (5.3%) |
| 30 to 34 Minutes | 63,975 (18.1%) | 48,580 (16.5%) |
| 35 to 39 Minutes | 8,532 (2.4%) | 7,568 (2.6%) |
| 40 to 44 Minutes | 13,700 (3.9%) | 11,586 (3.9%) |
| 45 to 59 Minutes | 30,378 (8.6%) | 25,606 (8.7%) |
| 60 to 89 Minutes | 21,924 (6.2%) | 18,008 (6.1%) |
| 90 or more Minutes | 9,261 (2.6%) | 6,540 (2.2%) |
Time of Departure to Work by Sex in Hawaii
The most frequent times of departure to work in Hawaii are 7:00 AM to 7:29 AM (46,195, 13.1%) for males and 7:00 AM to 7:29 AM (47,077, 16.0%) for females.
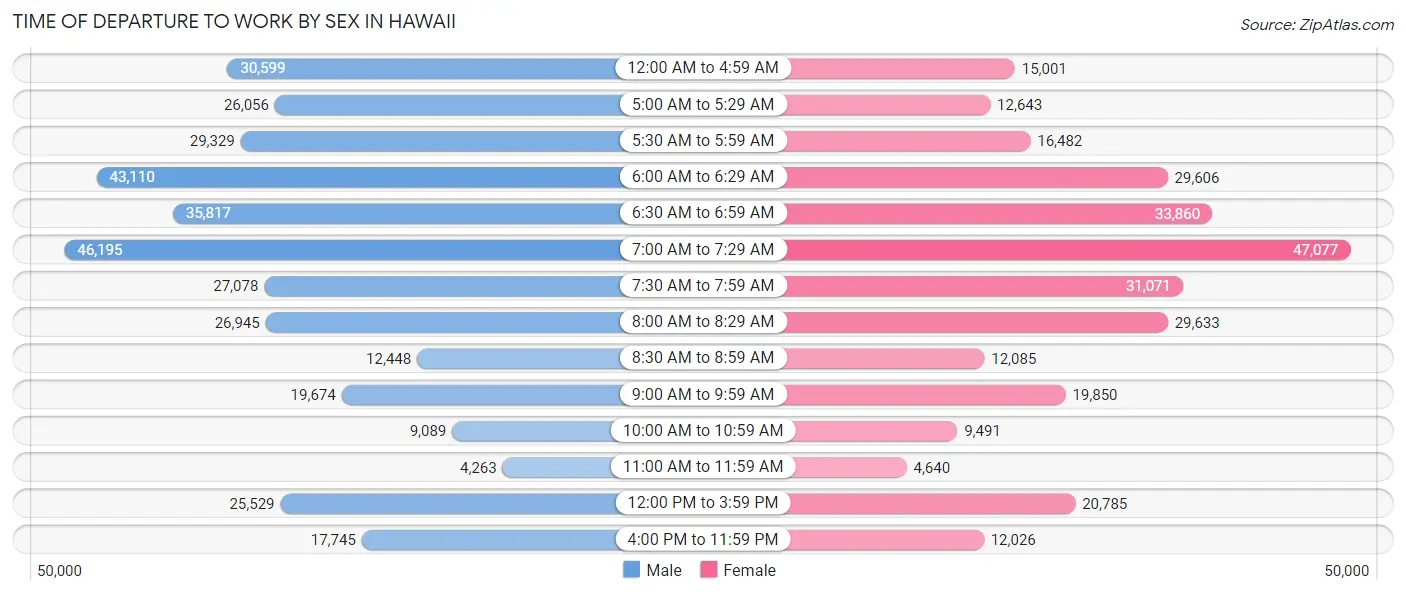
| Time of Departure | Male | Female |
| 12:00 AM to 4:59 AM | 30,599 (8.6%) | 15,001 (5.1%) |
| 5:00 AM to 5:29 AM | 26,056 (7.4%) | 12,643 (4.3%) |
| 5:30 AM to 5:59 AM | 29,329 (8.3%) | 16,482 (5.6%) |
| 6:00 AM to 6:29 AM | 43,110 (12.2%) | 29,606 (10.1%) |
| 6:30 AM to 6:59 AM | 35,817 (10.1%) | 33,860 (11.5%) |
| 7:00 AM to 7:29 AM | 46,195 (13.1%) | 47,077 (16.0%) |
| 7:30 AM to 7:59 AM | 27,078 (7.6%) | 31,071 (10.6%) |
| 8:00 AM to 8:29 AM | 26,945 (7.6%) | 29,633 (10.1%) |
| 8:30 AM to 8:59 AM | 12,448 (3.5%) | 12,085 (4.1%) |
| 9:00 AM to 9:59 AM | 19,674 (5.6%) | 19,850 (6.8%) |
| 10:00 AM to 10:59 AM | 9,089 (2.6%) | 9,491 (3.2%) |
| 11:00 AM to 11:59 AM | 4,263 (1.2%) | 4,640 (1.6%) |
| 12:00 PM to 3:59 PM | 25,529 (7.2%) | 20,785 (7.1%) |
| 4:00 PM to 11:59 PM | 17,745 (5.0%) | 12,026 (4.1%) |
| Total | 353,877 (100.0%) | 294,250 (100.0%) |
Housing Occupancy in Hawaii
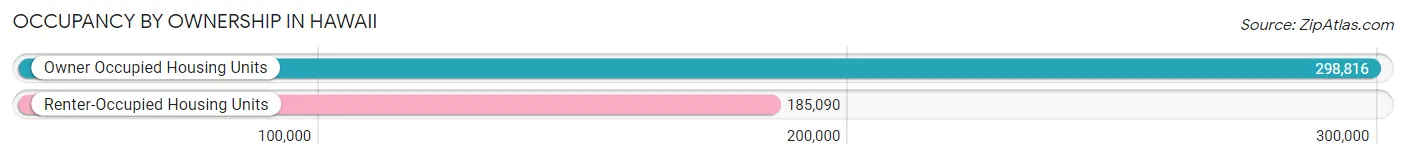
Occupancy by Ownership in Hawaii
Of the total 483,906 dwellings in Hawaii, owner-occupied units account for 298,816 (61.8%), while renter-occupied units make up 185,090 (38.3%).
| Occupancy | # Housing Units | % Housing Units |
| Owner Occupied Housing Units | 298,816 | 61.8% |
| Renter-Occupied Housing Units | 185,090 | 38.3% |
| Total Occupied Housing Units | 483,906 | 100.0% |
Occupancy by Household Size in Hawaii

| Household Size | # Housing Units | % Housing Units |
| 1-Person Household | 118,744 | 24.5% |
| 2-Person Household | 155,750 | 32.2% |
| 3-Person Household | 77,982 | 16.1% |
| 4+ Person Household | 131,430 | 27.2% |
| Total Housing Units | 483,906 | 100.0% |
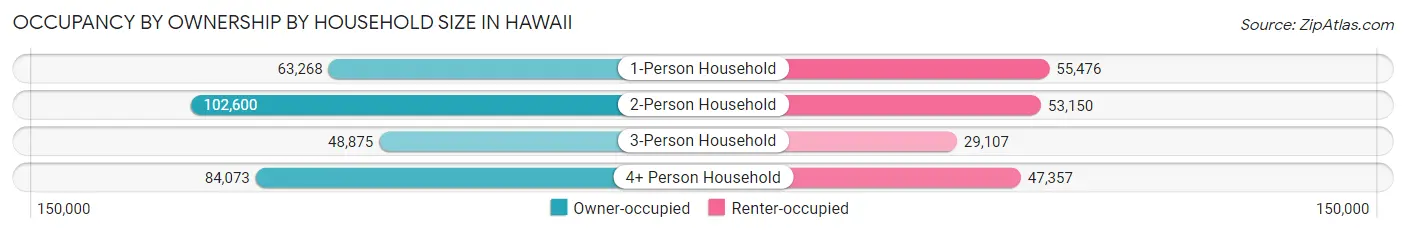
Occupancy by Ownership by Household Size in Hawaii
| Household Size | Owner-occupied | Renter-occupied |
| 1-Person Household | 63,268 (53.3%) | 55,476 (46.7%) |
| 2-Person Household | 102,600 (65.9%) | 53,150 (34.1%) |
| 3-Person Household | 48,875 (62.7%) | 29,107 (37.3%) |
| 4+ Person Household | 84,073 (64.0%) | 47,357 (36.0%) |
| Total Housing Units | 298,816 (61.8%) | 185,090 (38.3%) |
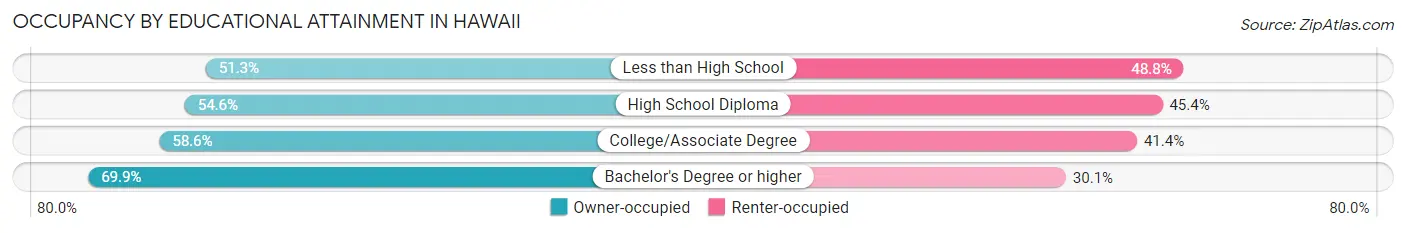
Occupancy by Educational Attainment in Hawaii
| Household Size | Owner-occupied | Renter-occupied |
| Less than High School | 13,641 (51.2%) | 12,977 (48.7%) |
| High School Diploma | 58,093 (54.6%) | 48,316 (45.4%) |
| College/Associate Degree | 94,652 (58.6%) | 66,801 (41.4%) |
| Bachelor's Degree or higher | 132,430 (69.9%) | 56,996 (30.1%) |
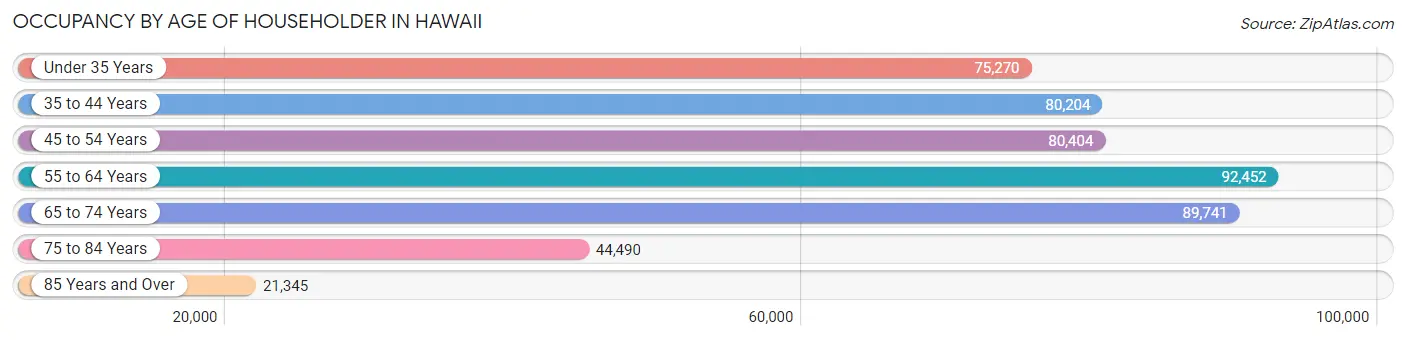
Occupancy by Age of Householder in Hawaii
| Age Bracket | # Households | % Households |
| Under 35 Years | 75,270 | 15.5% |
| 35 to 44 Years | 80,204 | 16.6% |
| 45 to 54 Years | 80,404 | 16.6% |
| 55 to 64 Years | 92,452 | 19.1% |
| 65 to 74 Years | 89,741 | 18.5% |
| 75 to 84 Years | 44,490 | 9.2% |
| 85 Years and Over | 21,345 | 4.4% |
| Total | 483,906 | 100.0% |
Housing Finances in Hawaii
Median Income by Occupancy in Hawaii
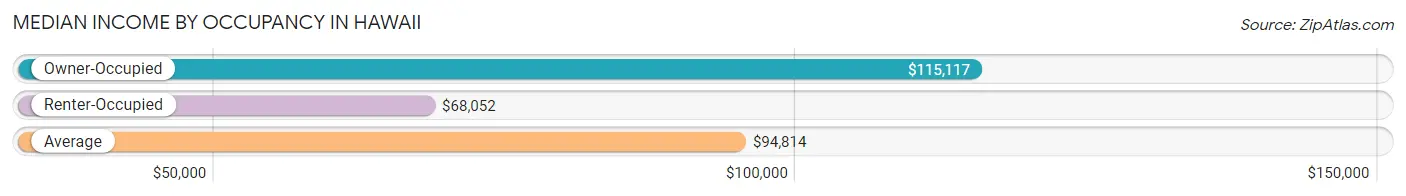
| Occupancy Type | # Households | Median Income |
| Owner-Occupied | 298,816 (61.8%) | $115,117 |
| Renter-Occupied | 185,090 (38.3%) | $68,052 |
| Average | 483,906 (100.0%) | $94,814 |
Occupancy by Householder Income Bracket in Hawaii

| Income Bracket | Owner-occupied | Renter-occupied |
| Less than $5,000 | 5,765 (1.9%) | 7,238 (3.9%) |
| $5,000 to $9,999 | 3,016 (1.0%) | 4,527 (2.5%) |
| $10,000 to $14,999 | 3,830 (1.3%) | 8,773 (4.7%) |
| $15,000 to $19,999 | 4,324 (1.5%) | 6,100 (3.3%) |
| $20,000 to $24,999 | 5,985 (2.0%) | 7,274 (3.9%) |
| $25,000 to $34,999 | 11,093 (3.7%) | 13,981 (7.5%) |
| $35,000 to $49,999 | 19,481 (6.5%) | 21,699 (11.7%) |
| $50,000 to $74,999 | 36,298 (12.1%) | 31,844 (17.2%) |
| $75,000 to $99,999 | 37,099 (12.4%) | 25,694 (13.9%) |
| $100,000 to $149,999 | 64,360 (21.5%) | 31,887 (17.2%) |
| $150,000 or more | 107,565 (36.0%) | 26,073 (14.1%) |
| Total | 298,816 (100.0%) | 185,090 (100.0%) |
Monthly Housing Cost Tiers in Hawaii
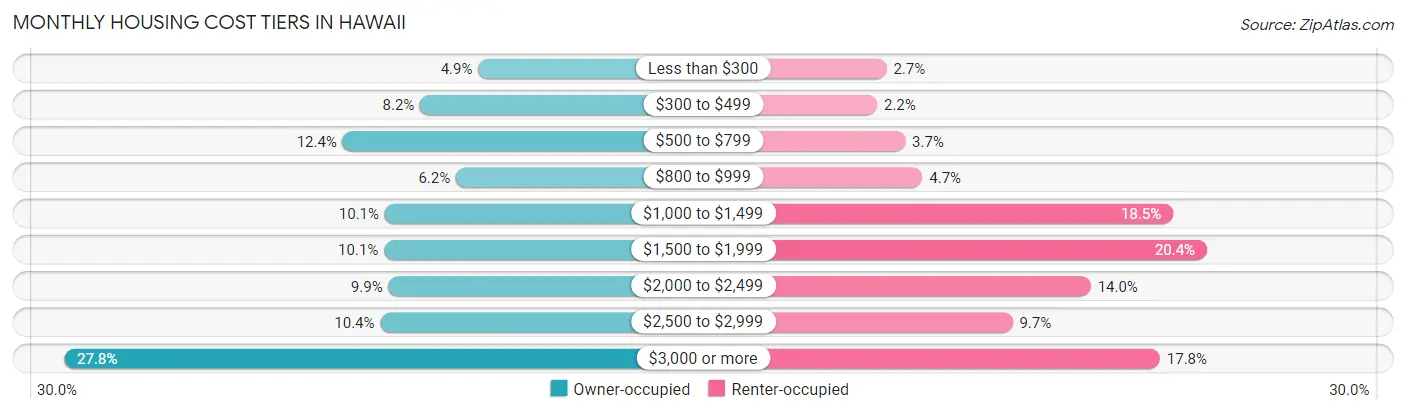
| Monthly Cost | Owner-occupied | Renter-occupied |
| Less than $300 | 14,752 (4.9%) | 5,020 (2.7%) |
| $300 to $499 | 24,339 (8.2%) | 4,054 (2.2%) |
| $500 to $799 | 37,155 (12.4%) | 6,923 (3.7%) |
| $800 to $999 | 18,446 (6.2%) | 8,672 (4.7%) |
| $1,000 to $1,499 | 30,172 (10.1%) | 34,324 (18.5%) |
| $1,500 to $1,999 | 30,296 (10.1%) | 37,783 (20.4%) |
| $2,000 to $2,499 | 29,597 (9.9%) | 25,902 (14.0%) |
| $2,500 to $2,999 | 30,940 (10.3%) | 17,907 (9.7%) |
| $3,000 or more | 83,119 (27.8%) | 32,969 (17.8%) |
| Total | 298,816 (100.0%) | 185,090 (100.0%) |
Physical Housing Characteristics in Hawaii
Housing Structures in Hawaii
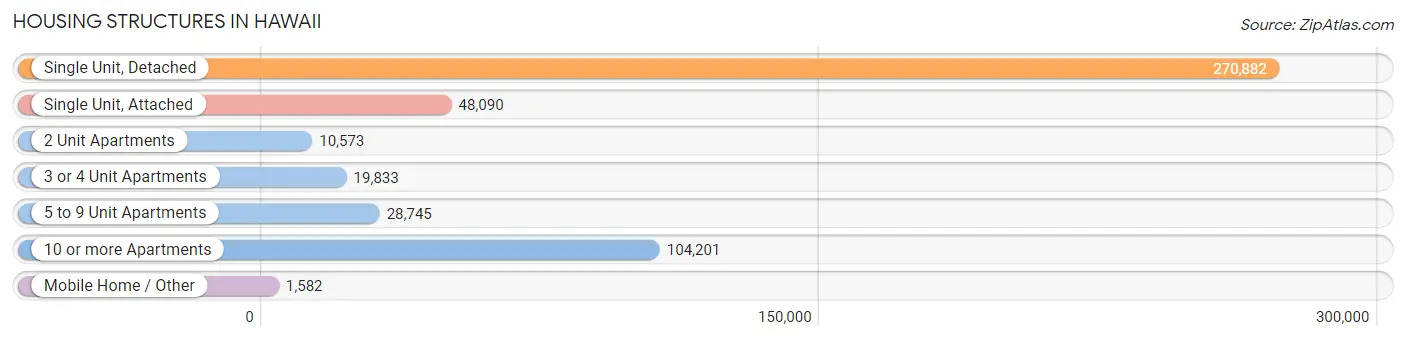
| Structure Type | # Housing Units | % Housing Units |
| Single Unit, Detached | 270,882 | 56.0% |
| Single Unit, Attached | 48,090 | 9.9% |
| 2 Unit Apartments | 10,573 | 2.2% |
| 3 or 4 Unit Apartments | 19,833 | 4.1% |
| 5 to 9 Unit Apartments | 28,745 | 5.9% |
| 10 or more Apartments | 104,201 | 21.5% |
| Mobile Home / Other | 1,582 | 0.3% |
| Total | 483,906 | 100.0% |
Housing Structures by Occupancy in Hawaii

| Structure Type | Owner-occupied | Renter-occupied |
| Single Unit, Detached | 214,062 (79.0%) | 56,820 (21.0%) |
| Single Unit, Attached | 21,785 (45.3%) | 26,305 (54.7%) |
| 2 Unit Apartments | 2,775 (26.3%) | 7,798 (73.8%) |
| 3 or 4 Unit Apartments | 6,456 (32.6%) | 13,377 (67.4%) |
| 5 to 9 Unit Apartments | 10,883 (37.9%) | 17,862 (62.1%) |
| 10 or more Apartments | 42,053 (40.4%) | 62,148 (59.6%) |
| Mobile Home / Other | 802 (50.7%) | 780 (49.3%) |
| Total | 298,816 (61.8%) | 185,090 (38.3%) |
Housing Structures by Number of Rooms in Hawaii
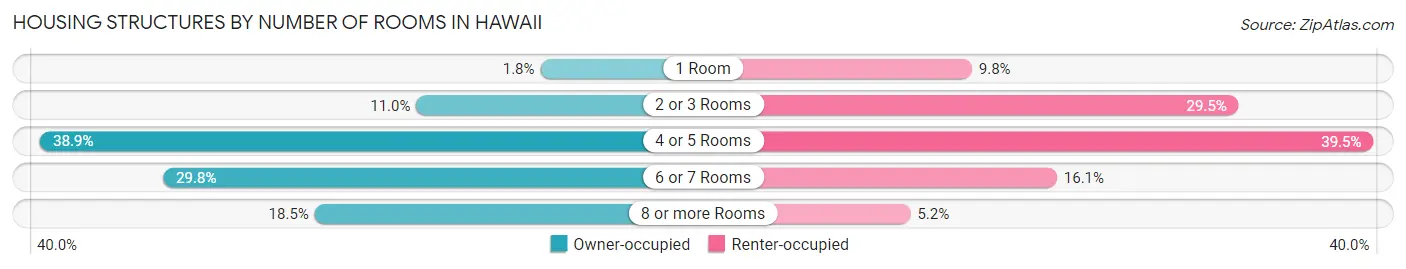
| Number of Rooms | Owner-occupied | Renter-occupied |
| 1 Room | 5,494 (1.8%) | 18,069 (9.8%) |
| 2 or 3 Rooms | 32,929 (11.0%) | 54,595 (29.5%) |
| 4 or 5 Rooms | 116,080 (38.9%) | 73,045 (39.5%) |
| 6 or 7 Rooms | 88,916 (29.8%) | 29,714 (16.1%) |
| 8 or more Rooms | 55,397 (18.5%) | 9,667 (5.2%) |
| Total | 298,816 (100.0%) | 185,090 (100.0%) |
Housing Structure by Heating Type in Hawaii

| Heating Type | Owner-occupied | Renter-occupied |
| Utility Gas | 7,062 (2.4%) | 6,460 (3.5%) |
| Bottled, Tank, or LP Gas | 5,981 (2.0%) | 2,869 (1.5%) |
| Electricity | 111,848 (37.4%) | 75,298 (40.7%) |
| Fuel Oil or Kerosene | 138 (0.1%) | 44 (0.0%) |
| Coal or Coke | 83 (0.0%) | 31 (0.0%) |
| All other Fuels | 17,905 (6.0%) | 3,955 (2.1%) |
| No Fuel Used | 155,799 (52.1%) | 96,433 (52.1%) |
| Total | 298,816 (100.0%) | 185,090 (100.0%) |
Household Vehicle Usage in Hawaii
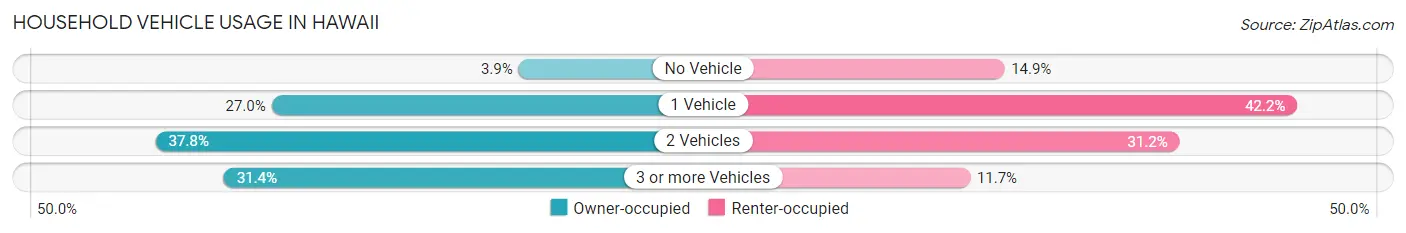
| Vehicles per Household | Owner-occupied | Renter-occupied |
| No Vehicle | 11,628 (3.9%) | 27,514 (14.9%) |
| 1 Vehicle | 80,517 (27.0%) | 78,148 (42.2%) |
| 2 Vehicles | 112,848 (37.8%) | 57,828 (31.2%) |
| 3 or more Vehicles | 93,823 (31.4%) | 21,600 (11.7%) |
| Total | 298,816 (100.0%) | 185,090 (100.0%) |
Real Estate & Mortgages in Hawaii
Real Estate and Mortgage Overview in Hawaii
| Characteristic | Without Mortgage | With Mortgage |
| Housing Units | 107,239 | 191,577 |
| Median Property Value | $745,700 | $773,600 |
| Median Household Income | $87,242 | $80,017 |
| Monthly Housing Costs | $630 | $82,432 |
| Real Estate Taxes | $2,008 | $10,618 |
Property Value by Mortgage Status in Hawaii
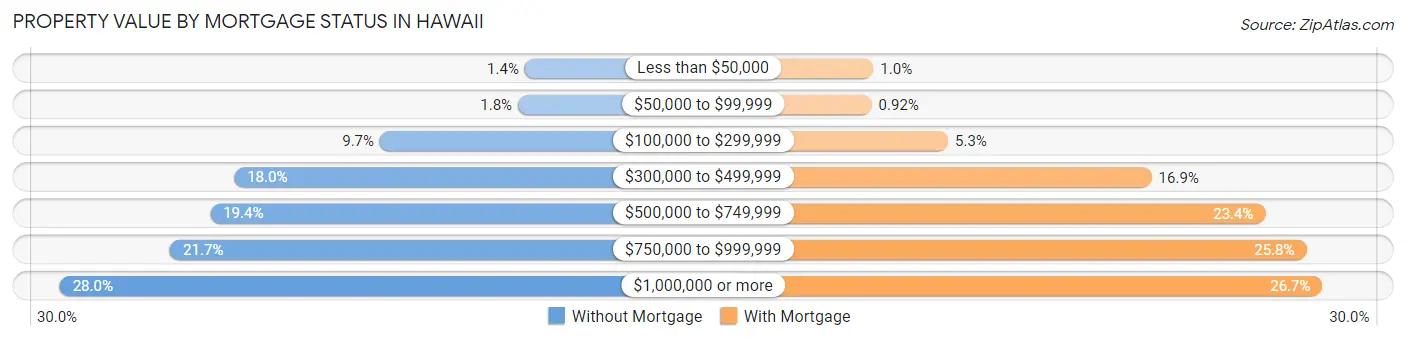
| Property Value | Without Mortgage | With Mortgage |
| Less than $50,000 | 1,520 (1.4%) | 1,948 (1.0%) |
| $50,000 to $99,999 | 1,938 (1.8%) | 1,763 (0.9%) |
| $100,000 to $299,999 | 10,403 (9.7%) | 10,141 (5.3%) |
| $300,000 to $499,999 | 19,320 (18.0%) | 32,413 (16.9%) |
| $500,000 to $749,999 | 20,797 (19.4%) | 44,857 (23.4%) |
| $750,000 to $999,999 | 23,247 (21.7%) | 49,356 (25.8%) |
| $1,000,000 or more | 30,014 (28.0%) | 51,099 (26.7%) |
| Total | 107,239 (100.0%) | 191,577 (100.0%) |
Household Income by Mortgage Status in Hawaii
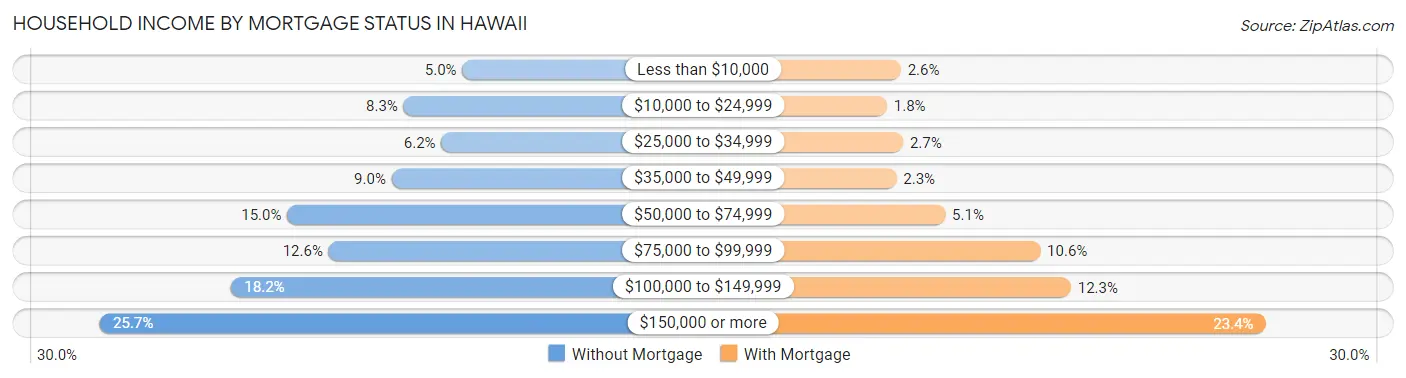
| Household Income | Without Mortgage | With Mortgage |
| Less than $10,000 | 5,345 (5.0%) | 4,938 (2.6%) |
| $10,000 to $24,999 | 8,941 (8.3%) | 3,436 (1.8%) |
| $25,000 to $34,999 | 6,623 (6.2%) | 5,198 (2.7%) |
| $35,000 to $49,999 | 9,675 (9.0%) | 4,470 (2.3%) |
| $50,000 to $74,999 | 16,080 (15.0%) | 9,806 (5.1%) |
| $75,000 to $99,999 | 13,536 (12.6%) | 20,218 (10.5%) |
| $100,000 to $149,999 | 19,491 (18.2%) | 23,563 (12.3%) |
| $150,000 or more | 27,548 (25.7%) | 44,869 (23.4%) |
| Total | 107,239 (100.0%) | 191,577 (100.0%) |
Property Value to Household Income Ratio in Hawaii
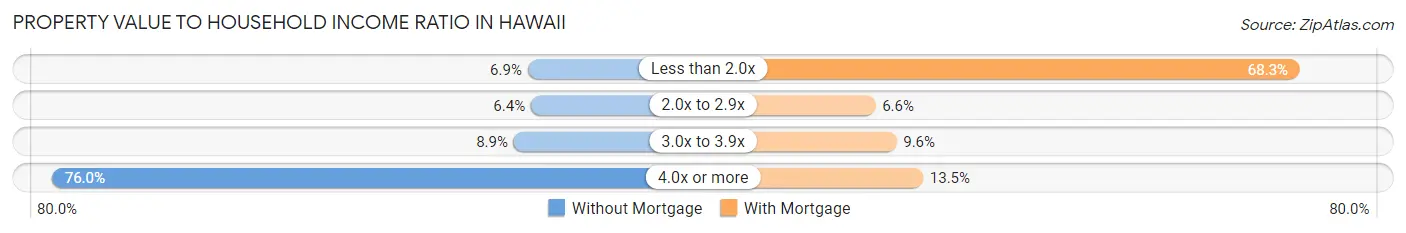
| Value-to-Income Ratio | Without Mortgage | With Mortgage |
| Less than 2.0x | 7,398 (6.9%) | 130,811 (68.3%) |
| 2.0x to 2.9x | 6,893 (6.4%) | 12,612 (6.6%) |
| 3.0x to 3.9x | 9,568 (8.9%) | 18,468 (9.6%) |
| 4.0x or more | 81,541 (76.0%) | 25,865 (13.5%) |
| Total | 107,239 (100.0%) | 191,577 (100.0%) |
Real Estate Taxes by Mortgage Status in Hawaii
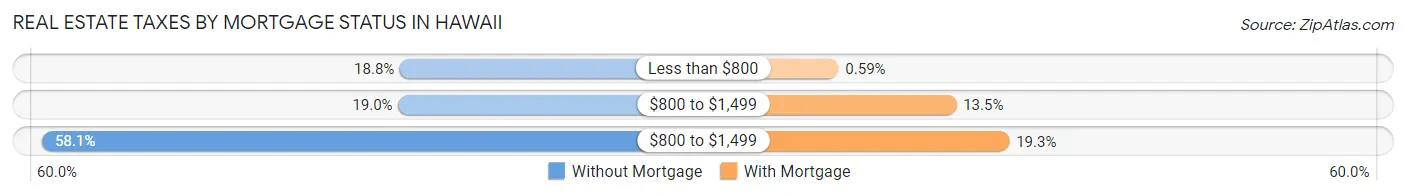
| Property Taxes | Without Mortgage | With Mortgage |
| Less than $800 | 20,209 (18.8%) | 1,129 (0.6%) |
| $800 to $1,499 | 20,410 (19.0%) | 25,858 (13.5%) |
| $800 to $1,499 | 62,293 (58.1%) | 36,995 (19.3%) |
| Total | 107,239 (100.0%) | 191,577 (100.0%) |
Health & Disability in Hawaii
Health Insurance Coverage by Age in Hawaii
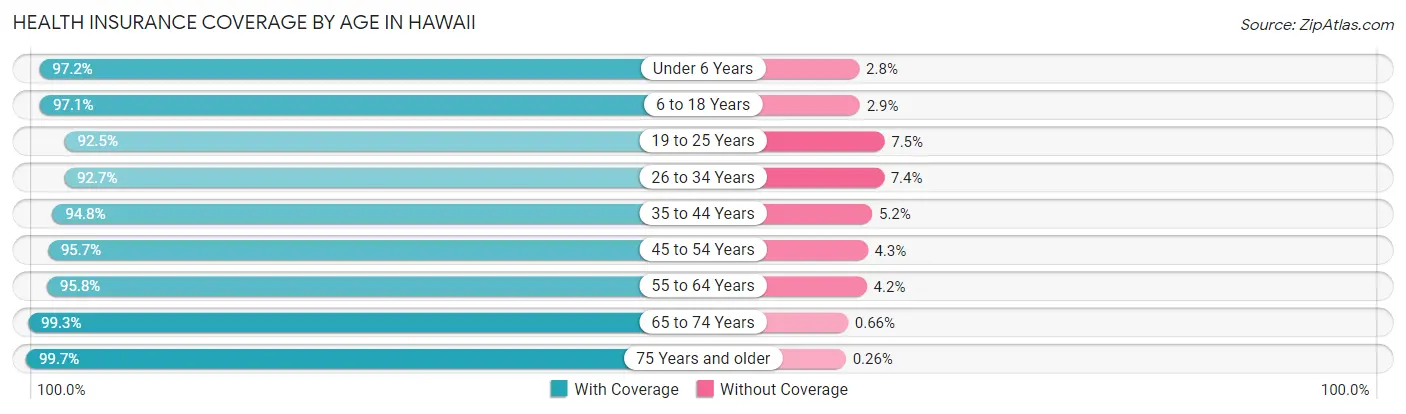
| Age Bracket | With Coverage | Without Coverage |
| Under 6 Years | 97,557 (97.2%) | 2,778 (2.8%) |
| 6 to 18 Years | 213,668 (97.1%) | 6,334 (2.9%) |
| 19 to 25 Years | 97,010 (92.5%) | 7,821 (7.5%) |
| 26 to 34 Years | 149,714 (92.6%) | 11,879 (7.3%) |
| 35 to 44 Years | 169,554 (94.8%) | 9,237 (5.2%) |
| 45 to 54 Years | 161,598 (95.7%) | 7,303 (4.3%) |
| 55 to 64 Years | 173,714 (95.8%) | 7,551 (4.2%) |
| 65 to 74 Years | 156,183 (99.3%) | 1,032 (0.7%) |
| 75 Years and older | 117,524 (99.7%) | 303 (0.3%) |
| Total | 1,336,522 (96.1%) | 54,238 (3.9%) |
Health Insurance Coverage by Citizenship Status in Hawaii
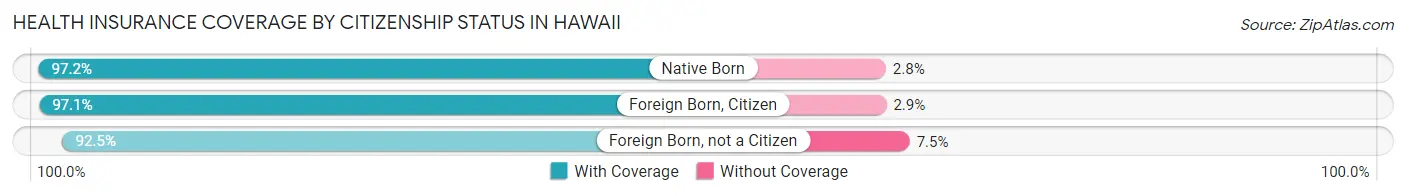
| Citizenship Status | With Coverage | Without Coverage |
| Native Born | 97,557 (97.2%) | 2,778 (2.8%) |
| Foreign Born, Citizen | 213,668 (97.1%) | 6,334 (2.9%) |
| Foreign Born, not a Citizen | 97,010 (92.5%) | 7,821 (7.5%) |
Health Insurance Coverage by Household Income in Hawaii
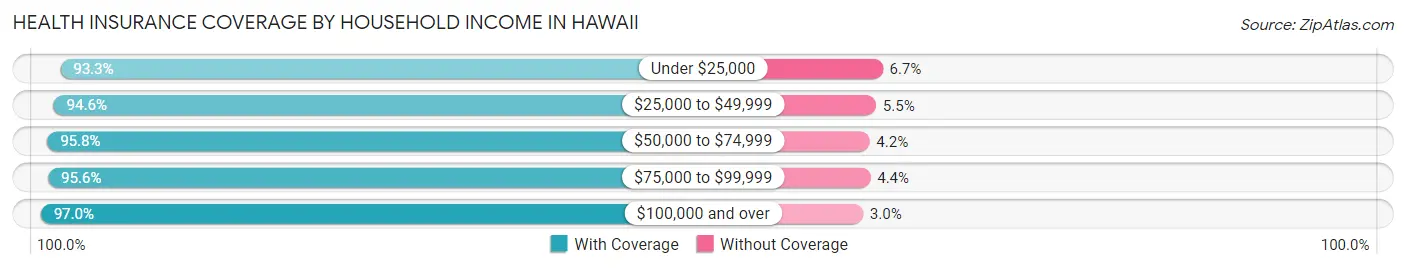
| Household Income | With Coverage | Without Coverage |
| Under $25,000 | 91,292 (93.3%) | 6,545 (6.7%) |
| $25,000 to $49,999 | 131,697 (94.6%) | 7,589 (5.4%) |
| $50,000 to $74,999 | 150,353 (95.8%) | 6,661 (4.2%) |
| $75,000 to $99,999 | 156,528 (95.6%) | 7,200 (4.4%) |
| $100,000 and over | 793,078 (97.0%) | 24,726 (3.0%) |
Public vs Private Health Insurance Coverage by Age in Hawaii
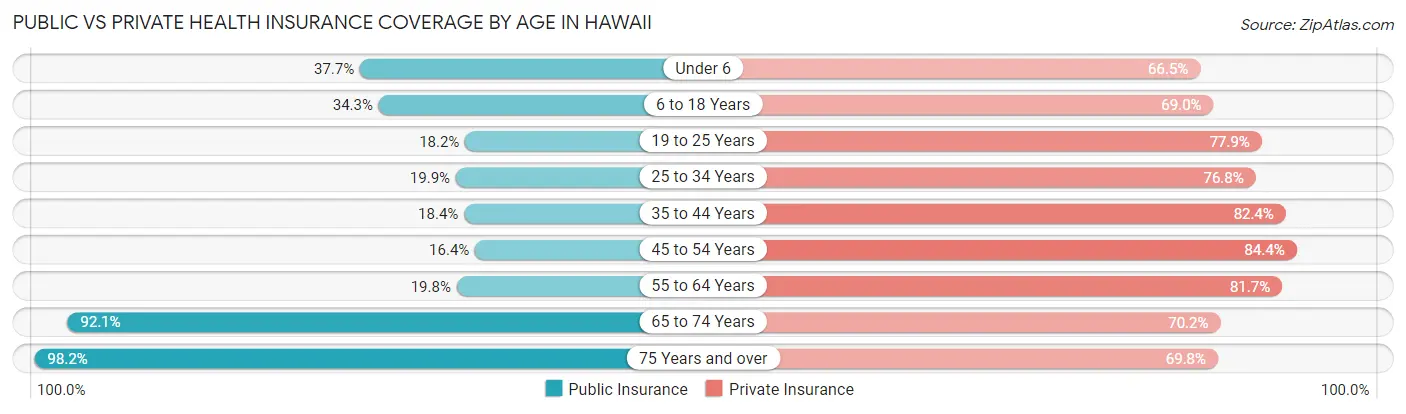
| Age Bracket | Public Insurance | Private Insurance |
| Under 6 | 37,852 (37.7%) | 66,729 (66.5%) |
| 6 to 18 Years | 75,380 (34.3%) | 151,727 (69.0%) |
| 19 to 25 Years | 19,099 (18.2%) | 81,700 (77.9%) |
| 25 to 34 Years | 32,215 (19.9%) | 124,086 (76.8%) |
| 35 to 44 Years | 32,911 (18.4%) | 147,307 (82.4%) |
| 45 to 54 Years | 27,656 (16.4%) | 142,587 (84.4%) |
| 55 to 64 Years | 35,865 (19.8%) | 148,093 (81.7%) |
| 65 to 74 Years | 144,728 (92.1%) | 110,421 (70.2%) |
| 75 Years and over | 115,671 (98.2%) | 82,247 (69.8%) |
| Total | 521,377 (37.5%) | 1,054,897 (75.8%) |
Disability Status by Sex by Age in Hawaii
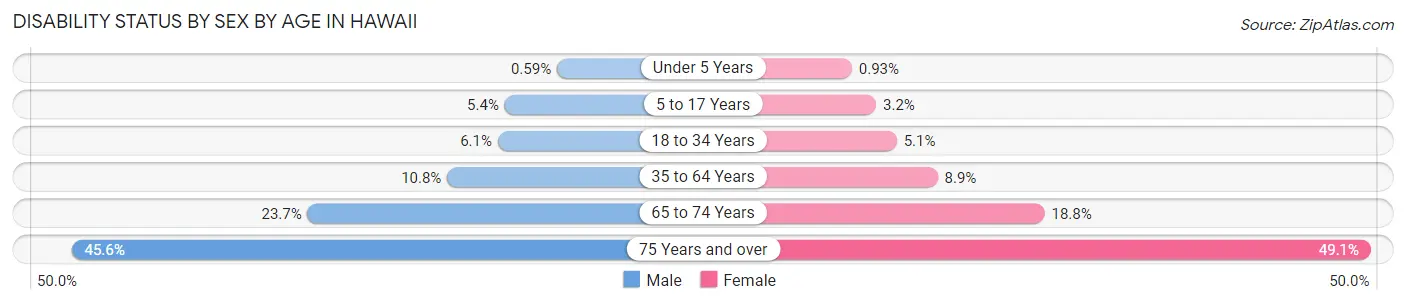
| Age Bracket | Male | Female |
| Under 5 Years | 257 (0.6%) | 378 (0.9%) |
| 5 to 17 Years | 6,195 (5.4%) | 3,400 (3.2%) |
| 18 to 34 Years | 8,398 (6.1%) | 7,322 (5.1%) |
| 35 to 64 Years | 28,285 (10.8%) | 23,696 (8.9%) |
| 65 to 74 Years | 18,091 (23.7%) | 15,249 (18.8%) |
| 75 Years and over | 22,522 (45.6%) | 33,623 (49.1%) |
Disability Class by Sex by Age in Hawaii
Disability Class: Hearing Difficulty
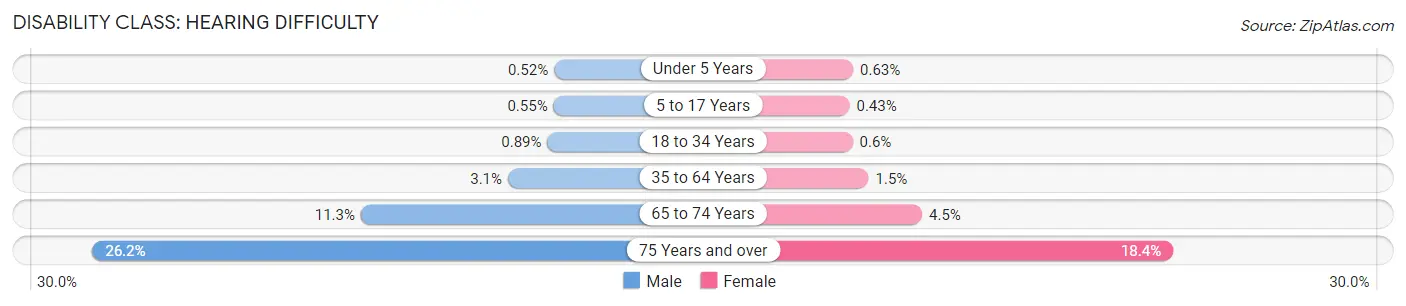
| Age Bracket | Male | Female |
| Under 5 Years | 229 (0.5%) | 257 (0.6%) |
| 5 to 17 Years | 622 (0.5%) | 457 (0.4%) |
| 18 to 34 Years | 1,229 (0.9%) | 857 (0.6%) |
| 35 to 64 Years | 8,107 (3.1%) | 3,964 (1.5%) |
| 65 to 74 Years | 8,597 (11.3%) | 3,618 (4.5%) |
| 75 Years and over | 12,943 (26.2%) | 12,627 (18.4%) |
Disability Class: Vision Difficulty
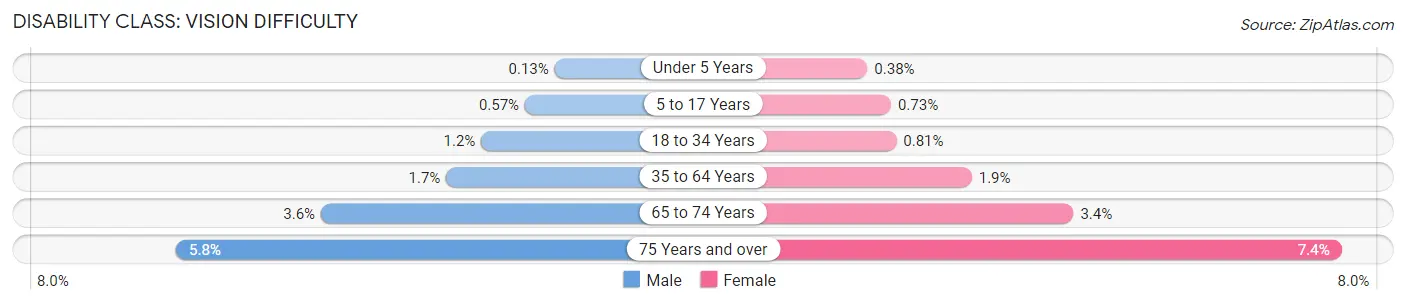
| Age Bracket | Male | Female |
| Under 5 Years | 57 (0.1%) | 154 (0.4%) |
| 5 to 17 Years | 646 (0.6%) | 782 (0.7%) |
| 18 to 34 Years | 1,684 (1.2%) | 1,164 (0.8%) |
| 35 to 64 Years | 4,577 (1.7%) | 5,148 (1.9%) |
| 65 to 74 Years | 2,740 (3.6%) | 2,784 (3.4%) |
| 75 Years and over | 2,838 (5.8%) | 5,082 (7.4%) |
Disability Class: Cognitive Difficulty

| Age Bracket | Male | Female |
| 5 to 17 Years | 4,915 (4.3%) | 2,064 (1.9%) |
| 18 to 34 Years | 5,469 (4.0%) | 4,202 (2.9%) |
| 35 to 64 Years | 11,863 (4.5%) | 8,754 (3.3%) |
| 65 to 74 Years | 4,370 (5.7%) | 3,039 (3.7%) |
| 75 Years and over | 6,612 (13.4%) | 12,309 (18.0%) |
Disability Class: Ambulatory Difficulty
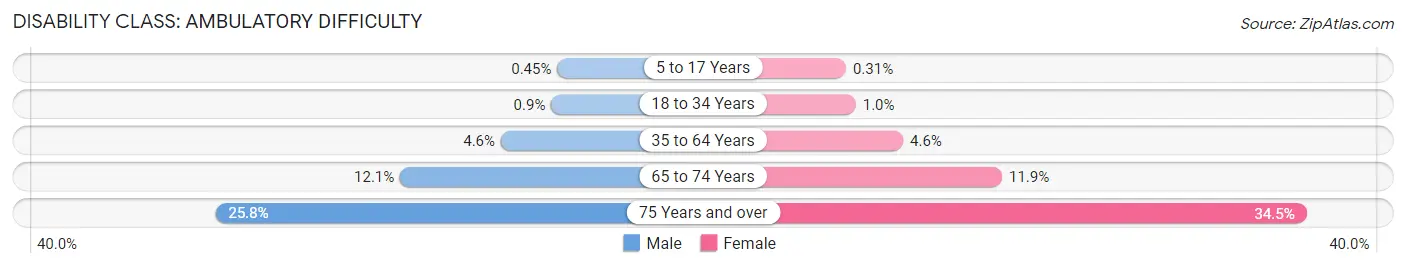
| Age Bracket | Male | Female |
| 5 to 17 Years | 512 (0.4%) | 332 (0.3%) |
| 18 to 34 Years | 1,250 (0.9%) | 1,487 (1.0%) |
| 35 to 64 Years | 12,163 (4.6%) | 12,125 (4.5%) |
| 65 to 74 Years | 9,233 (12.1%) | 9,642 (11.9%) |
| 75 Years and over | 12,748 (25.8%) | 23,628 (34.5%) |
Disability Class: Self-Care Difficulty
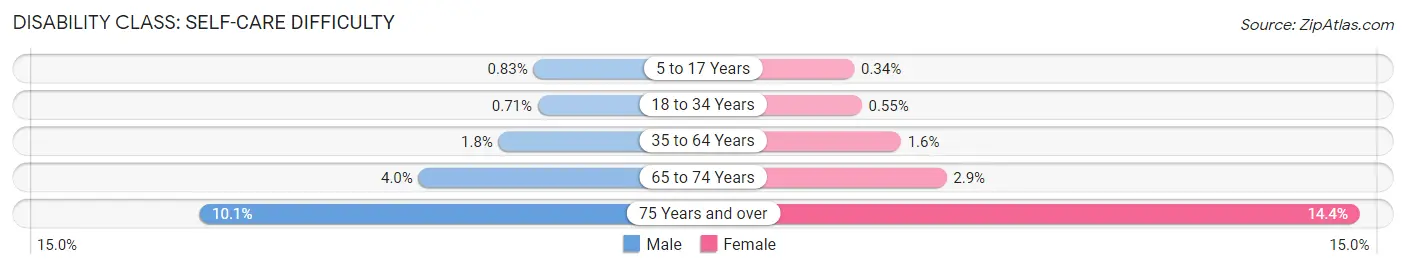
| Age Bracket | Male | Female |
| 5 to 17 Years | 941 (0.8%) | 362 (0.3%) |
| 18 to 34 Years | 977 (0.7%) | 784 (0.5%) |
| 35 to 64 Years | 4,725 (1.8%) | 4,362 (1.6%) |
| 65 to 74 Years | 3,073 (4.0%) | 2,359 (2.9%) |
| 75 Years and over | 5,005 (10.1%) | 9,878 (14.4%) |
Technology Access in Hawaii
Computing Device Access in Hawaii
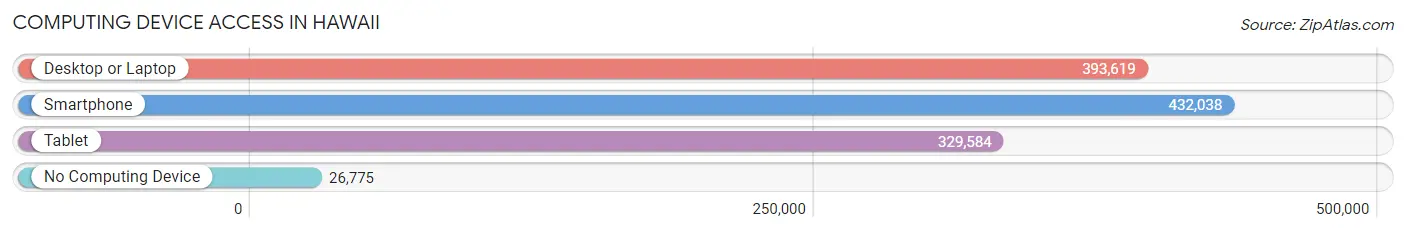
| Device Type | # Households | % Households |
| Desktop or Laptop | 393,619 | 81.3% |
| Smartphone | 432,038 | 89.3% |
| Tablet | 329,584 | 68.1% |
| No Computing Device | 26,775 | 5.5% |
| Total | 483,906 | 100.0% |
Internet Access in Hawaii

| Internet Type | # Households | % Households |
| Dial-Up Internet | 862 | 0.2% |
| Broadband Home | 376,193 | 77.7% |
| Cellular Data Only | 47,950 | 9.9% |
| Satellite Internet | 22,135 | 4.6% |
| No Internet | 48,513 | 10.0% |
| Total | 483,906 | 100.0% |
Hawaii Summary
Hawaii is the 50th and most recent state to join the United States of America. It is located in the Pacific Ocean, southwest of the continental United States. Hawaii is the only U.S. state located outside of North America and the only one composed entirely of islands. It is the northernmost island group in Polynesia, occupying most of an archipelago in the central Pacific Ocean.
History
The first inhabitants of the Hawaiian Islands were Polynesian voyagers who arrived sometime between A.D. 300 and 800. These people established a unique culture and language that still exists today. The first European contact with the islands was in 1778, when British explorer Captain James Cook arrived. He named the islands the Sandwich Islands, after the fourth Earl of Sandwich.
In 1810, King Kamehameha I united the Hawaiian Islands into one kingdom. He established a monarchy and a constitution, and the islands became known as the Kingdom of Hawaii. In 1820, the first Christian missionaries arrived, and by 1839, the Hawaiian language was written down for the first time.
In 1887, the Hawaiian monarchy was overthrown by a group of American businessmen and sugar planters. The islands were annexed by the United States in 1898, and in 1959, Hawaii became the 50th state of the United States.
Geography
Hawaii is composed of eight main islands: Hawaii (the Big Island), Maui, Oahu, Kauai, Molokai, Lanai, Niihau, and Kahoolawe. The islands are located in the middle of the Pacific Ocean, about 2,400 miles from the mainland United States. The islands are volcanic in origin, and the highest point in the state is Mauna Kea, which stands at 13,796 feet above sea level.
Hawaii has a tropical climate, with warm temperatures year-round. The islands receive abundant rainfall, and the average annual temperature is around 75 degrees Fahrenheit.
Economy
Hawaii’s economy is largely based on tourism, with visitors drawn to the state’s beautiful beaches and tropical climate. The state is also a major producer of sugar, pineapple, and coffee. Other important industries include fishing, manufacturing, and the military.
Demographics
As of the 2010 census, the population of Hawaii was 1,360,301. The largest ethnic group is Asian, making up 38.6% of the population. The second largest group is Caucasian, at 24.7%. Native Hawaiians and other Pacific Islanders make up 10.4% of the population, and Hispanics or Latinos make up 8.9%.
Hawaii is the most ethnically diverse state in the United States. English is the most widely spoken language, but Hawaiian, Samoan, Tongan, and other Pacific Islander languages are also spoken. The majority of the population is Christian, with Roman Catholics making up the largest denomination.
Common Questions
When was Hawaii Incorporated?
Hawaii was Incorporated into the Union on Aug 21, 1959.
What is the Total Area of Hawaii?
Total Area of Hawaii is 10,926 Square Miles.
What is the Total Land Area of Hawaii?
Total Land Area of Hawaii is 6,428 Square Miles.
What is the Total Water Area of Hawaii?
Total Water Area of Hawaii is 4,499 Square Miles.
What is the Average Elevation in Hawaii?
Average Elevation in Hawaii is 3,030 Feet.
What is the Highest Elevation in Hawaii?
Highest Elevation in Hawaii is 13,796 Feet.
What is the Lowest Elevation in Hawaii?
Lowest Elevation in Hawaii is 0 Feet.
What is the Population Density in Hawaii?
Population Density in Hawaii is 225.7 People per Square Mile.
What is Per Capita Income in Hawaii?
Per Capita income in Hawaii is $42,683.
What is the Median Family Income in Hawaii?
Median Family Income in Hawaii is $111,678.
What is the Median Household income in Hawaii?
Median Household Income in Hawaii is $94,814.
What is Income or Wage Gap in Hawaii?
Income or Wage Gap in Hawaii is 22.5%.
Women in Hawaii earn 77.5 cents for every dollar earned by a man.
What is Family Income Deficit in Hawaii?
Family Income Deficit in Hawaii is $11,295.
Families that are below poverty line in Hawaii earn $11,295 less on average than the poverty threshold level.
What is Inequality or Gini Index in Hawaii?
Inequality or Gini Index in Hawaii is 0.45.
What is the Total Population of Hawaii?
Total Population of Hawaii is 1,450,589.
What is the Total Male Population of Hawaii?
Total Male Population of Hawaii is 732,060.
What is the Total Female Population of Hawaii?
Total Female Population of Hawaii is 718,529.
What is the Ratio of Males per 100 Females in Hawaii?
There are 101.88 Males per 100 Females in Hawaii.
What is the Ratio of Females per 100 Males in Hawaii?
There are 98.15 Females per 100 Males in Hawaii.
What is the Median Population Age in Hawaii?
Median Population Age in Hawaii is 39.9 Years.
What is the Average Family Size in Hawaii
Average Family Size in Hawaii is 3.5 People.
What is the Average Household Size in Hawaii
Average Household Size in Hawaii is 2.9 People.
How Large is the Labor Force in Hawaii?
There are 760,259 People in the Labor Forcein in Hawaii.
What is the Percentage of People in the Labor Force in Hawaii?
64.6% of People are in the Labor Force in Hawaii.
What is the Unemployment Rate in Hawaii?
Unemployment Rate in Hawaii is 5.1%.