Cities with the Most Immigrants from Uzbekistan in California
RELATED REPORTS & OPTIONS
Uzbekistan
California
Compare Cities
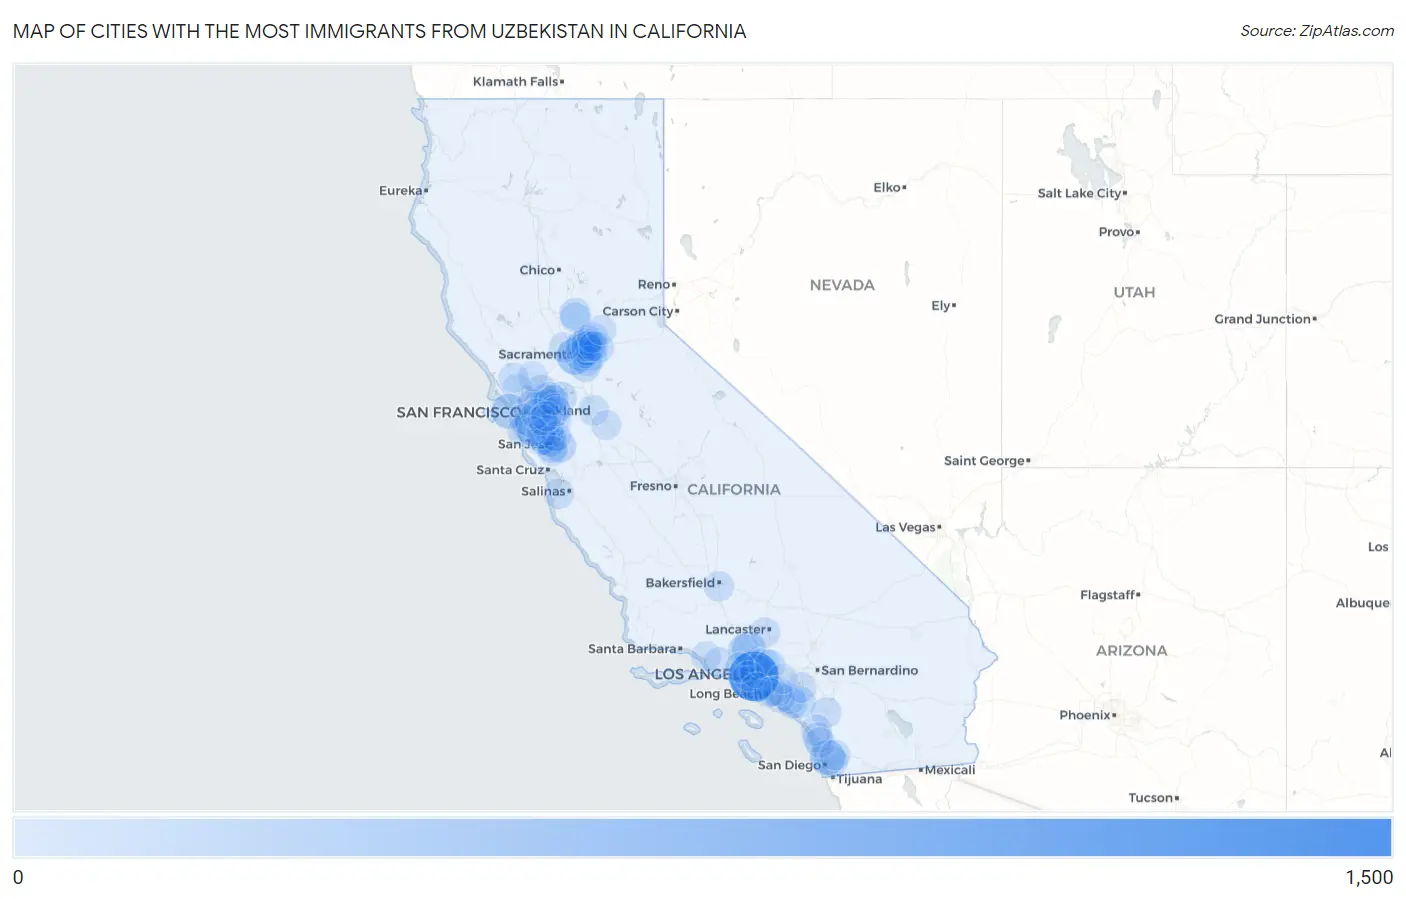
Map of Cities with the Most Immigrants from Uzbekistan in California
0
1,500
Cities with the Most Immigrants from Uzbekistan in California
| City | Uzbekistan | vs State | vs National | |
| 1. | Los Angeles | 1,228 | 5,897(20.82%)#1 | 71,316(1.72%)#3 |
| 2. | West Sacramento | 404 | 5,897(6.85%)#2 | 71,316(0.57%)#9 |
| 3. | North Highlands | 320 | 5,897(5.43%)#3 | 71,316(0.45%)#15 |
| 4. | San Diego | 310 | 5,897(5.26%)#4 | 71,316(0.43%)#17 |
| 5. | San Francisco | 284 | 5,897(4.82%)#5 | 71,316(0.40%)#18 |
| 6. | Santa Clarita | 230 | 5,897(3.90%)#6 | 71,316(0.32%)#29 |
| 7. | West Hollywood | 221 | 5,897(3.75%)#7 | 71,316(0.31%)#32 |
| 8. | Sunnyvale | 180 | 5,897(3.05%)#8 | 71,316(0.25%)#40 |
| 9. | San Jose | 135 | 5,897(2.29%)#9 | 71,316(0.19%)#53 |
| 10. | Hillsborough | 104 | 5,897(1.76%)#10 | 71,316(0.15%)#77 |
| 11. | Sacramento | 98 | 5,897(1.66%)#11 | 71,316(0.14%)#80 |
| 12. | Elk Grove | 92 | 5,897(1.56%)#12 | 71,316(0.13%)#85 |
| 13. | Rancho Santa Margarita | 87 | 5,897(1.48%)#13 | 71,316(0.12%)#92 |
| 14. | Stevenson Ranch | 87 | 5,897(1.48%)#14 | 71,316(0.12%)#94 |
| 15. | Antioch | 85 | 5,897(1.44%)#15 | 71,316(0.12%)#97 |
| 16. | Rancho Cordova | 85 | 5,897(1.44%)#16 | 71,316(0.12%)#98 |
| 17. | Mountain View | 84 | 5,897(1.42%)#17 | 71,316(0.12%)#99 |
| 18. | Linda | 81 | 5,897(1.37%)#18 | 71,316(0.11%)#103 |
| 19. | Glendale | 80 | 5,897(1.36%)#19 | 71,316(0.11%)#104 |
| 20. | Rio Linda | 77 | 5,897(1.31%)#20 | 71,316(0.11%)#109 |
| 21. | Arden Arcade | 72 | 5,897(1.22%)#21 | 71,316(0.10%)#116 |
| 22. | Carmichael | 72 | 5,897(1.22%)#22 | 71,316(0.10%)#117 |
| 23. | Santa Clara | 65 | 5,897(1.10%)#23 | 71,316(0.09%)#129 |
| 24. | Moraga | 64 | 5,897(1.09%)#24 | 71,316(0.09%)#133 |
| 25. | Concord | 60 | 5,897(1.02%)#25 | 71,316(0.08%)#139 |
| 26. | South San Francisco | 59 | 5,897(1.00%)#26 | 71,316(0.08%)#143 |
| 27. | La Mesa | 47 | 5,897(0.80%)#27 | 71,316(0.07%)#172 |
| 28. | Irvine | 44 | 5,897(0.75%)#28 | 71,316(0.06%)#178 |
| 29. | Oceanside | 42 | 5,897(0.71%)#29 | 71,316(0.06%)#184 |
| 30. | Pasadena | 42 | 5,897(0.71%)#30 | 71,316(0.06%)#185 |
| 31. | Benicia | 42 | 5,897(0.71%)#31 | 71,316(0.06%)#188 |
| 32. | Antelope | 38 | 5,897(0.64%)#32 | 71,316(0.05%)#207 |
| 33. | Berkeley | 37 | 5,897(0.63%)#33 | 71,316(0.05%)#211 |
| 34. | Citrus Heights | 37 | 5,897(0.63%)#34 | 71,316(0.05%)#213 |
| 35. | Roseville | 33 | 5,897(0.56%)#35 | 71,316(0.05%)#227 |
| 36. | Folsom | 31 | 5,897(0.53%)#36 | 71,316(0.04%)#233 |
| 37. | Orinda | 31 | 5,897(0.53%)#37 | 71,316(0.04%)#238 |
| 38. | Daly City | 30 | 5,897(0.51%)#38 | 71,316(0.04%)#241 |
| 39. | Camarillo | 30 | 5,897(0.51%)#39 | 71,316(0.04%)#245 |
| 40. | Bakersfield | 27 | 5,897(0.46%)#40 | 71,316(0.04%)#263 |
| 41. | Pleasanton | 26 | 5,897(0.44%)#41 | 71,316(0.04%)#267 |
| 42. | Laguna Woods | 26 | 5,897(0.44%)#42 | 71,316(0.04%)#271 |
| 43. | El Granada | 26 | 5,897(0.44%)#43 | 71,316(0.04%)#272 |
| 44. | Temecula | 25 | 5,897(0.42%)#44 | 71,316(0.04%)#277 |
| 45. | San Ramon | 24 | 5,897(0.41%)#45 | 71,316(0.03%)#282 |
| 46. | Walnut Creek | 24 | 5,897(0.41%)#46 | 71,316(0.03%)#283 |
| 47. | Seaside | 24 | 5,897(0.41%)#47 | 71,316(0.03%)#285 |
| 48. | Pleasant Hill | 23 | 5,897(0.39%)#48 | 71,316(0.03%)#292 |
| 49. | Hayward | 22 | 5,897(0.37%)#49 | 71,316(0.03%)#300 |
| 50. | Corona | 19 | 5,897(0.32%)#50 | 71,316(0.03%)#322 |
| 51. | Carlsbad | 19 | 5,897(0.32%)#51 | 71,316(0.03%)#324 |
| 52. | Encinitas | 19 | 5,897(0.32%)#52 | 71,316(0.03%)#329 |
| 53. | Santee | 19 | 5,897(0.32%)#53 | 71,316(0.03%)#330 |
| 54. | Campbell | 19 | 5,897(0.32%)#54 | 71,316(0.03%)#332 |
| 55. | Blackhawk | 19 | 5,897(0.32%)#55 | 71,316(0.03%)#338 |
| 56. | Santa Monica | 18 | 5,897(0.31%)#56 | 71,316(0.03%)#347 |
| 57. | Palo Alto | 18 | 5,897(0.31%)#57 | 71,316(0.03%)#351 |
| 58. | Vineyard | 18 | 5,897(0.31%)#58 | 71,316(0.03%)#354 |
| 59. | Foothill Farms | 18 | 5,897(0.31%)#59 | 71,316(0.03%)#355 |
| 60. | Rocklin | 17 | 5,897(0.29%)#60 | 71,316(0.02%)#363 |
| 61. | Menlo Park | 16 | 5,897(0.27%)#61 | 71,316(0.02%)#378 |
| 62. | Olivehurst | 16 | 5,897(0.27%)#62 | 71,316(0.02%)#380 |
| 63. | Woodland | 15 | 5,897(0.25%)#63 | 71,316(0.02%)#394 |
| 64. | Fountain Valley | 14 | 5,897(0.24%)#64 | 71,316(0.02%)#412 |
| 65. | Fremont | 13 | 5,897(0.22%)#65 | 71,316(0.02%)#423 |
| 66. | Manteca | 13 | 5,897(0.22%)#66 | 71,316(0.02%)#427 |
| 67. | Calabasas | 12 | 5,897(0.20%)#67 | 71,316(0.02%)#449 |
| 68. | Quartz Hill | 12 | 5,897(0.20%)#68 | 71,316(0.02%)#454 |
| 69. | Milpitas | 11 | 5,897(0.19%)#69 | 71,316(0.02%)#461 |
| 70. | Novato | 10 | 5,897(0.17%)#70 | 71,316(0.01%)#484 |
| 71. | Stanton | 10 | 5,897(0.17%)#71 | 71,316(0.01%)#485 |
| 72. | Rossmoor | 10 | 5,897(0.17%)#72 | 71,316(0.01%)#492 |
| 73. | Oakland | 9 | 5,897(0.15%)#73 | 71,316(0.01%)#499 |
| 74. | Los Gatos | 9 | 5,897(0.15%)#74 | 71,316(0.01%)#502 |
| 75. | Belmont | 9 | 5,897(0.15%)#75 | 71,316(0.01%)#505 |
| 76. | Camino Tassajara | 9 | 5,897(0.15%)#76 | 71,316(0.01%)#511 |
| 77. | San Buenaventura Ventura | 8 | 5,897(0.14%)#77 | 71,316(0.01%)#517 |
| 78. | San Lorenzo | 8 | 5,897(0.14%)#78 | 71,316(0.01%)#522 |
| 79. | Clayton | 8 | 5,897(0.14%)#79 | 71,316(0.01%)#525 |
| 80. | Petaluma | 7 | 5,897(0.12%)#80 | 71,316(0.01%)#535 |
| 81. | Rowland Heights | 7 | 5,897(0.12%)#81 | 71,316(0.01%)#536 |
| 82. | Long Beach | 6 | 5,897(0.10%)#82 | 71,316(0.01%)#550 |
| 83. | Redondo Beach | 6 | 5,897(0.10%)#83 | 71,316(0.01%)#558 |
| 84. | Castro Valley | 6 | 5,897(0.10%)#84 | 71,316(0.01%)#559 |
| 85. | Auburn | 6 | 5,897(0.10%)#85 | 71,316(0.01%)#561 |
| 86. | Orangevale | 5 | 5,897(0.08%)#86 | 71,316(0.01%)#570 |
| 87. | Modesto | 4 | 5,897(0.07%)#87 | 71,316(0.01%)#588 |
| 88. | Napa | 4 | 5,897(0.07%)#88 | 71,316(0.01%)#590 |
Common Questions
What are the Top 10 Cities with the Most Immigrants from Uzbekistan in California?
Top 10 Cities with the Most Immigrants from Uzbekistan in California are:
#1
1,228
#2
404
#3
320
#4
310
#5
284
#6
230
#7
221
#8
180
#9
135
#10
104
What city has the Most Immigrants from Uzbekistan in California?
Los Angeles has the Most Immigrants from Uzbekistan in California with 1,228.
What is the Total Immigrants from Uzbekistan in the State of California?
Total Immigrants from Uzbekistan in California is 5,897.
What is the Total Immigrants from Uzbekistan in the United States?
Total Immigrants from Uzbekistan in the United States is 71,316.