Cities with the Largest Icelander Community in California
RELATED REPORTS & OPTIONS
Icelander
California
Compare Cities
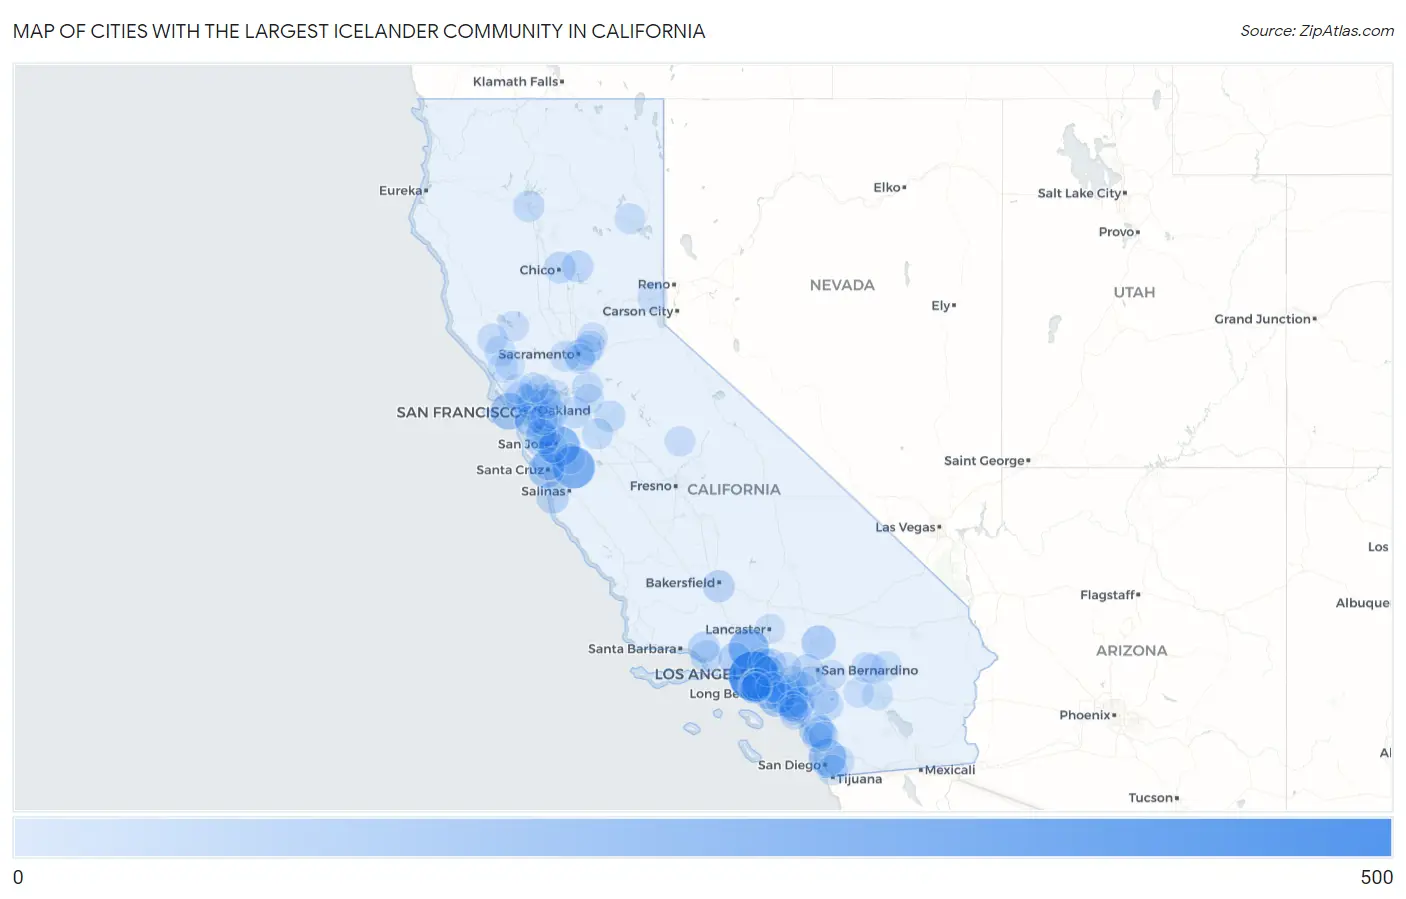
Map of Cities with the Largest Icelander Community in California
0
500
Cities with the Largest Icelander Community in California
| City | Icelander | vs State | vs National | |
| 1. | Los Angeles | 456 | 6,565(6.95%)#1 | 51,665(0.88%)#5 |
| 2. | Gilroy | 283 | 6,565(4.31%)#2 | 51,665(0.55%)#13 |
| 3. | Santa Clarita | 237 | 6,565(3.61%)#3 | 51,665(0.46%)#18 |
| 4. | San Jose | 235 | 6,565(3.58%)#4 | 51,665(0.45%)#19 |
| 5. | San Diego | 175 | 6,565(2.67%)#5 | 51,665(0.34%)#25 |
| 6. | Irvine | 167 | 6,565(2.54%)#6 | 51,665(0.32%)#31 |
| 7. | San Francisco | 160 | 6,565(2.44%)#7 | 51,665(0.31%)#35 |
| 8. | Santa Cruz | 144 | 6,565(2.19%)#8 | 51,665(0.28%)#42 |
| 9. | Huntington Beach | 143 | 6,565(2.18%)#9 | 51,665(0.28%)#43 |
| 10. | Oceanside | 107 | 6,565(1.63%)#10 | 51,665(0.21%)#76 |
| 11. | Mission Viejo | 105 | 6,565(1.60%)#11 | 51,665(0.20%)#77 |
| 12. | Spring Valley Lake | 104 | 6,565(1.58%)#12 | 51,665(0.20%)#79 |
| 13. | Long Beach | 93 | 6,565(1.42%)#13 | 51,665(0.18%)#89 |
| 14. | Palo Alto | 89 | 6,565(1.36%)#14 | 51,665(0.17%)#97 |
| 15. | Pasadena | 83 | 6,565(1.26%)#15 | 51,665(0.16%)#104 |
| 16. | Simi Valley | 80 | 6,565(1.22%)#16 | 51,665(0.15%)#110 |
| 17. | Scotts Valley | 76 | 6,565(1.16%)#17 | 51,665(0.15%)#120 |
| 18. | Bayview Cdp Humboldt County | 70 | 6,565(1.07%)#18 | 51,665(0.14%)#130 |
| 19. | Fremont | 66 | 6,565(1.01%)#19 | 51,665(0.13%)#140 |
| 20. | Vista | 63 | 6,565(0.96%)#20 | 51,665(0.12%)#149 |
| 21. | Bakersfield | 62 | 6,565(0.94%)#21 | 51,665(0.12%)#150 |
| 22. | Del Monte Forest | 62 | 6,565(0.94%)#22 | 51,665(0.12%)#155 |
| 23. | Lawndale | 60 | 6,565(0.91%)#23 | 51,665(0.12%)#161 |
| 24. | Fontana | 55 | 6,565(0.84%)#24 | 51,665(0.11%)#177 |
| 25. | San Buenaventura Ventura | 55 | 6,565(0.84%)#25 | 51,665(0.11%)#178 |
| 26. | Sacramento | 52 | 6,565(0.79%)#26 | 51,665(0.10%)#185 |
| 27. | Oakland | 52 | 6,565(0.79%)#27 | 51,665(0.10%)#186 |
| 28. | Chico | 52 | 6,565(0.79%)#28 | 51,665(0.10%)#187 |
| 29. | Mira Monte | 52 | 6,565(0.79%)#29 | 51,665(0.10%)#191 |
| 30. | Concow | 51 | 6,565(0.78%)#30 | 51,665(0.10%)#197 |
| 31. | Dana Point | 50 | 6,565(0.76%)#31 | 51,665(0.10%)#199 |
| 32. | Mountain House | 49 | 6,565(0.75%)#32 | 51,665(0.09%)#205 |
| 33. | French Valley | 48 | 6,565(0.73%)#33 | 51,665(0.09%)#208 |
| 34. | Orange | 47 | 6,565(0.72%)#34 | 51,665(0.09%)#210 |
| 35. | Redding | 46 | 6,565(0.70%)#35 | 51,665(0.09%)#217 |
| 36. | Buena Park | 43 | 6,565(0.65%)#36 | 51,665(0.08%)#234 |
| 37. | Riverbank | 43 | 6,565(0.65%)#37 | 51,665(0.08%)#235 |
| 38. | Corona | 42 | 6,565(0.64%)#38 | 51,665(0.08%)#236 |
| 39. | Fountain Valley | 42 | 6,565(0.64%)#39 | 51,665(0.08%)#238 |
| 40. | Brisbane | 42 | 6,565(0.64%)#40 | 51,665(0.08%)#240 |
| 41. | Lodi | 41 | 6,565(0.62%)#41 | 51,665(0.08%)#241 |
| 42. | Berkeley | 38 | 6,565(0.58%)#42 | 51,665(0.07%)#253 |
| 43. | Patterson | 38 | 6,565(0.58%)#43 | 51,665(0.07%)#255 |
| 44. | Rancho San Diego | 38 | 6,565(0.58%)#44 | 51,665(0.07%)#257 |
| 45. | Glendale | 37 | 6,565(0.56%)#45 | 51,665(0.07%)#261 |
| 46. | Chino Hills | 36 | 6,565(0.55%)#46 | 51,665(0.07%)#273 |
| 47. | Hermosa Beach | 36 | 6,565(0.55%)#47 | 51,665(0.07%)#276 |
| 48. | Richmond | 35 | 6,565(0.53%)#48 | 51,665(0.07%)#280 |
| 49. | Rancho Santa Margarita | 34 | 6,565(0.52%)#49 | 51,665(0.07%)#292 |
| 50. | Citrus Heights | 32 | 6,565(0.49%)#50 | 51,665(0.06%)#309 |
| 51. | Davis | 31 | 6,565(0.47%)#51 | 51,665(0.06%)#315 |
| 52. | El Sobrante Cdp Contra Costa County | 31 | 6,565(0.47%)#52 | 51,665(0.06%)#319 |
| 53. | Healdsburg | 31 | 6,565(0.47%)#53 | 51,665(0.06%)#320 |
| 54. | Riverside | 30 | 6,565(0.46%)#54 | 51,665(0.06%)#323 |
| 55. | Torrance | 30 | 6,565(0.46%)#55 | 51,665(0.06%)#325 |
| 56. | Mountain View | 30 | 6,565(0.46%)#56 | 51,665(0.06%)#328 |
| 57. | La Canada Flintridge | 29 | 6,565(0.44%)#57 | 51,665(0.06%)#351 |
| 58. | Susanville | 29 | 6,565(0.44%)#58 | 51,665(0.06%)#352 |
| 59. | Chula Vista | 28 | 6,565(0.43%)#59 | 51,665(0.05%)#357 |
| 60. | Glendora | 28 | 6,565(0.43%)#60 | 51,665(0.05%)#360 |
| 61. | Morgan Hill | 28 | 6,565(0.43%)#61 | 51,665(0.05%)#361 |
| 62. | South San Francisco | 27 | 6,565(0.41%)#62 | 51,665(0.05%)#369 |
| 63. | Indio | 26 | 6,565(0.40%)#63 | 51,665(0.05%)#385 |
| 64. | Castro Valley | 25 | 6,565(0.38%)#64 | 51,665(0.05%)#400 |
| 65. | Clearlake | 25 | 6,565(0.38%)#65 | 51,665(0.05%)#404 |
| 66. | Hawthorne | 24 | 6,565(0.37%)#66 | 51,665(0.05%)#420 |
| 67. | San Ramon | 24 | 6,565(0.37%)#67 | 51,665(0.05%)#421 |
| 68. | San Rafael | 24 | 6,565(0.37%)#68 | 51,665(0.05%)#422 |
| 69. | Campbell | 24 | 6,565(0.37%)#69 | 51,665(0.05%)#425 |
| 70. | Palm Springs | 23 | 6,565(0.35%)#70 | 51,665(0.04%)#438 |
| 71. | Truckee | 23 | 6,565(0.35%)#71 | 51,665(0.04%)#442 |
| 72. | Cloverdale | 23 | 6,565(0.35%)#72 | 51,665(0.04%)#446 |
| 73. | Ahwahnee | 23 | 6,565(0.35%)#73 | 51,665(0.04%)#450 |
| 74. | Menifee | 22 | 6,565(0.34%)#74 | 51,665(0.04%)#454 |
| 75. | Menlo Park | 22 | 6,565(0.34%)#75 | 51,665(0.04%)#459 |
| 76. | Yucca Valley | 22 | 6,565(0.34%)#76 | 51,665(0.04%)#463 |
| 77. | Carmichael | 21 | 6,565(0.32%)#77 | 51,665(0.04%)#474 |
| 78. | Rocklin | 21 | 6,565(0.32%)#78 | 51,665(0.04%)#475 |
| 79. | Yucaipa | 21 | 6,565(0.32%)#79 | 51,665(0.04%)#477 |
| 80. | Pleasant Hill | 21 | 6,565(0.32%)#80 | 51,665(0.04%)#479 |
| 81. | San Lorenzo | 21 | 6,565(0.32%)#81 | 51,665(0.04%)#481 |
| 82. | Benicia | 21 | 6,565(0.32%)#82 | 51,665(0.04%)#483 |
| 83. | Alhambra | 20 | 6,565(0.30%)#83 | 51,665(0.04%)#498 |
| 84. | Sebastopol | 19 | 6,565(0.29%)#84 | 51,665(0.04%)#536 |
| 85. | Lancaster | 18 | 6,565(0.27%)#85 | 51,665(0.03%)#542 |
| 86. | Carlsbad | 18 | 6,565(0.27%)#86 | 51,665(0.03%)#543 |
| 87. | Lakewood | 18 | 6,565(0.27%)#87 | 51,665(0.03%)#545 |
| 88. | Redondo Beach | 18 | 6,565(0.27%)#88 | 51,665(0.03%)#547 |
| 89. | Walnut Creek | 18 | 6,565(0.27%)#89 | 51,665(0.03%)#548 |
| 90. | Aliso Viejo | 18 | 6,565(0.27%)#90 | 51,665(0.03%)#551 |
| 91. | Lemon Hill | 18 | 6,565(0.27%)#91 | 51,665(0.03%)#563 |
| 92. | San Marcos | 17 | 6,565(0.26%)#92 | 51,665(0.03%)#577 |
| 93. | Pittsburg | 17 | 6,565(0.26%)#93 | 51,665(0.03%)#580 |
| 94. | Novato | 17 | 6,565(0.26%)#94 | 51,665(0.03%)#582 |
| 95. | Twentynine Palms | 17 | 6,565(0.26%)#95 | 51,665(0.03%)#588 |
| 96. | Joshua Tree | 17 | 6,565(0.26%)#96 | 51,665(0.03%)#598 |
| 97. | Stockton | 16 | 6,565(0.24%)#97 | 51,665(0.03%)#604 |
| 98. | Santa Rosa | 16 | 6,565(0.24%)#98 | 51,665(0.03%)#607 |
| 99. | Vallejo | 16 | 6,565(0.24%)#99 | 51,665(0.03%)#609 |
| 100. | Laguna Niguel | 16 | 6,565(0.24%)#100 | 51,665(0.03%)#614 |
Common Questions
What are the Top 10 Cities with the Largest Icelander Community in California?
Top 10 Cities with the Largest Icelander Community in California are:
#1
456
#2
283
#3
237
#4
235
#5
175
#6
167
#7
160
#8
144
#9
143
#10
107
What city has the Largest Icelander Community in California?
Los Angeles has the Largest Icelander Community in California with 456.
What is the Total Icelander Population in the State of California?
Total Icelander Population in California is 6,565.
What is the Total Icelander Population in the United States?
Total Icelander Population in the United States is 51,665.