Cities with the Highest Percentage of Population Employed in Installation, Maintenance & Repair in the United States
RELATED REPORTS & OPTIONS
Installation, Maintenance & Repair
United States
Compare Cities
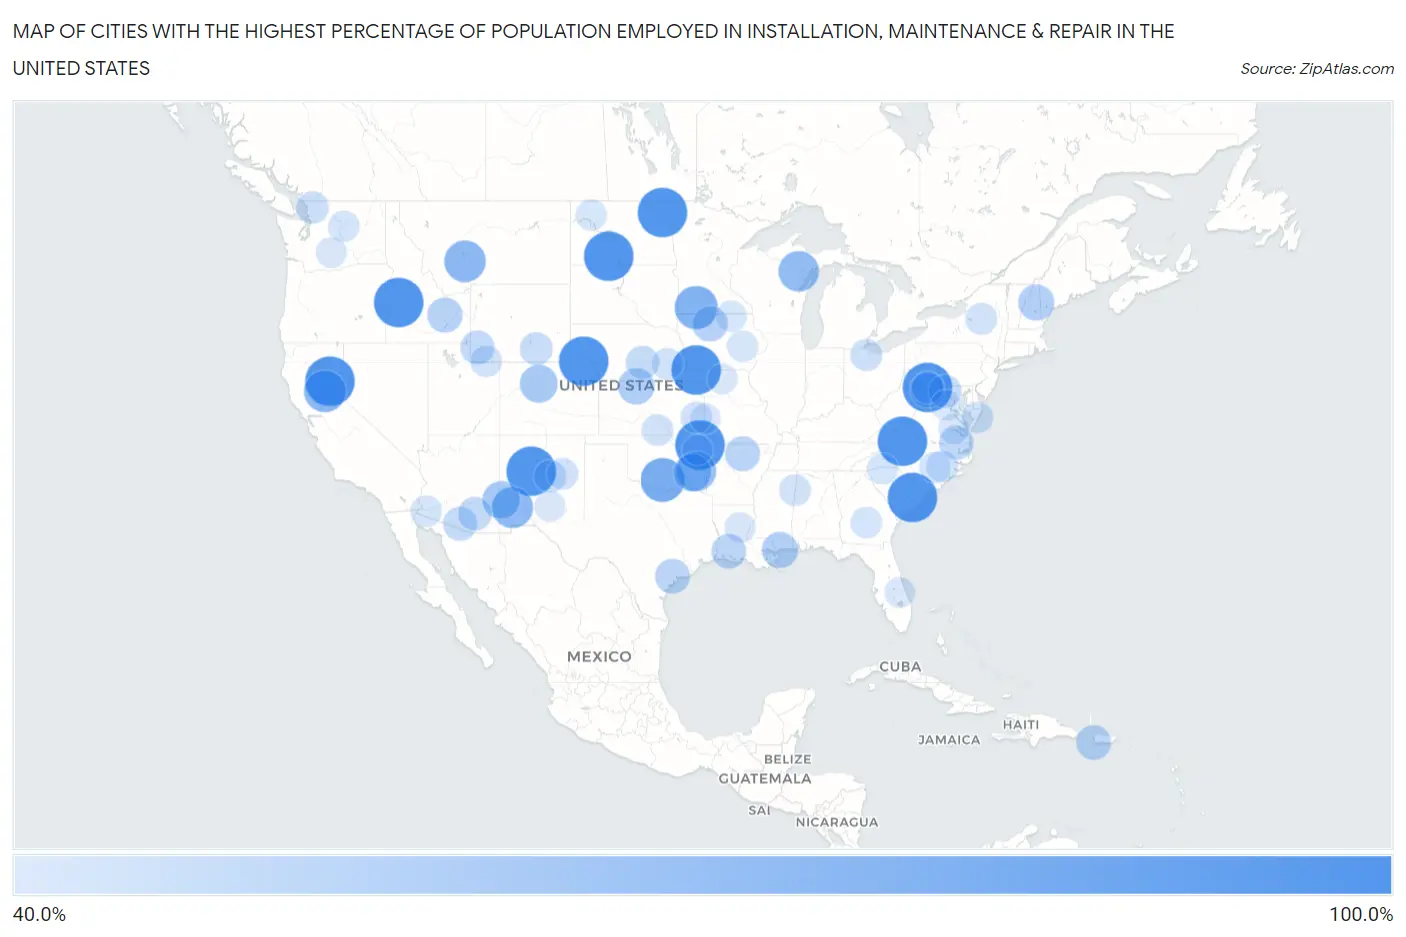
Map of Cities with the Highest Percentage of Population Employed in Installation, Maintenance & Repair in the United States
0.0%
100.0%
Cities with the Highest Percentage of Population Employed in Installation, Maintenance & Repair in the United States
| City | % Employed | vs State | vs National | |
| 1. | Russellville | 100.0% | 3.8%(+96.2)#1 | 3.1%(+96.9)#1 |
| 2. | Jamestown | 100.0% | 3.7%(+96.3)#1 | 3.1%(+96.9)#2 |
| 3. | Pajarito Mesa | 100.0% | 3.7%(+96.3)#2 | 3.1%(+96.9)#3 |
| 4. | Morrow | 100.0% | 3.7%(+96.3)#1 | 3.1%(+96.9)#4 |
| 5. | Drowning Creek | 100.0% | 4.2%(+95.8)#1 | 3.1%(+96.9)#5 |
| 6. | Urbana | 100.0% | 3.5%(+96.5)#1 | 3.1%(+96.9)#6 |
| 7. | San Jose Cdp San Miguel County | 100.0% | 3.7%(+96.3)#3 | 3.1%(+96.9)#7 |
| 8. | Keddie | 100.0% | 2.6%(+97.4)#1 | 3.1%(+96.9)#8 |
| 9. | Rectortown | 100.0% | 2.9%(+97.1)#1 | 3.1%(+96.9)#9 |
| 10. | Floral | 100.0% | 3.8%(+96.2)#1 | 3.1%(+96.9)#10 |
| 11. | Ohoopee | 100.0% | 3.4%(+96.6)#1 | 3.1%(+96.9)#11 |
| 12. | Blanchard | 100.0% | 3.2%(+96.8)#1 | 3.1%(+96.9)#12 |
| 13. | Homestead | 100.0% | 4.2%(+95.8)#2 | 3.1%(+96.9)#13 |
| 14. | National | 100.0% | 2.8%(+97.2)#1 | 3.1%(+96.9)#14 |
| 15. | Fancy Gap | 100.0% | 2.9%(+97.1)#2 | 3.1%(+96.9)#15 |
| 16. | Needham | 100.0% | 3.5%(+96.5)#2 | 3.1%(+96.9)#16 |
| 17. | Lorenzo | 100.0% | 3.5%(+96.5)#1 | 3.1%(+96.9)#17 |
| 18. | Raleigh | 100.0% | 4.2%(+95.8)#1 | 3.1%(+96.9)#18 |
| 19. | Nash | 100.0% | 4.2%(+95.8)#2 | 3.1%(+96.9)#19 |
| 20. | Banks | 100.0% | 3.5%(+96.5)#1 | 3.1%(+96.9)#20 |
| 21. | Ratliff City | 84.3% | 4.2%(+80.1)#3 | 3.1%(+81.2)#21 |
| 22. | Wilder | 81.8% | 2.9%(+78.9)#1 | 3.1%(+78.8)#22 |
| 23. | Challenge Brownsville | 78.5% | 2.6%(+76.0)#2 | 3.1%(+75.5)#23 |
| 24. | Toston | 77.1% | 3.5%(+73.6)#1 | 3.1%(+74.1)#24 |
| 25. | Hanover | 76.5% | 3.7%(+72.8)#4 | 3.1%(+73.4)#25 |
| 26. | Barboursville | 76.3% | 2.9%(+73.4)#3 | 3.1%(+73.2)#26 |
| 27. | Pembine | 74.6% | 3.3%(+71.2)#1 | 3.1%(+71.5)#27 |
| 28. | Panola | 72.7% | 4.2%(+68.6)#4 | 3.1%(+69.7)#28 |
| 29. | Bristol | 72.4% | 3.4%(+69.0)#2 | 3.1%(+69.3)#29 |
| 30. | Randolph | 70.6% | 4.3%(+66.3)#1 | 3.1%(+67.5)#30 |
| 31. | Rains | 67.1% | 3.8%(+63.3)#2 | 3.1%(+64.0)#31 |
| 32. | Pleasanton | 66.7% | 3.7%(+63.0)#5 | 3.1%(+63.6)#32 |
| 33. | Gowen | 66.7% | 4.2%(+62.5)#5 | 3.1%(+63.6)#33 |
| 34. | Heeney | 66.7% | 2.8%(+63.8)#1 | 3.1%(+63.6)#34 |
| 35. | Fisherville | 66.7% | 3.1%(+63.6)#1 | 3.1%(+63.6)#35 |
| 36. | Speed | 63.2% | 3.6%(+59.5)#1 | 3.1%(+60.1)#36 |
| 37. | Henderson Point | 62.5% | 4.3%(+58.2)#2 | 3.1%(+59.4)#37 |
| 38. | Jugtown | 62.5% | 3.1%(+59.4)#2 | 3.1%(+59.4)#38 |
| 39. | Bartlett | 62.3% | 3.2%(+59.1)#1 | 3.1%(+59.2)#39 |
| 40. | Nixon | 62.2% | 3.3%(+58.9)#1 | 3.1%(+59.1)#40 |
| 41. | Port Penn | 60.9% | 3.4%(+57.4)#1 | 3.1%(+57.8)#41 |
| 42. | Irvington | 60.6% | 3.5%(+57.1)#1 | 3.1%(+57.5)#42 |
| 43. | Matheson | 60.0% | 2.8%(+57.2)#2 | 3.1%(+56.9)#43 |
| 44. | Atomic City | 60.0% | 3.5%(+56.5)#2 | 3.1%(+56.9)#44 |
| 45. | Danville | 59.7% | 2.8%(+56.9)#2 | 3.1%(+56.7)#45 |
| 46. | Guion | 59.3% | 3.8%(+55.5)#2 | 3.1%(+56.2)#46 |
| 47. | El Combate | 59.0% | 3.6%(+55.3)#1 | 3.1%(+55.9)#47 |
| 48. | Lacassine | 58.8% | 3.7%(+55.1)#2 | 3.1%(+55.7)#48 |
| 49. | Placedo | 58.6% | 3.4%(+55.2)#1 | 3.1%(+55.6)#49 |
| 50. | Piney Grove | 57.6% | 3.4%(+54.2)#3 | 3.1%(+54.5)#50 |
| 51. | Southampton Meadows | 57.4% | 2.9%(+54.5)#4 | 3.1%(+54.4)#51 |
| 52. | Oakley | 56.5% | 5.0%(+51.4)#1 | 3.1%(+53.4)#52 |
| 53. | Trimountain | 56.2% | 3.1%(+53.2)#1 | 3.1%(+53.2)#53 |
| 54. | Ali Chukson | 56.0% | 3.3%(+52.7)#1 | 3.1%(+52.9)#54 |
| 55. | Tula | 55.8% | 4.3%(+51.5)#3 | 3.1%(+52.7)#55 |
| 56. | Summerhaven | 55.6% | 3.3%(+52.3)#2 | 3.1%(+52.5)#56 |
| 57. | Andres | 54.5% | 2.7%(+51.8)#1 | 3.1%(+51.5)#58 |
| 58. | Newbury | 54.5% | 3.6%(+50.9)#2 | 3.1%(+51.5)#59 |
| 59. | Poole | 54.5% | 3.5%(+51.1)#2 | 3.1%(+51.5)#60 |
| 60. | Rohrersville | 53.8% | 2.8%(+51.1)#3 | 3.1%(+50.8)#61 |
| 61. | Elk Mountain | 53.8% | 5.0%(+48.8)#2 | 3.1%(+50.8)#62 |
| 62. | Bringhurst | 52.6% | 3.5%(+49.1)#3 | 3.1%(+49.6)#63 |
| 63. | New Wells | 52.4% | 3.2%(+49.2)#2 | 3.1%(+49.3)#64 |
| 64. | Acme | 52.2% | 2.9%(+49.3)#1 | 3.1%(+49.1)#65 |
| 65. | Encino | 52.0% | 3.7%(+48.3)#6 | 3.1%(+48.9)#66 |
| 66. | Woodland | 51.7% | 2.8%(+48.9)#4 | 3.1%(+48.7)#67 |
| 67. | La Clede | 51.5% | 2.7%(+48.8)#2 | 3.1%(+48.4)#68 |
| 68. | Hessville | 51.2% | 3.1%(+48.2)#1 | 3.1%(+48.2)#69 |
| 69. | Violet Hill | 50.9% | 3.8%(+47.1)#3 | 3.1%(+47.9)#70 |
| 70. | Barneveld | 50.8% | 2.3%(+48.5)#1 | 3.1%(+47.8)#71 |
| 71. | Green Hill | 50.6% | 3.5%(+47.1)#4 | 3.1%(+47.6)#72 |
| 72. | Puerto De Luna | 50.0% | 3.7%(+46.3)#7 | 3.1%(+46.9)#73 |
| 73. | Gattman | 50.0% | 4.3%(+45.7)#4 | 3.1%(+46.9)#74 |
| 74. | Mckinnon | 50.0% | 5.0%(+45.0)#3 | 3.1%(+46.9)#75 |
| 75. | Greenbackville | 50.0% | 2.9%(+47.1)#5 | 3.1%(+46.9)#76 |
| 76. | Danville | 50.0% | 3.6%(+46.4)#3 | 3.1%(+46.9)#77 |
| 77. | Seven Springs | 50.0% | 3.4%(+46.6)#1 | 3.1%(+46.9)#78 |
| 78. | Mildred | 50.0% | 3.6%(+46.4)#4 | 3.1%(+46.9)#79 |
| 79. | Tamora | 50.0% | 3.5%(+46.5)#3 | 3.1%(+46.9)#80 |
| 80. | Vann Crossroads | 49.5% | 3.4%(+46.1)#2 | 3.1%(+46.5)#81 |
| 81. | Wellton Hills | 49.4% | 3.3%(+46.2)#3 | 3.1%(+46.4)#82 |
| 82. | Rhine | 49.4% | 3.4%(+46.0)#4 | 3.1%(+46.3)#83 |
| 83. | Gramling | 49.2% | 3.8%(+45.4)#3 | 3.1%(+46.1)#84 |
| 84. | Chelan Falls | 49.2% | 2.9%(+46.3)#2 | 3.1%(+46.1)#85 |
| 85. | Ross | 49.0% | 4.2%(+44.8)#3 | 3.1%(+46.0)#86 |
| 86. | West Amana | 48.8% | 3.5%(+45.4)#2 | 3.1%(+45.8)#87 |
| 87. | Little Cedar | 48.7% | 3.5%(+45.3)#3 | 3.1%(+45.7)#88 |
| 88. | Tampico | 48.1% | 2.9%(+45.2)#3 | 3.1%(+45.0)#89 |
| 89. | Richards | 47.8% | 3.2%(+44.6)#3 | 3.1%(+44.8)#90 |
| 90. | Mayhill | 47.8% | 3.7%(+44.1)#8 | 3.1%(+44.8)#91 |
| 91. | Midway | 47.8% | 3.7%(+44.1)#3 | 3.1%(+44.7)#92 |
| 92. | Catlett | 47.7% | 2.9%(+44.8)#6 | 3.1%(+44.6)#93 |
| 93. | Yeehaw Junction | 47.4% | 3.3%(+44.1)#1 | 3.1%(+44.4)#94 |
| 94. | Charles City | 47.4% | 2.9%(+44.5)#7 | 3.1%(+44.3)#95 |
| 95. | Midland | 47.3% | 3.5%(+43.8)#5 | 3.1%(+44.2)#96 |
| 96. | Snake Creek | 46.9% | 4.2%(+42.8)#6 | 3.1%(+43.9)#97 |
| 97. | Abington | 46.9% | 3.5%(+43.3)#6 | 3.1%(+43.8)#98 |
| 98. | Humphreys | 46.7% | 3.2%(+43.5)#4 | 3.1%(+43.6)#99 |
| 99. | Brookston | 46.2% | 3.4%(+42.8)#2 | 3.1%(+43.1)#100 |
| 100. | Winn | 45.9% | 3.1%(+42.8)#2 | 3.1%(+42.8)#101 |
Common Questions
What are the Top 10 Cities with the Highest Percentage of Population Employed in Installation, Maintenance & Repair in the United States?
Top 10 Cities with the Highest Percentage of Population Employed in Installation, Maintenance & Repair in the United States are:
What city has the Highest Percentage of Population Employed in Installation, Maintenance & Repair in the United States?
Russellville has the Highest Percentage of Population Employed in Installation, Maintenance & Repair in the United States with 100.0%.
What is the Percentage of Population Employed in Installation, Maintenance & Repair in the United States?
Percentage of Population Employed in Installation, Maintenance & Repair in the United States is 3.1%.