Cities with the Highest Percentage of Renter-Occupied Units in California
RELATED REPORTS & OPTIONS
Highest Renter-Occupied
California
Compare Cities
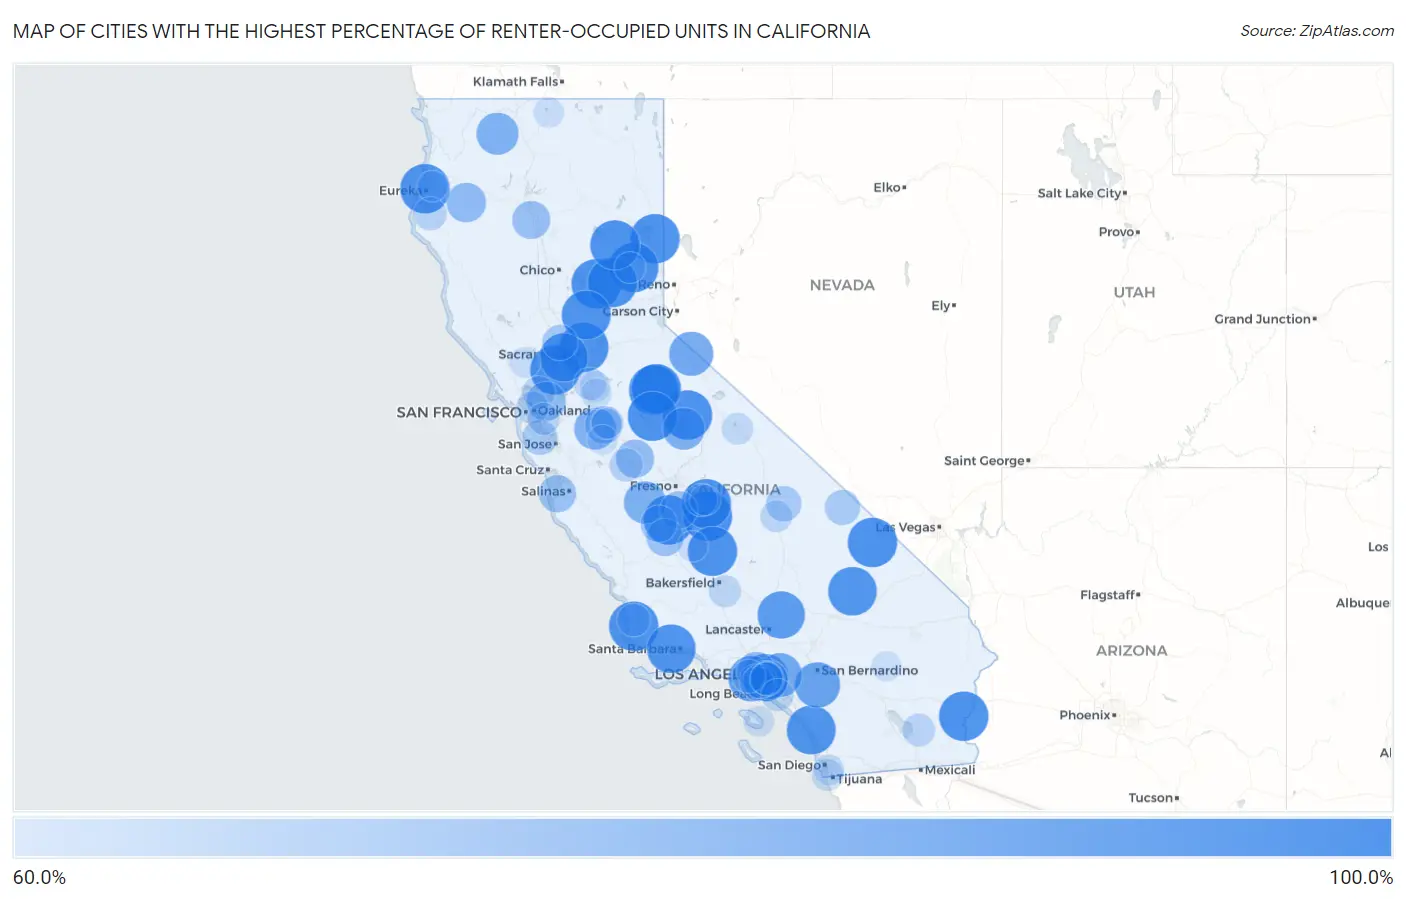
Map of Cities with the Highest Percentage of Renter-Occupied Units in California
0.0%
100.0%
Cities with the Highest Percentage of Renter-Occupied Units in California
| City | % Renter-Occupied | vs State | vs National | |
| 1. | Camp Pendleton Mainside | 100.0% | 44.4%(+55.6)#1 | 35.2%(+64.8)#3 |
| 2. | Lemoore Station | 100.0% | 44.4%(+55.6)#2 | 35.2%(+64.8)#8 |
| 3. | Vandenberg Afb | 100.0% | 44.4%(+55.6)#3 | 35.2%(+64.8)#20 |
| 4. | Yosemite Valley | 100.0% | 44.4%(+55.6)#4 | 35.2%(+64.8)#45 |
| 5. | Herlong | 100.0% | 44.4%(+55.6)#5 | 35.2%(+64.8)#53 |
| 6. | Mcclellan Park | 100.0% | 44.4%(+55.6)#6 | 35.2%(+64.8)#56 |
| 7. | Linnell Camp | 100.0% | 44.4%(+55.6)#7 | 35.2%(+64.8)#62 |
| 8. | El Centro Naval Air Facility | 100.0% | 44.4%(+55.6)#8 | 35.2%(+64.8)#68 |
| 9. | Woodville Farm Labor Camp | 100.0% | 44.4%(+55.6)#9 | 35.2%(+64.8)#74 |
| 10. | Clipper Mills | 100.0% | 44.4%(+55.6)#10 | 35.2%(+64.8)#76 |
| 11. | Samoa | 100.0% | 44.4%(+55.6)#11 | 35.2%(+64.8)#86 |
| 12. | Elmira | 100.0% | 44.4%(+55.6)#12 | 35.2%(+64.8)#100 |
| 13. | El Monte Mobile | 100.0% | 44.4%(+55.6)#13 | 35.2%(+64.8)#110 |
| 14. | Yettem | 100.0% | 44.4%(+55.6)#14 | 35.2%(+64.8)#114 |
| 15. | Gold Mountain | 100.0% | 44.4%(+55.6)#15 | 35.2%(+64.8)#120 |
| 16. | Sierra Village | 100.0% | 44.4%(+55.6)#16 | 35.2%(+64.8)#123 |
| 17. | Palo Verde | 100.0% | 44.4%(+55.6)#17 | 35.2%(+64.8)#128 |
| 18. | Goodyears Bar | 100.0% | 44.4%(+55.6)#18 | 35.2%(+64.8)#146 |
| 19. | Rodriguez Camp | 100.0% | 44.4%(+55.6)#19 | 35.2%(+64.8)#156 |
| 20. | Long Barn | 100.0% | 44.4%(+55.6)#20 | 35.2%(+64.8)#166 |
| 21. | Taylorsville | 100.0% | 44.4%(+55.6)#21 | 35.2%(+64.8)#177 |
| 22. | Coulterville | 100.0% | 44.4%(+55.6)#24 | 35.2%(+64.8)#181 |
| 23. | Platina | 100.0% | 44.4%(+55.6)#25 | 35.2%(+64.8)#182 |
| 24. | Franklin Cdp Sacramento County | 100.0% | 44.4%(+55.6)#26 | 35.2%(+64.8)#183 |
| 25. | Shoshone | 100.0% | 44.4%(+55.6)#27 | 35.2%(+64.8)#187 |
| 26. | Beale Afb | 99.2% | 44.4%(+54.8)#28 | 35.2%(+64.0)#249 |
| 27. | Camp Pendleton South | 98.9% | 44.4%(+54.6)#29 | 35.2%(+63.8)#255 |
| 28. | Isla Vista | 98.6% | 44.4%(+54.2)#30 | 35.2%(+63.4)#262 |
| 29. | Fort Irwin | 98.5% | 44.4%(+54.2)#31 | 35.2%(+63.3)#265 |
| 30. | University Of California Davis | 98.0% | 44.4%(+53.6)#32 | 35.2%(+62.8)#271 |
| 31. | Petaluma Center | 97.5% | 44.4%(+53.1)#33 | 35.2%(+62.3)#275 |
| 32. | Edwards Afb | 96.1% | 44.4%(+51.8)#34 | 35.2%(+60.9)#283 |
| 33. | Vernon | 95.6% | 44.4%(+51.2)#35 | 35.2%(+60.4)#287 |
| 34. | Marina Del Rey | 93.0% | 44.4%(+48.6)#36 | 35.2%(+57.8)#303 |
| 35. | March Arb | 92.6% | 44.4%(+48.2)#37 | 35.2%(+57.4)#307 |
| 36. | Coleville | 90.5% | 44.4%(+46.1)#38 | 35.2%(+55.3)#324 |
| 37. | Industry | 90.0% | 44.4%(+45.6)#39 | 35.2%(+54.8)#330 |
| 38. | Cudahy | 88.1% | 44.4%(+43.7)#40 | 35.2%(+52.9)#346 |
| 39. | Cantua Creek | 87.0% | 44.4%(+42.6)#41 | 35.2%(+51.8)#355 |
| 40. | Greenview | 86.7% | 44.4%(+42.3)#42 | 35.2%(+51.5)#356 |
| 41. | Wawona | 86.5% | 44.4%(+42.1)#43 | 35.2%(+51.3)#357 |
| 42. | Westley | 86.0% | 44.4%(+41.6)#44 | 35.2%(+50.8)#360 |
| 43. | Pumpkin Center | 85.8% | 44.4%(+41.5)#45 | 35.2%(+50.6)#361 |
| 44. | University Of California-Santa Barbara | 82.9% | 44.4%(+38.5)#46 | 35.2%(+47.7)#397 |
| 45. | Hyampom | 82.1% | 44.4%(+37.7)#47 | 35.2%(+46.9)#408 |
| 46. | Contra Costa Centre | 81.6% | 44.4%(+37.2)#48 | 35.2%(+46.4)#415 |
| 47. | West Hollywood | 80.7% | 44.4%(+36.3)#49 | 35.2%(+45.5)#429 |
| 48. | Bell Gardens | 80.4% | 44.4%(+36.1)#50 | 35.2%(+45.2)#435 |
| 49. | East Bakersfield | 80.2% | 44.4%(+35.8)#51 | 35.2%(+45.0)#440 |
| 50. | El Nido | 80.0% | 44.4%(+35.6)#52 | 35.2%(+44.8)#443 |
| 51. | Cottonwood | 79.6% | 44.4%(+35.3)#53 | 35.2%(+44.4)#455 |
| 52. | Riverdale Park | 78.7% | 44.4%(+34.4)#54 | 35.2%(+43.6)#469 |
| 53. | Hardwick | 78.7% | 44.4%(+34.4)#55 | 35.2%(+43.5)#471 |
| 54. | Sand City | 78.5% | 44.4%(+34.1)#56 | 35.2%(+43.3)#476 |
| 55. | Kettleman City | 78.4% | 44.4%(+34.1)#57 | 35.2%(+43.3)#477 |
| 56. | Huron | 77.5% | 44.4%(+33.2)#58 | 35.2%(+42.4)#493 |
| 57. | Huntington Park | 75.7% | 44.4%(+31.4)#59 | 35.2%(+40.5)#528 |
| 58. | Strawberry Cdp Tuolumne County | 75.4% | 44.4%(+31.0)#60 | 35.2%(+40.2)#536 |
| 59. | Yolo | 75.3% | 44.4%(+30.9)#61 | 35.2%(+40.1)#539 |
| 60. | Keeler | 75.0% | 44.4%(+30.6)#62 | 35.2%(+39.8)#549 |
| 61. | Furnace Creek | 74.7% | 44.4%(+30.3)#63 | 35.2%(+39.5)#556 |
| 62. | Stanford | 74.4% | 44.4%(+30.0)#64 | 35.2%(+39.2)#564 |
| 63. | Lennox | 72.7% | 44.4%(+28.4)#65 | 35.2%(+37.5)#605 |
| 64. | Hawthorne | 72.2% | 44.4%(+27.9)#66 | 35.2%(+37.1)#624 |
| 65. | Westmont | 72.1% | 44.4%(+27.7)#67 | 35.2%(+36.9)#630 |
| 66. | Bell | 72.0% | 44.4%(+27.6)#68 | 35.2%(+36.8)#636 |
| 67. | Scotia | 71.4% | 44.4%(+27.1)#69 | 35.2%(+36.2)#648 |
| 68. | Dos Palos Y | 71.4% | 44.4%(+27.1)#70 | 35.2%(+36.2)#652 |
| 69. | Santa Monica | 71.1% | 44.4%(+26.7)#71 | 35.2%(+35.9)#669 |
| 70. | Port Costa | 70.8% | 44.4%(+26.4)#72 | 35.2%(+35.6)#678 |
| 71. | Casmalia | 70.6% | 44.4%(+26.2)#73 | 35.2%(+35.4)#684 |
| 72. | Jovista | 70.6% | 44.4%(+26.2)#74 | 35.2%(+35.4)#685 |
| 73. | Niland | 70.4% | 44.4%(+26.0)#75 | 35.2%(+35.2)#693 |
| 74. | Maywood | 69.8% | 44.4%(+25.5)#76 | 35.2%(+34.6)#716 |
| 75. | Midway City | 69.8% | 44.4%(+25.5)#77 | 35.2%(+34.6)#717 |
| 76. | Emeryville | 69.8% | 44.4%(+25.4)#78 | 35.2%(+34.6)#719 |
| 77. | Acampo | 69.7% | 44.4%(+25.3)#79 | 35.2%(+34.5)#726 |
| 78. | Sultana | 69.4% | 44.4%(+25.1)#80 | 35.2%(+34.3)#736 |
| 79. | Potomac Park | 69.4% | 44.4%(+25.0)#81 | 35.2%(+34.2)#738 |
| 80. | Di Giorgio | 69.3% | 44.4%(+24.9)#82 | 35.2%(+34.1)#740 |
| 81. | Weedpatch | 69.3% | 44.4%(+24.9)#83 | 35.2%(+34.1)#743 |
| 82. | Cherryland | 69.3% | 44.4%(+24.9)#84 | 35.2%(+34.1)#744 |
| 83. | Cartago | 69.2% | 44.4%(+24.9)#85 | 35.2%(+34.0)#751 |
| 84. | Imperial Beach | 69.0% | 44.4%(+24.7)#86 | 35.2%(+33.8)#761 |
| 85. | Airport | 69.0% | 44.4%(+24.6)#87 | 35.2%(+33.8)#766 |
| 86. | Aspen Springs | 68.7% | 44.4%(+24.3)#88 | 35.2%(+33.5)#777 |
| 87. | Avalon | 67.4% | 44.4%(+23.1)#89 | 35.2%(+32.3)#821 |
| 88. | Clio | 67.3% | 44.4%(+22.9)#90 | 35.2%(+32.1)#832 |
| 89. | Rutherford | 67.3% | 44.4%(+22.9)#91 | 35.2%(+32.1)#833 |
| 90. | Johnson Park | 67.3% | 44.4%(+22.9)#92 | 35.2%(+32.1)#834 |
| 91. | National City | 67.2% | 44.4%(+22.8)#93 | 35.2%(+32.0)#837 |
| 92. | Victor | 67.1% | 44.4%(+22.7)#94 | 35.2%(+31.9)#843 |
| 93. | Waterloo | 67.0% | 44.4%(+22.6)#95 | 35.2%(+31.8)#851 |
| 94. | Rouse | 67.0% | 44.4%(+22.6)#96 | 35.2%(+31.8)#852 |
| 95. | Alpaugh | 66.8% | 44.4%(+22.5)#97 | 35.2%(+31.7)#856 |
| 96. | Arcata | 66.8% | 44.4%(+22.4)#98 | 35.2%(+31.6)#859 |
| 97. | East Orosi | 66.7% | 44.4%(+22.3)#99 | 35.2%(+31.5)#865 |
| 98. | Macdoel | 66.7% | 44.4%(+22.3)#100 | 35.2%(+31.5)#870 |
| 99. | Twentynine Palms | 66.1% | 44.4%(+21.8)#101 | 35.2%(+31.0)#895 |
| 100. | Crows Landing | 66.1% | 44.4%(+21.7)#102 | 35.2%(+30.9)#896 |
Common Questions
What are the Top 10 Cities with the Highest Percentage of Renter-Occupied Units in California?
Top 10 Cities with the Highest Percentage of Renter-Occupied Units in California are:
#1
100.0%
#2
100.0%
#3
100.0%
#4
100.0%
#5
100.0%
#6
100.0%
#7
100.0%
#8
100.0%
#9
100.0%
#10
100.0%
What city has the Highest Percentage of Renter-Occupied Units in California?
Lemoore Station has the Highest Percentage of Renter-Occupied Units in California with 100.0%.
What is the Percentage of Renter-Occupied Units in the State of California?
Percentage of Renter-Occupied Units in California is 44.4%.
What is the Percentage of Renter-Occupied Units in the United States?
Percentage of Renter-Occupied Units in the United States is 35.2%.