Cities with the Highest Percentage of Immigrants from Southern Europe in California
RELATED REPORTS & OPTIONS
Southern Europe
California
Compare Cities
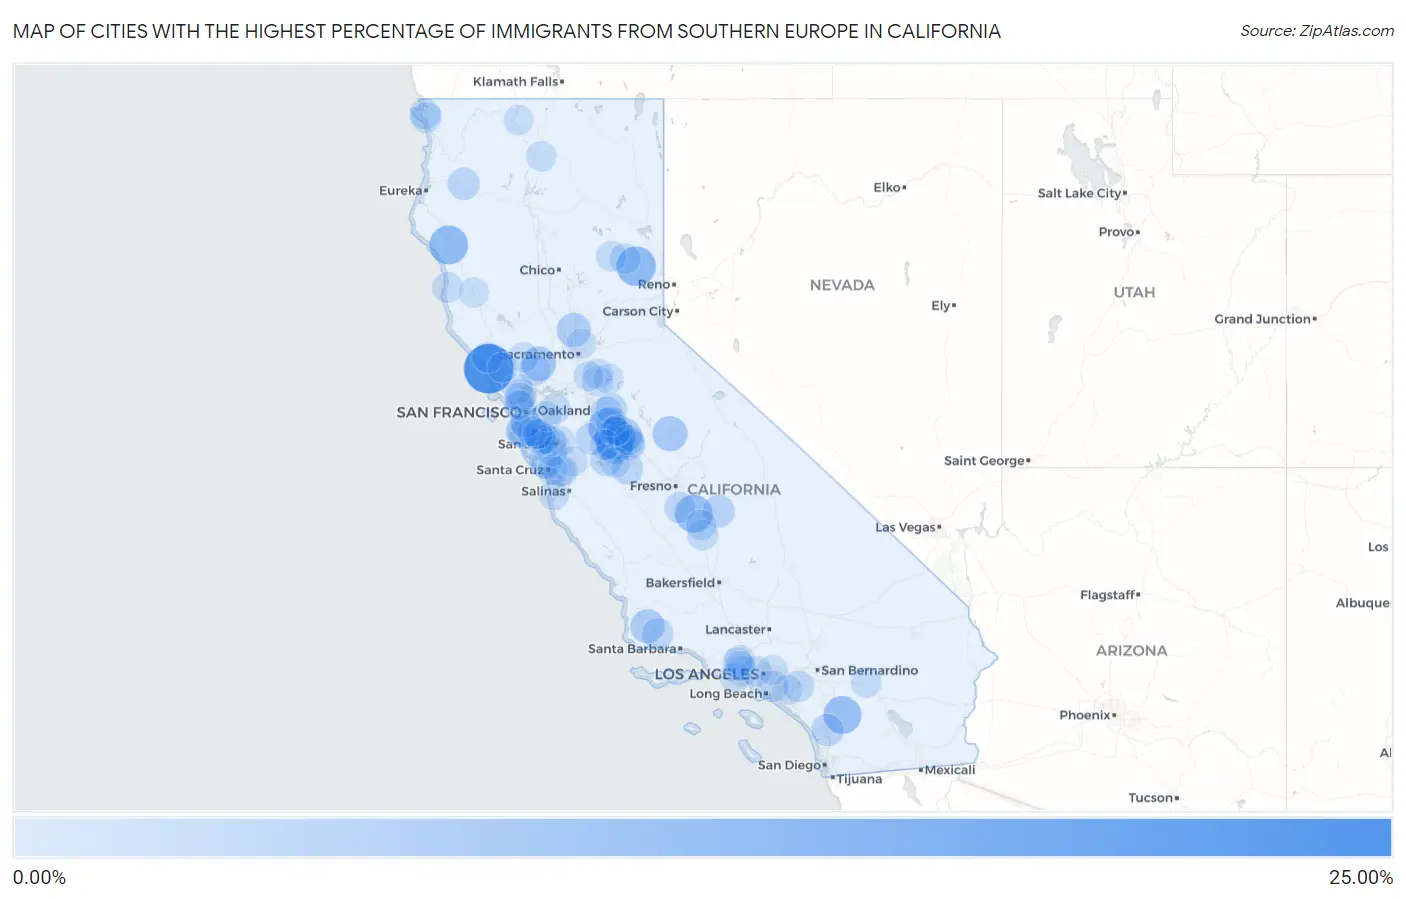
Map of Cities with the Highest Percentage of Immigrants from Southern Europe in California
0.00%
25.00%
Cities with the Highest Percentage of Immigrants from Southern Europe in California
| City | Southern Europe | vs State | vs National | |
| 1. | Carmet | 25.00% | 0.22%(+24.8)#1 | 0.22%(+24.8)#3 |
| 2. | Hilmar Irwin | 13.68% | 0.22%(+13.5)#2 | 0.22%(+13.5)#9 |
| 3. | Iron Horse | 11.96% | 0.22%(+11.7)#3 | 0.22%(+11.7)#12 |
| 4. | Benbow | 11.11% | 0.22%(+10.9)#4 | 0.22%(+10.9)#16 |
| 5. | Cowan | 11.03% | 0.22%(+10.8)#5 | 0.22%(+10.8)#17 |
| 6. | West Goshen | 9.96% | 0.22%(+9.75)#6 | 0.22%(+9.74)#21 |
| 7. | Aguanga | 9.95% | 0.22%(+9.73)#7 | 0.22%(+9.73)#22 |
| 8. | Stevinson | 9.09% | 0.22%(+8.87)#8 | 0.22%(+8.87)#27 |
| 9. | Ballico | 6.73% | 0.22%(+6.51)#9 | 0.22%(+6.51)#47 |
| 10. | Bootjack | 6.53% | 0.22%(+6.31)#10 | 0.22%(+6.31)#51 |
| 11. | Moskowite Corner | 6.16% | 0.22%(+5.95)#11 | 0.22%(+5.94)#55 |
| 12. | Los Alamos | 5.64% | 0.22%(+5.42)#12 | 0.22%(+5.42)#61 |
| 13. | Nicolaus | 5.60% | 0.22%(+5.38)#13 | 0.22%(+5.38)#63 |
| 14. | Woody | 4.17% | 0.22%(+3.95)#14 | 0.22%(+3.95)#88 |
| 15. | Lemon Cove | 3.41% | 0.22%(+3.20)#15 | 0.22%(+3.19)#117 |
| 16. | Hidden Meadows | 3.27% | 0.22%(+3.06)#16 | 0.22%(+3.05)#126 |
| 17. | Yermo | 3.16% | 0.22%(+2.94)#17 | 0.22%(+2.94)#137 |
| 18. | Trinity Village | 3.10% | 0.22%(+2.89)#18 | 0.22%(+2.88)#144 |
| 19. | Diablo Grande | 2.86% | 0.22%(+2.65)#19 | 0.22%(+2.64)#166 |
| 20. | Santa Nella | 2.73% | 0.22%(+2.51)#20 | 0.22%(+2.51)#180 |
| 21. | Escalon | 2.71% | 0.22%(+2.49)#21 | 0.22%(+2.49)#181 |
| 22. | Artesia | 2.54% | 0.22%(+2.32)#22 | 0.22%(+2.32)#203 |
| 23. | Ballard | 2.50% | 0.22%(+2.28)#23 | 0.22%(+2.28)#206 |
| 24. | Valley Home | 2.44% | 0.22%(+2.22)#24 | 0.22%(+2.22)#218 |
| 25. | Dos Palos | 2.38% | 0.22%(+2.16)#25 | 0.22%(+2.16)#222 |
| 26. | El Granada | 2.35% | 0.22%(+2.14)#26 | 0.22%(+2.13)#226 |
| 27. | Franklin Cdp Merced County | 2.26% | 0.22%(+2.04)#27 | 0.22%(+2.04)#244 |
| 28. | Santa Venetia | 2.25% | 0.22%(+2.03)#28 | 0.22%(+2.03)#245 |
| 29. | Laton | 2.15% | 0.22%(+1.94)#29 | 0.22%(+1.93)#260 |
| 30. | Silverado Resort | 1.98% | 0.22%(+1.76)#30 | 0.22%(+1.76)#285 |
| 31. | Coronita | 1.89% | 0.22%(+1.67)#31 | 0.22%(+1.67)#312 |
| 32. | Crescent City | 1.82% | 0.22%(+1.60)#32 | 0.22%(+1.60)#329 |
| 33. | Ben Lomond | 1.81% | 0.22%(+1.59)#33 | 0.22%(+1.59)#334 |
| 34. | La Honda | 1.76% | 0.22%(+1.54)#34 | 0.22%(+1.54)#352 |
| 35. | Aptos Hills Larkin Valley | 1.72% | 0.22%(+1.50)#35 | 0.22%(+1.50)#362 |
| 36. | Tipton | 1.67% | 0.22%(+1.46)#36 | 0.22%(+1.45)#376 |
| 37. | Cazadero | 1.67% | 0.22%(+1.45)#37 | 0.22%(+1.45)#378 |
| 38. | Cromberg | 1.50% | 0.22%(+1.28)#38 | 0.22%(+1.28)#436 |
| 39. | Bertsch Oceanview | 1.49% | 0.22%(+1.27)#39 | 0.22%(+1.27)#442 |
| 40. | Sausalito | 1.44% | 0.22%(+1.22)#40 | 0.22%(+1.22)#454 |
| 41. | Cleone | 1.42% | 0.22%(+1.20)#41 | 0.22%(+1.20)#463 |
| 42. | Moss Beach | 1.39% | 0.22%(+1.17)#42 | 0.22%(+1.17)#481 |
| 43. | Tulare | 1.36% | 0.22%(+1.14)#43 | 0.22%(+1.14)#500 |
| 44. | Delhi | 1.35% | 0.22%(+1.13)#44 | 0.22%(+1.13)#505 |
| 45. | Watsonville | 1.28% | 0.22%(+1.06)#45 | 0.22%(+1.06)#551 |
| 46. | Stanford | 1.26% | 0.22%(+1.05)#46 | 0.22%(+1.04)#558 |
| 47. | Desert Edge | 1.24% | 0.22%(+1.02)#47 | 0.22%(+1.02)#571 |
| 48. | Mcswain | 1.21% | 0.22%(+0.993)#48 | 0.22%(+0.990)#593 |
| 49. | Blackhawk | 1.18% | 0.22%(+0.960)#49 | 0.22%(+0.957)#615 |
| 50. | Topanga | 1.17% | 0.22%(+0.954)#50 | 0.22%(+0.950)#621 |
| 51. | East Quincy | 1.17% | 0.22%(+0.951)#51 | 0.22%(+0.947)#624 |
| 52. | Burbank | 1.15% | 0.22%(+0.930)#52 | 0.22%(+0.926)#637 |
| 53. | Green Valley Cdp Solano County | 1.13% | 0.22%(+0.918)#53 | 0.22%(+0.915)#653 |
| 54. | Millbrae | 1.13% | 0.22%(+0.918)#54 | 0.22%(+0.915)#654 |
| 55. | El Centro Naval Air Facility | 1.11% | 0.22%(+0.897)#55 | 0.22%(+0.893)#672 |
| 56. | Mount Hermon | 1.11% | 0.22%(+0.891)#56 | 0.22%(+0.887)#678 |
| 57. | Dogtown | 1.10% | 0.22%(+0.882)#57 | 0.22%(+0.879)#685 |
| 58. | West Hollywood | 1.09% | 0.22%(+0.870)#58 | 0.22%(+0.866)#694 |
| 59. | Atwater | 1.08% | 0.22%(+0.861)#59 | 0.22%(+0.857)#705 |
| 60. | Denair | 1.07% | 0.22%(+0.856)#60 | 0.22%(+0.852)#711 |
| 61. | Atherton | 1.07% | 0.22%(+0.850)#61 | 0.22%(+0.847)#715 |
| 62. | Alum Rock | 1.05% | 0.22%(+0.832)#62 | 0.22%(+0.828)#730 |
| 63. | Los Banos | 1.05% | 0.22%(+0.830)#63 | 0.22%(+0.827)#731 |
| 64. | Mccloud | 1.04% | 0.22%(+0.826)#64 | 0.22%(+0.823)#740 |
| 65. | Malibu | 1.02% | 0.22%(+0.802)#65 | 0.22%(+0.799)#761 |
| 66. | San Martin | 1.00% | 0.22%(+0.785)#66 | 0.22%(+0.782)#778 |
| 67. | Empire | 0.99% | 0.22%(+0.777)#67 | 0.22%(+0.773)#786 |
| 68. | Menlo Park | 0.99% | 0.22%(+0.771)#68 | 0.22%(+0.767)#797 |
| 69. | Newman | 0.98% | 0.22%(+0.761)#69 | 0.22%(+0.758)#803 |
| 70. | Santa Susana | 0.97% | 0.22%(+0.755)#70 | 0.22%(+0.752)#810 |
| 71. | Casa Loma | 0.91% | 0.22%(+0.692)#71 | 0.22%(+0.688)#878 |
| 72. | Willits | 0.91% | 0.22%(+0.689)#72 | 0.22%(+0.686)#884 |
| 73. | Los Gatos | 0.90% | 0.22%(+0.684)#73 | 0.22%(+0.680)#891 |
| 74. | Clay | 0.89% | 0.22%(+0.676)#74 | 0.22%(+0.672)#897 |
| 75. | Novato | 0.88% | 0.22%(+0.668)#75 | 0.22%(+0.664)#906 |
| 76. | Pacific Grove | 0.85% | 0.22%(+0.638)#76 | 0.22%(+0.634)#928 |
| 77. | Bell Canyon | 0.85% | 0.22%(+0.632)#77 | 0.22%(+0.628)#932 |
| 78. | Villa Park | 0.84% | 0.22%(+0.626)#78 | 0.22%(+0.623)#942 |
| 79. | Capitola | 0.84% | 0.22%(+0.620)#79 | 0.22%(+0.617)#950 |
| 80. | Santa Clara | 0.82% | 0.22%(+0.607)#80 | 0.22%(+0.604)#961 |
| 81. | Bayview Cdp Humboldt County | 0.81% | 0.22%(+0.593)#81 | 0.22%(+0.589)#987 |
| 82. | Mountain View | 0.80% | 0.22%(+0.585)#82 | 0.22%(+0.581)#1,004 |
| 83. | Palo Alto | 0.79% | 0.22%(+0.576)#83 | 0.22%(+0.572)#1,016 |
| 84. | Half Moon Bay | 0.79% | 0.22%(+0.574)#84 | 0.22%(+0.571)#1,019 |
| 85. | San Bruno | 0.78% | 0.22%(+0.566)#85 | 0.22%(+0.562)#1,031 |
| 86. | St Helena | 0.77% | 0.22%(+0.558)#86 | 0.22%(+0.554)#1,043 |
| 87. | Turlock | 0.75% | 0.22%(+0.532)#87 | 0.22%(+0.529)#1,069 |
| 88. | Sebastopol | 0.75% | 0.22%(+0.530)#88 | 0.22%(+0.526)#1,074 |
| 89. | Elverta | 0.74% | 0.22%(+0.528)#89 | 0.22%(+0.525)#1,078 |
| 90. | Montague | 0.74% | 0.22%(+0.525)#90 | 0.22%(+0.521)#1,085 |
| 91. | East San Gabriel | 0.73% | 0.22%(+0.512)#91 | 0.22%(+0.508)#1,118 |
| 92. | Camanche North Shore | 0.72% | 0.22%(+0.507)#92 | 0.22%(+0.503)#1,130 |
| 93. | Hidden Hills | 0.71% | 0.22%(+0.495)#93 | 0.22%(+0.492)#1,151 |
| 94. | Castro Valley | 0.71% | 0.22%(+0.494)#94 | 0.22%(+0.490)#1,158 |
| 95. | Galt | 0.71% | 0.22%(+0.494)#95 | 0.22%(+0.490)#1,161 |
| 96. | North Fair Oaks | 0.71% | 0.22%(+0.491)#96 | 0.22%(+0.487)#1,171 |
| 97. | Belmont | 0.70% | 0.22%(+0.484)#97 | 0.22%(+0.481)#1,187 |
| 98. | Winton | 0.70% | 0.22%(+0.484)#98 | 0.22%(+0.481)#1,188 |
| 99. | Tamalpais Homestead Valley | 0.68% | 0.22%(+0.464)#99 | 0.22%(+0.460)#1,221 |
| 100. | San Rafael | 0.68% | 0.22%(+0.460)#100 | 0.22%(+0.457)#1,236 |
Common Questions
What are the Top 10 Cities with the Highest Percentage of Immigrants from Southern Europe in California?
Top 10 Cities with the Highest Percentage of Immigrants from Southern Europe in California are:
#1
25.00%
#2
13.68%
#3
11.96%
#4
11.11%
#5
11.03%
#6
9.96%
#7
9.95%
#8
9.09%
#9
6.73%
#10
6.53%
What city has the Highest Percentage of Immigrants from Southern Europe in California?
Carmet has the Highest Percentage of Immigrants from Southern Europe in California with 25.00%.
What is the Percentage of Immigrants from Southern Europe in the State of California?
Percentage of Immigrants from Southern Europe in California is 0.22%.
What is the Percentage of Immigrants from Southern Europe in the United States?
Percentage of Immigrants from Southern Europe in the United States is 0.22%.