Cities with the Most Immigrants from Dominican Republic in California
RELATED REPORTS & OPTIONS
Dominican Republic
California
Compare Cities
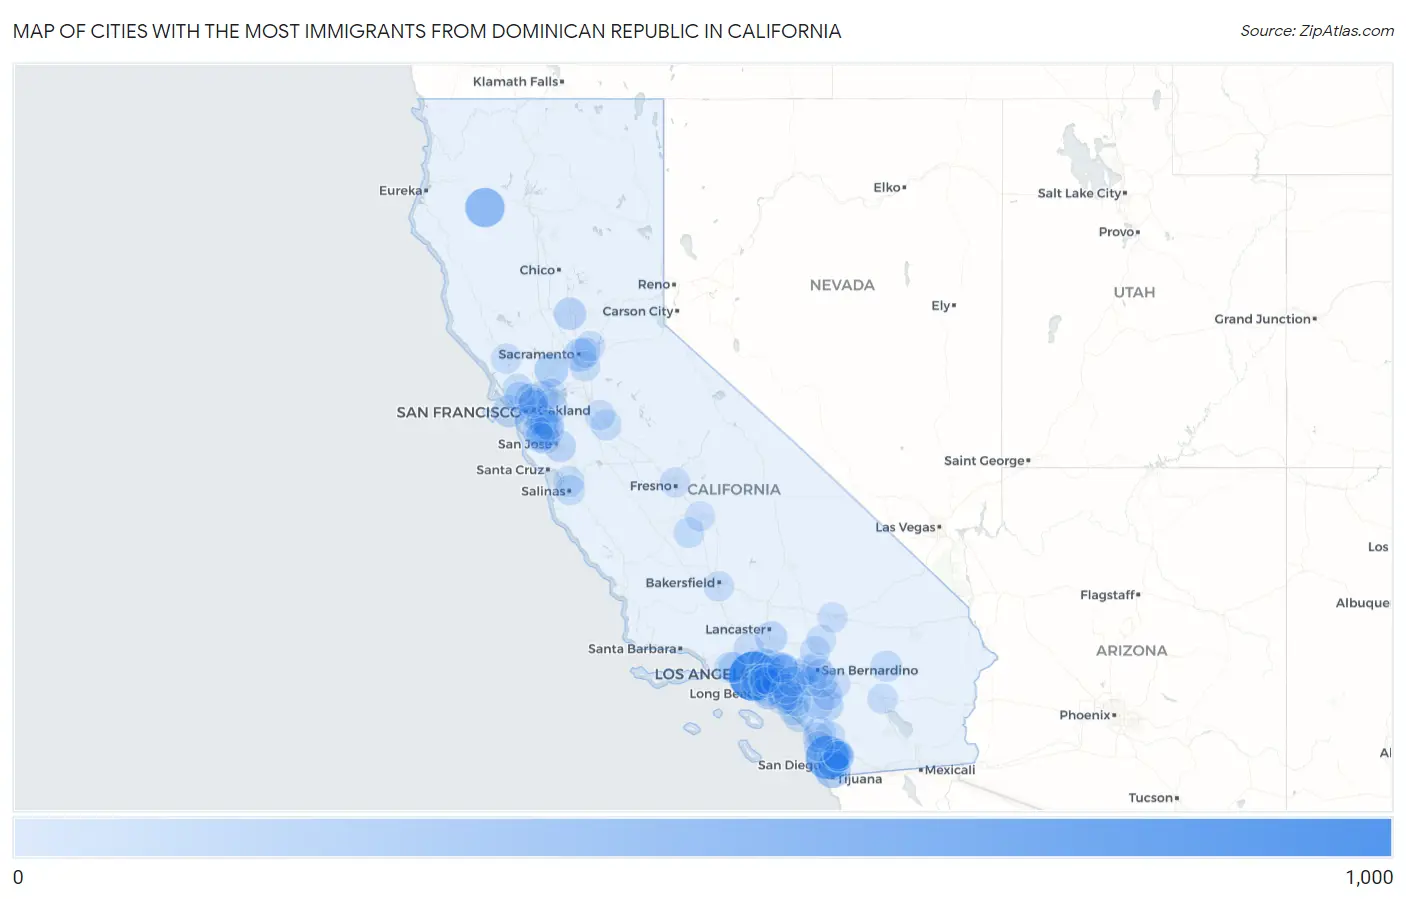
Map of Cities with the Most Immigrants from Dominican Republic in California
0
1,000
Cities with the Most Immigrants from Dominican Republic in California
| City | Dominican Republic | vs State | vs National | |
| 1. | Los Angeles | 897 | 7,168(12.51%)#1 | 1,223,316(0.07%)#121 |
| 2. | San Diego | 606 | 7,168(8.45%)#2 | 1,223,316(0.05%)#177 |
| 3. | Hayfork | 421 | 7,168(5.87%)#3 | 1,223,316(0.03%)#250 |
| 4. | Chula Vista | 273 | 7,168(3.81%)#4 | 1,223,316(0.02%)#359 |
| 5. | Long Beach | 182 | 7,168(2.54%)#5 | 1,223,316(0.01%)#484 |
| 6. | Vacaville | 169 | 7,168(2.36%)#6 | 1,223,316(0.01%)#525 |
| 7. | Sacramento | 134 | 7,168(1.87%)#7 | 1,223,316(0.01%)#612 |
| 8. | Yuba City | 118 | 7,168(1.65%)#8 | 1,223,316(0.01%)#669 |
| 9. | Oakland | 111 | 7,168(1.55%)#9 | 1,223,316(0.01%)#692 |
| 10. | San Francisco | 102 | 7,168(1.42%)#10 | 1,223,316(0.01%)#725 |
| 11. | Palmdale | 101 | 7,168(1.41%)#11 | 1,223,316(0.01%)#729 |
| 12. | East Palo Alto | 94 | 7,168(1.31%)#12 | 1,223,316(0.01%)#773 |
| 13. | Alhambra | 92 | 7,168(1.28%)#13 | 1,223,316(0.01%)#782 |
| 14. | San Jose | 91 | 7,168(1.27%)#14 | 1,223,316(0.01%)#791 |
| 15. | French Valley | 89 | 7,168(1.24%)#15 | 1,223,316(0.01%)#802 |
| 16. | Vista | 79 | 7,168(1.10%)#16 | 1,223,316(0.01%)#868 |
| 17. | San Clemente | 79 | 7,168(1.10%)#17 | 1,223,316(0.01%)#869 |
| 18. | Norwalk | 74 | 7,168(1.03%)#18 | 1,223,316(0.01%)#920 |
| 19. | San Rafael | 73 | 7,168(1.02%)#19 | 1,223,316(0.01%)#933 |
| 20. | Irvine | 72 | 7,168(1.00%)#20 | 1,223,316(0.01%)#939 |
| 21. | Pasadena | 71 | 7,168(0.99%)#21 | 1,223,316(0.01%)#946 |
| 22. | Martinez | 69 | 7,168(0.96%)#22 | 1,223,316(0.01%)#967 |
| 23. | Glendale | 67 | 7,168(0.93%)#23 | 1,223,316(0.01%)#984 |
| 24. | Twentynine Palms | 64 | 7,168(0.89%)#24 | 1,223,316(0.01%)#1,005 |
| 25. | Eastvale | 62 | 7,168(0.86%)#25 | 1,223,316(0.01%)#1,027 |
| 26. | Westlake Village | 60 | 7,168(0.84%)#26 | 1,223,316(0.00%)#1,052 |
| 27. | Corona | 59 | 7,168(0.82%)#27 | 1,223,316(0.00%)#1,055 |
| 28. | La Mesa | 59 | 7,168(0.82%)#28 | 1,223,316(0.00%)#1,057 |
| 29. | Santee | 59 | 7,168(0.82%)#29 | 1,223,316(0.00%)#1,058 |
| 30. | Fremont | 58 | 7,168(0.81%)#30 | 1,223,316(0.00%)#1,065 |
| 31. | Charter Oak | 58 | 7,168(0.81%)#31 | 1,223,316(0.00%)#1,069 |
| 32. | San Lorenzo | 57 | 7,168(0.80%)#32 | 1,223,316(0.00%)#1,076 |
| 33. | Prunedale | 50 | 7,168(0.70%)#33 | 1,223,316(0.00%)#1,151 |
| 34. | Modesto | 49 | 7,168(0.68%)#34 | 1,223,316(0.00%)#1,157 |
| 35. | Inglewood | 49 | 7,168(0.68%)#35 | 1,223,316(0.00%)#1,158 |
| 36. | Santa Ana | 47 | 7,168(0.66%)#36 | 1,223,316(0.00%)#1,181 |
| 37. | Laguna Niguel | 46 | 7,168(0.64%)#37 | 1,223,316(0.00%)#1,195 |
| 38. | Richmond | 44 | 7,168(0.61%)#38 | 1,223,316(0.00%)#1,222 |
| 39. | Winter Gardens | 43 | 7,168(0.60%)#39 | 1,223,316(0.00%)#1,240 |
| 40. | Corcoran | 40 | 7,168(0.56%)#40 | 1,223,316(0.00%)#1,284 |
| 41. | Berkeley | 39 | 7,168(0.54%)#41 | 1,223,316(0.00%)#1,296 |
| 42. | El Sobrante Cdp Contra Costa County | 39 | 7,168(0.54%)#42 | 1,223,316(0.00%)#1,304 |
| 43. | La Presa | 38 | 7,168(0.53%)#43 | 1,223,316(0.00%)#1,320 |
| 44. | Lawndale | 38 | 7,168(0.53%)#44 | 1,223,316(0.00%)#1,322 |
| 45. | Agoura Hills | 38 | 7,168(0.53%)#45 | 1,223,316(0.00%)#1,326 |
| 46. | Downey | 37 | 7,168(0.52%)#46 | 1,223,316(0.00%)#1,342 |
| 47. | Florence Graham | 36 | 7,168(0.50%)#47 | 1,223,316(0.00%)#1,360 |
| 48. | Diablo | 36 | 7,168(0.50%)#48 | 1,223,316(0.00%)#1,370 |
| 49. | South San Francisco | 35 | 7,168(0.49%)#49 | 1,223,316(0.00%)#1,375 |
| 50. | Santa Clarita | 34 | 7,168(0.47%)#50 | 1,223,316(0.00%)#1,396 |
| 51. | Arden Arcade | 34 | 7,168(0.47%)#51 | 1,223,316(0.00%)#1,398 |
| 52. | Ripon | 34 | 7,168(0.47%)#52 | 1,223,316(0.00%)#1,410 |
| 53. | La Canada Flintridge | 33 | 7,168(0.46%)#53 | 1,223,316(0.00%)#1,431 |
| 54. | Beaumont | 32 | 7,168(0.45%)#54 | 1,223,316(0.00%)#1,450 |
| 55. | Signal Hill | 32 | 7,168(0.45%)#55 | 1,223,316(0.00%)#1,458 |
| 56. | Hayward | 31 | 7,168(0.43%)#56 | 1,223,316(0.00%)#1,470 |
| 57. | Mountain View | 30 | 7,168(0.42%)#57 | 1,223,316(0.00%)#1,486 |
| 58. | Bell Gardens | 30 | 7,168(0.42%)#58 | 1,223,316(0.00%)#1,488 |
| 59. | Eucalyptus Hills | 30 | 7,168(0.42%)#59 | 1,223,316(0.00%)#1,497 |
| 60. | Escondido | 29 | 7,168(0.40%)#60 | 1,223,316(0.00%)#1,508 |
| 61. | Ontario | 28 | 7,168(0.39%)#61 | 1,223,316(0.00%)#1,534 |
| 62. | Union City | 28 | 7,168(0.39%)#62 | 1,223,316(0.00%)#1,535 |
| 63. | Novato | 28 | 7,168(0.39%)#63 | 1,223,316(0.00%)#1,537 |
| 64. | East Whittier | 28 | 7,168(0.39%)#64 | 1,223,316(0.00%)#1,549 |
| 65. | Bakersfield | 27 | 7,168(0.38%)#65 | 1,223,316(0.00%)#1,561 |
| 66. | Elk Grove | 27 | 7,168(0.38%)#66 | 1,223,316(0.00%)#1,562 |
| 67. | Salinas | 27 | 7,168(0.38%)#67 | 1,223,316(0.00%)#1,563 |
| 68. | Citrus | 27 | 7,168(0.38%)#68 | 1,223,316(0.00%)#1,574 |
| 69. | Wildomar | 26 | 7,168(0.36%)#69 | 1,223,316(0.00%)#1,598 |
| 70. | Lakeside | 26 | 7,168(0.36%)#70 | 1,223,316(0.00%)#1,601 |
| 71. | Larkfield Wikiup | 25 | 7,168(0.35%)#71 | 1,223,316(0.00%)#1,643 |
| 72. | Homeland | 25 | 7,168(0.35%)#72 | 1,223,316(0.00%)#1,646 |
| 73. | Whittier | 24 | 7,168(0.33%)#73 | 1,223,316(0.00%)#1,658 |
| 74. | Redwood City | 24 | 7,168(0.33%)#74 | 1,223,316(0.00%)#1,659 |
| 75. | Moreno Valley | 23 | 7,168(0.32%)#75 | 1,223,316(0.00%)#1,670 |
| 76. | Lynwood | 23 | 7,168(0.32%)#76 | 1,223,316(0.00%)#1,675 |
| 77. | Coachella | 23 | 7,168(0.32%)#77 | 1,223,316(0.00%)#1,678 |
| 78. | Monrovia | 23 | 7,168(0.32%)#78 | 1,223,316(0.00%)#1,679 |
| 79. | Lake Forest | 22 | 7,168(0.31%)#79 | 1,223,316(0.00%)#1,702 |
| 80. | Riverside | 21 | 7,168(0.29%)#80 | 1,223,316(0.00%)#1,741 |
| 81. | Visalia | 21 | 7,168(0.29%)#81 | 1,223,316(0.00%)#1,742 |
| 82. | Carlsbad | 21 | 7,168(0.29%)#82 | 1,223,316(0.00%)#1,743 |
| 83. | Bay Point | 21 | 7,168(0.29%)#83 | 1,223,316(0.00%)#1,754 |
| 84. | Fontana | 20 | 7,168(0.28%)#84 | 1,223,316(0.00%)#1,784 |
| 85. | Fresno | 19 | 7,168(0.27%)#85 | 1,223,316(0.00%)#1,811 |
| 86. | San Bernardino | 19 | 7,168(0.27%)#86 | 1,223,316(0.00%)#1,812 |
| 87. | Citrus Heights | 19 | 7,168(0.27%)#87 | 1,223,316(0.00%)#1,815 |
| 88. | Solana Beach | 19 | 7,168(0.27%)#88 | 1,223,316(0.00%)#1,830 |
| 89. | Costa Mesa | 18 | 7,168(0.25%)#89 | 1,223,316(0.00%)#1,849 |
| 90. | Hesperia | 18 | 7,168(0.25%)#90 | 1,223,316(0.00%)#1,850 |
| 91. | Tustin | 18 | 7,168(0.25%)#91 | 1,223,316(0.00%)#1,851 |
| 92. | Apple Valley | 18 | 7,168(0.25%)#92 | 1,223,316(0.00%)#1,853 |
| 93. | Barstow | 18 | 7,168(0.25%)#93 | 1,223,316(0.00%)#1,858 |
| 94. | Anaheim | 17 | 7,168(0.24%)#94 | 1,223,316(0.00%)#1,884 |
| 95. | Chino Hills | 17 | 7,168(0.24%)#95 | 1,223,316(0.00%)#1,885 |
| 96. | Loma Linda | 17 | 7,168(0.24%)#96 | 1,223,316(0.00%)#1,896 |
| 97. | Stanford | 17 | 7,168(0.24%)#97 | 1,223,316(0.00%)#1,901 |
| 98. | Kensington | 17 | 7,168(0.24%)#98 | 1,223,316(0.00%)#1,911 |
| 99. | Huntington Park | 16 | 7,168(0.22%)#99 | 1,223,316(0.00%)#1,927 |
| 100. | Azusa | 16 | 7,168(0.22%)#100 | 1,223,316(0.00%)#1,928 |
Common Questions
What are the Top 10 Cities with the Most Immigrants from Dominican Republic in California?
Top 10 Cities with the Most Immigrants from Dominican Republic in California are:
#1
897
#2
606
#3
421
#4
273
#5
182
#6
169
#7
134
#8
118
#9
111
#10
102
What city has the Most Immigrants from Dominican Republic in California?
Los Angeles has the Most Immigrants from Dominican Republic in California with 897.
What is the Total Immigrants from Dominican Republic in the State of California?
Total Immigrants from Dominican Republic in California is 7,168.
What is the Total Immigrants from Dominican Republic in the United States?
Total Immigrants from Dominican Republic in the United States is 1,223,316.