Cities with the Most Immigrants from Zimbabwe in California
RELATED REPORTS & OPTIONS
Zimbabwe
California
Compare Cities
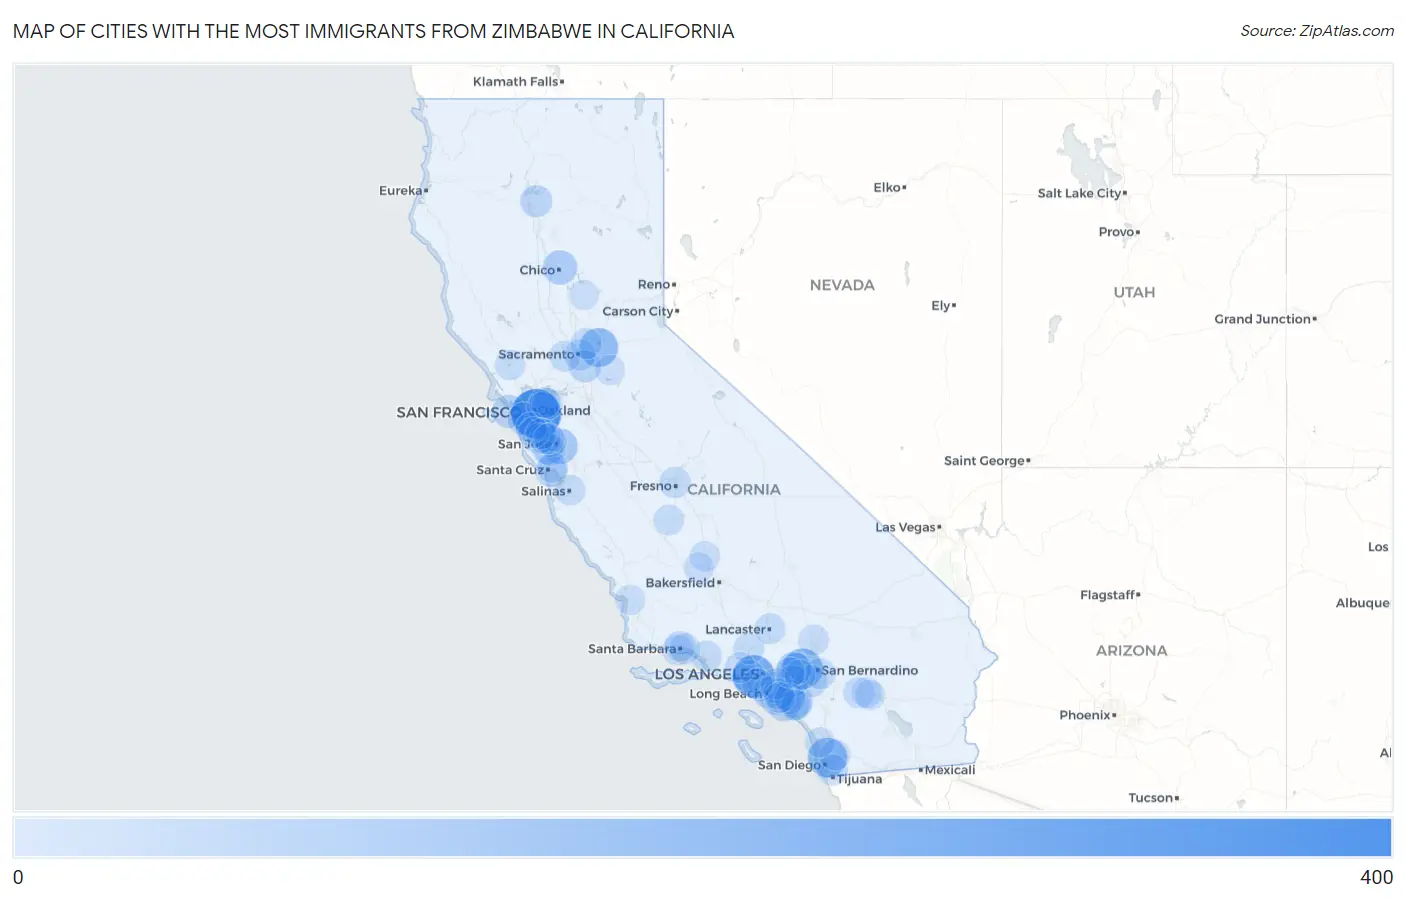
Map of Cities with the Most Immigrants from Zimbabwe in California
0
400
Cities with the Most Immigrants from Zimbabwe in California
| City | Zimbabwe | vs State | vs National | |
| 1. | Oakland | 348 | 2,561(13.59%)#1 | 26,959(1.29%)#4 |
| 2. | Los Angeles | 214 | 2,561(8.36%)#2 | 26,959(0.79%)#16 |
| 3. | Rancho Cucamonga | 182 | 2,561(7.11%)#3 | 26,959(0.68%)#22 |
| 4. | San Diego | 160 | 2,561(6.25%)#4 | 26,959(0.59%)#25 |
| 5. | Folsom | 152 | 2,561(5.94%)#5 | 26,959(0.56%)#28 |
| 6. | San Jose | 93 | 2,561(3.63%)#6 | 26,959(0.34%)#48 |
| 7. | Chico | 73 | 2,561(2.85%)#7 | 26,959(0.27%)#70 |
| 8. | Claremont | 62 | 2,561(2.42%)#8 | 26,959(0.23%)#87 |
| 9. | Lake Forest | 53 | 2,561(2.07%)#9 | 26,959(0.20%)#111 |
| 10. | San Francisco | 50 | 2,561(1.95%)#10 | 26,959(0.19%)#115 |
| 11. | Daly City | 45 | 2,561(1.76%)#11 | 26,959(0.17%)#123 |
| 12. | Newport Beach | 44 | 2,561(1.72%)#12 | 26,959(0.16%)#126 |
| 13. | Huntington Beach | 42 | 2,561(1.64%)#13 | 26,959(0.16%)#131 |
| 14. | Santa Monica | 42 | 2,561(1.64%)#14 | 26,959(0.16%)#132 |
| 15. | Elk Grove | 40 | 2,561(1.56%)#15 | 26,959(0.15%)#139 |
| 16. | Riverside | 37 | 2,561(1.44%)#16 | 26,959(0.14%)#154 |
| 17. | Bella Vista | 35 | 2,561(1.37%)#17 | 26,959(0.13%)#171 |
| 18. | Long Beach | 34 | 2,561(1.33%)#18 | 26,959(0.13%)#172 |
| 19. | Chino Hills | 34 | 2,561(1.33%)#19 | 26,959(0.13%)#177 |
| 20. | Upland | 28 | 2,561(1.09%)#20 | 26,959(0.10%)#216 |
| 21. | Pleasure Point | 27 | 2,561(1.05%)#21 | 26,959(0.10%)#225 |
| 22. | Saratoga | 26 | 2,561(1.02%)#22 | 26,959(0.10%)#232 |
| 23. | Buena Park | 23 | 2,561(0.90%)#23 | 26,959(0.09%)#251 |
| 24. | Monte Sereno | 22 | 2,561(0.86%)#24 | 26,959(0.08%)#267 |
| 25. | Sacramento | 21 | 2,561(0.82%)#25 | 26,959(0.08%)#268 |
| 26. | Tustin | 21 | 2,561(0.82%)#26 | 26,959(0.08%)#271 |
| 27. | Laguna Hills | 21 | 2,561(0.82%)#27 | 26,959(0.08%)#275 |
| 28. | Fresno | 20 | 2,561(0.78%)#28 | 26,959(0.07%)#278 |
| 29. | San Buenaventura Ventura | 19 | 2,561(0.74%)#29 | 26,959(0.07%)#288 |
| 30. | Chula Vista | 18 | 2,561(0.70%)#30 | 26,959(0.07%)#297 |
| 31. | Santa Clara | 18 | 2,561(0.70%)#31 | 26,959(0.07%)#301 |
| 32. | Palm Springs | 18 | 2,561(0.70%)#32 | 26,959(0.07%)#305 |
| 33. | Santa Clarita | 17 | 2,561(0.66%)#33 | 26,959(0.06%)#309 |
| 34. | La Mirada | 17 | 2,561(0.66%)#34 | 26,959(0.06%)#311 |
| 35. | Lancaster | 16 | 2,561(0.62%)#35 | 26,959(0.06%)#316 |
| 36. | Loma Linda | 16 | 2,561(0.62%)#36 | 26,959(0.06%)#321 |
| 37. | Davis | 15 | 2,561(0.59%)#37 | 26,959(0.06%)#331 |
| 38. | Antelope | 15 | 2,561(0.59%)#38 | 26,959(0.06%)#334 |
| 39. | Santee | 14 | 2,561(0.55%)#39 | 26,959(0.05%)#341 |
| 40. | Garden Grove | 13 | 2,561(0.51%)#40 | 26,959(0.05%)#355 |
| 41. | Victorville | 13 | 2,561(0.51%)#41 | 26,959(0.05%)#356 |
| 42. | Santa Barbara | 13 | 2,561(0.51%)#42 | 26,959(0.05%)#360 |
| 43. | La Canada Flintridge | 13 | 2,561(0.51%)#43 | 26,959(0.05%)#368 |
| 44. | Moraga | 13 | 2,561(0.51%)#44 | 26,959(0.05%)#369 |
| 45. | Lemoore Station | 13 | 2,561(0.51%)#45 | 26,959(0.05%)#371 |
| 46. | Ladera | 13 | 2,561(0.51%)#46 | 26,959(0.05%)#374 |
| 47. | Irvine | 12 | 2,561(0.47%)#47 | 26,959(0.04%)#376 |
| 48. | Salinas | 12 | 2,561(0.47%)#48 | 26,959(0.04%)#378 |
| 49. | Montecito | 12 | 2,561(0.47%)#49 | 26,959(0.04%)#393 |
| 50. | Ontario | 11 | 2,561(0.43%)#50 | 26,959(0.04%)#397 |
| 51. | Mountain View | 11 | 2,561(0.43%)#51 | 26,959(0.04%)#400 |
| 52. | Walnut Creek | 11 | 2,561(0.43%)#52 | 26,959(0.04%)#402 |
| 53. | Calabasas | 11 | 2,561(0.43%)#53 | 26,959(0.04%)#408 |
| 54. | San Mateo | 10 | 2,561(0.39%)#54 | 26,959(0.04%)#423 |
| 55. | Mission Viejo | 10 | 2,561(0.39%)#55 | 26,959(0.04%)#425 |
| 56. | Hawthorne | 10 | 2,561(0.39%)#56 | 26,959(0.04%)#426 |
| 57. | Fountain Valley | 10 | 2,561(0.39%)#57 | 26,959(0.04%)#432 |
| 58. | San Carlos | 10 | 2,561(0.39%)#58 | 26,959(0.04%)#434 |
| 59. | Santa Rosa | 9 | 2,561(0.35%)#59 | 26,959(0.03%)#447 |
| 60. | Menlo Park | 9 | 2,561(0.35%)#60 | 26,959(0.03%)#460 |
| 61. | Soquel | 9 | 2,561(0.35%)#61 | 26,959(0.03%)#471 |
| 62. | Mission Canyon | 9 | 2,561(0.35%)#62 | 26,959(0.03%)#478 |
| 63. | Sunnyvale | 8 | 2,561(0.31%)#63 | 26,959(0.03%)#481 |
| 64. | Rancho Mirage | 8 | 2,561(0.31%)#64 | 26,959(0.03%)#491 |
| 65. | Acalanes Ridge | 8 | 2,561(0.31%)#65 | 26,959(0.03%)#497 |
| 66. | Delano | 7 | 2,561(0.27%)#66 | 26,959(0.03%)#504 |
| 67. | Palm Desert | 5 | 2,561(0.20%)#67 | 26,959(0.02%)#540 |
| 68. | Pomona | 4 | 2,561(0.16%)#68 | 26,959(0.01%)#560 |
| 69. | Encinitas | 4 | 2,561(0.16%)#69 | 26,959(0.01%)#565 |
| 70. | Wasco | 4 | 2,561(0.16%)#70 | 26,959(0.01%)#567 |
| 71. | Arroyo Grande | 4 | 2,561(0.16%)#71 | 26,959(0.01%)#571 |
| 72. | Pepperdine University | 4 | 2,561(0.16%)#72 | 26,959(0.01%)#575 |
| 73. | Ione | 3 | 2,561(0.12%)#73 | 26,959(0.01%)#588 |
| 74. | Bangor | 2 | 2,561(0.08%)#74 | 26,959(0.01%)#616 |
Common Questions
What are the Top 10 Cities with the Most Immigrants from Zimbabwe in California?
Top 10 Cities with the Most Immigrants from Zimbabwe in California are:
#1
348
#2
214
#3
182
#4
160
#5
152
#6
93
#7
73
#8
62
#9
53
#10
50
What city has the Most Immigrants from Zimbabwe in California?
Oakland has the Most Immigrants from Zimbabwe in California with 348.
What is the Total Immigrants from Zimbabwe in the State of California?
Total Immigrants from Zimbabwe in California is 2,561.
What is the Total Immigrants from Zimbabwe in the United States?
Total Immigrants from Zimbabwe in the United States is 26,959.