Mississippi Map & Demographics
Mississippi Map
Mississippi Overview
Dec 10, 1817
INCORPORATED
48,432
TOTAL AREA [ SQ MI ]
46,920
LAND AREA [ SQ MI ]
1,512
WATER AREA [ SQ MI ]
300
ELEVATION AVG [ FT ]
806
ELEVATION HIGH [ FT ]
Sea Level
ELEVATION LOW [ FT ]
63.1
POP DENSITY [ PPL / SQ MI ]
$29,209
PER CAPITA INCOME
$67,731
AVG FAMILY INCOME
$52,985
AVG HOUSEHOLD INCOME
30.5%
WAGE / INCOME GAP [ % ]
69.5¢/ $1
WAGE / INCOME GAP [ $ ]
$11,405
FAMILY INCOME DEFICIT
0.48
INEQUALITY / GINI INDEX
38654
LARGEST ZIP CODE
Jackson
LARGEST CITY
Hinds County
LARGEST COUNTY
2,958,846
TOTAL POPULATION
1,437,988
MALE POPULATION
1,520,858
FEMALE POPULATION
94.55
MALES / 100 FEMALES
105.76
FEMALES / 100 MALES
38.1
MEDIAN AGE
3.2
AVG FAMILY SIZE
2.5
AVG HOUSEHOLD SIZE
1,343,921
LABOR FORCE [ PEOPLE ]
57.2%
PERCENT IN LABOR FORCE
6.4%
UNEMPLOYMENT RATE
Income in Mississippi
Income Overview in Mississippi
Per Capita Income in Mississippi is $29,209, while median incomes of families and households are $67,731 and $52,985 respectively.
| Characteristic | Number | Measure |
| Per Capita Income | 2,958,846 | $29,209 |
| Median Family Income | 739,850 | $67,731 |
| Mean Family Income | 739,850 | $88,319 |
| Median Household Income | 1,121,269 | $52,985 |
| Mean Household Income | 1,121,269 | $74,149 |
| Income Deficit | 739,850 | $11,405 |
| Wage / Income Gap (%) | 2,958,846 | 30.52% |
| Wage / Income Gap ($) | 2,958,846 | 69.48¢ per $1 |
| Gini / Inequality Index | 2,958,846 | 0.48 |
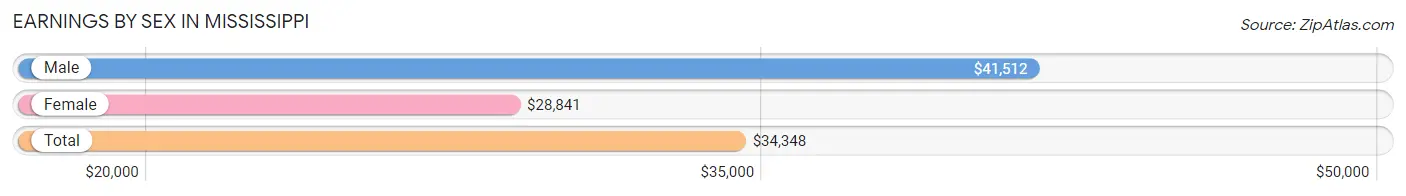
Earnings by Sex in Mississippi
Average Earnings in Mississippi are $34,348, $41,512 for men and $28,841 for women, a difference of 30.5%.
| Sex | Number | Average Earnings |
| Male | 713,280 (51.1%) | $41,512 |
| Female | 682,840 (48.9%) | $28,841 |
| Total | 1,396,120 (100.0%) | $34,348 |
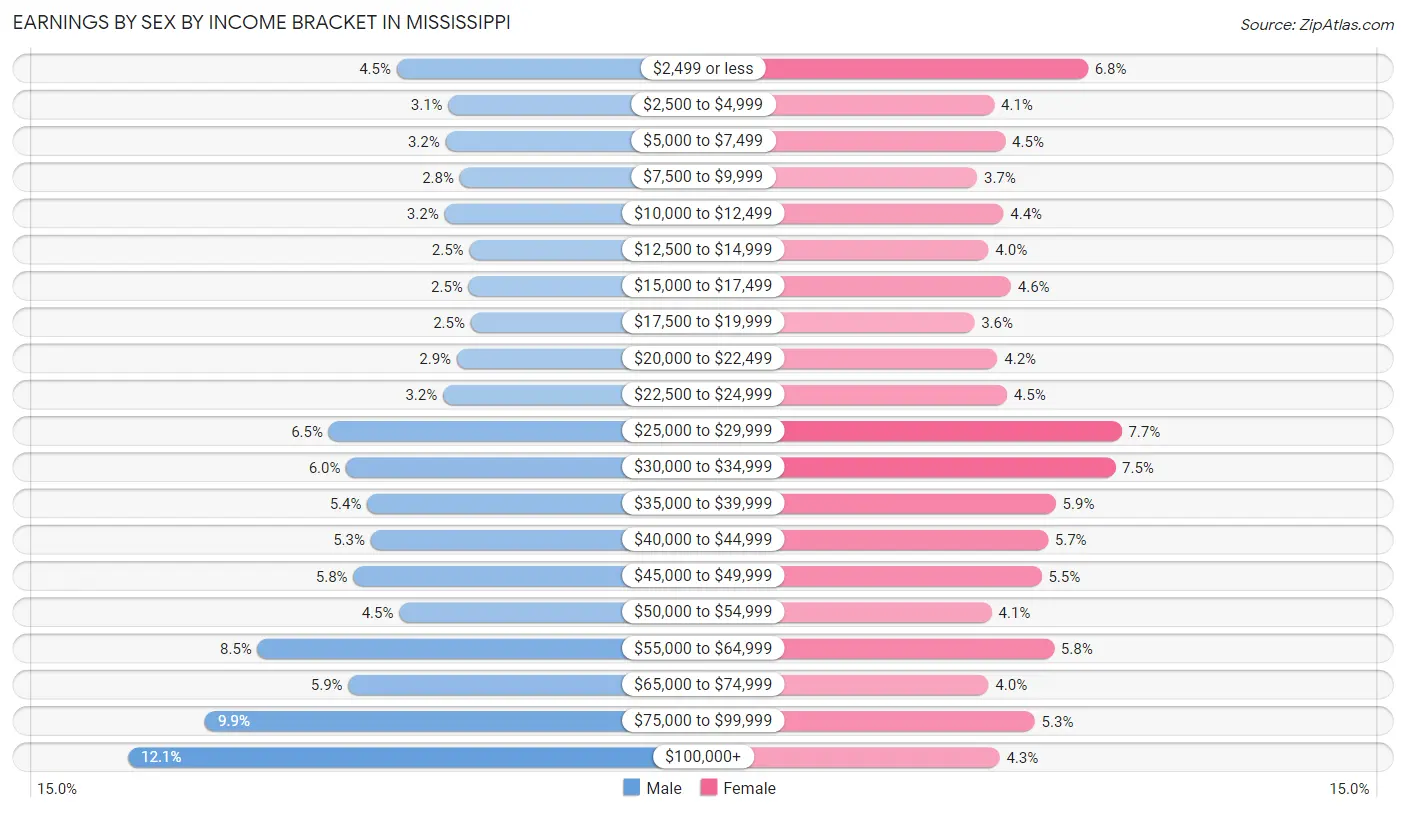
Earnings by Sex by Income Bracket in Mississippi
The most common earnings brackets in Mississippi are $100,000+ for men (86,241 | 12.1%) and $25,000 to $29,999 for women (52,723 | 7.7%).
| Income | Male | Female |
| $2,499 or less | 32,352 (4.5%) | 46,209 (6.8%) |
| $2,500 to $4,999 | 22,026 (3.1%) | 28,255 (4.1%) |
| $5,000 to $7,499 | 22,631 (3.2%) | 30,418 (4.4%) |
| $7,500 to $9,999 | 19,772 (2.8%) | 25,003 (3.7%) |
| $10,000 to $12,499 | 22,842 (3.2%) | 30,023 (4.4%) |
| $12,500 to $14,999 | 17,798 (2.5%) | 27,193 (4.0%) |
| $15,000 to $17,499 | 17,949 (2.5%) | 31,454 (4.6%) |
| $17,500 to $19,999 | 17,547 (2.5%) | 24,450 (3.6%) |
| $20,000 to $22,499 | 20,349 (2.9%) | 28,866 (4.2%) |
| $22,500 to $24,999 | 23,130 (3.2%) | 30,751 (4.5%) |
| $25,000 to $29,999 | 46,004 (6.5%) | 52,723 (7.7%) |
| $30,000 to $34,999 | 42,540 (6.0%) | 51,507 (7.5%) |
| $35,000 to $39,999 | 38,331 (5.4%) | 40,107 (5.9%) |
| $40,000 to $44,999 | 37,625 (5.3%) | 38,577 (5.7%) |
| $45,000 to $49,999 | 41,089 (5.8%) | 37,323 (5.5%) |
| $50,000 to $54,999 | 31,901 (4.5%) | 27,775 (4.1%) |
| $55,000 to $64,999 | 60,275 (8.5%) | 39,758 (5.8%) |
| $65,000 to $74,999 | 42,077 (5.9%) | 27,151 (4.0%) |
| $75,000 to $99,999 | 70,801 (9.9%) | 36,026 (5.3%) |
| $100,000+ | 86,241 (12.1%) | 29,271 (4.3%) |
| Total | 713,280 (100.0%) | 682,840 (100.0%) |
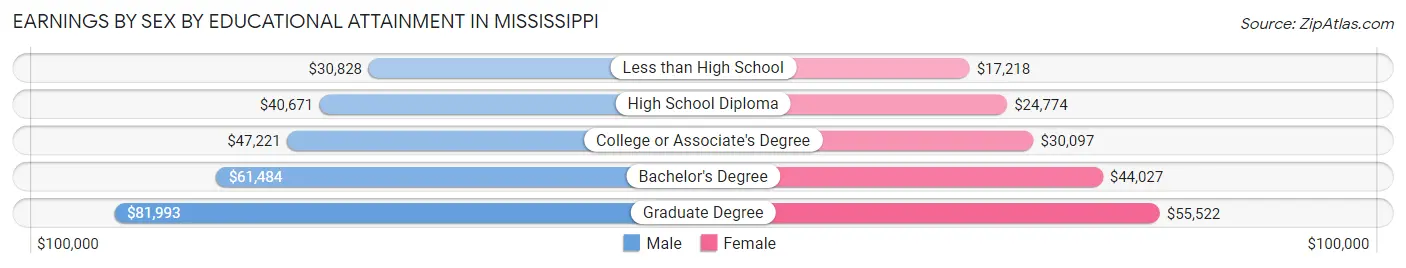
Earnings by Sex by Educational Attainment in Mississippi
Average earnings in Mississippi are $47,077 for men and $33,092 for women, a difference of 29.7%. Men with an educational attainment of graduate degree enjoy the highest average annual earnings of $81,993, while those with less than high school education earn the least with $30,828. Women with an educational attainment of graduate degree earn the most with the average annual earnings of $55,522, while those with less than high school education have the smallest earnings of $17,218.
| Educational Attainment | Male Income | Female Income |
| Less than High School | $30,828 | $17,218 |
| High School Diploma | $40,671 | $24,774 |
| College or Associate's Degree | $47,221 | $30,097 |
| Bachelor's Degree | $61,484 | $44,027 |
| Graduate Degree | $81,993 | $55,522 |
| Total | $47,077 | $33,092 |
Family Income in Mississippi
Family Income Brackets in Mississippi
According to the Mississippi family income data, there are 130,953 families falling into the $50,000 to $74,999 income range, which is the most common income bracket and makes up 17.7% of all families. Conversely, the $10,000 to $14,999 income bracket is the least frequent group with only 23,675 families (3.2%) belonging to this category.
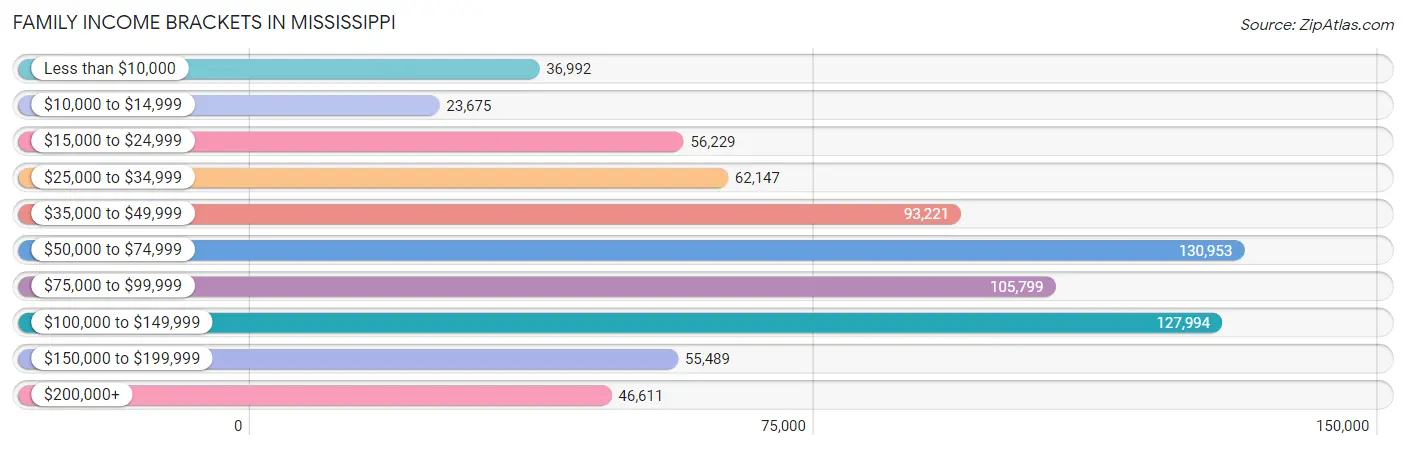
| Income Bracket | # Families | % Families |
| Less than $10,000 | 36,992 | 5.0% |
| $10,000 to $14,999 | 23,675 | 3.2% |
| $15,000 to $24,999 | 56,229 | 7.6% |
| $25,000 to $34,999 | 62,147 | 8.4% |
| $35,000 to $49,999 | 93,221 | 12.6% |
| $50,000 to $74,999 | 130,953 | 17.7% |
| $75,000 to $99,999 | 105,799 | 14.3% |
| $100,000 to $149,999 | 127,994 | 17.3% |
| $150,000 to $199,999 | 55,489 | 7.5% |
| $200,000+ | 46,611 | 6.3% |
Family Income by Famaliy Size in Mississippi
6-person families (18,725 | 2.5%) account for the highest median family income in Mississippi with $83,646 per family, while 2-person families (355,435 | 48.0%) have the highest median income of $30,328 per family member.
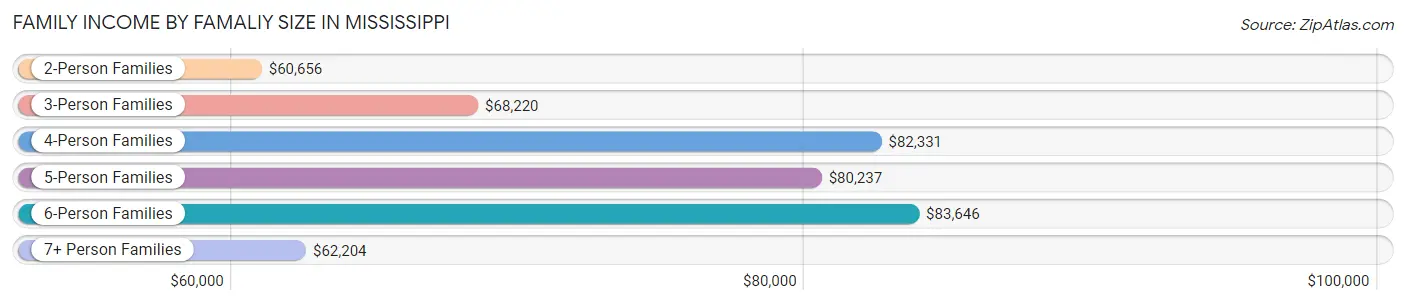
| Income Bracket | # Families | Median Income |
| 2-Person Families | 355,435 (48.0%) | $60,656 |
| 3-Person Families | 170,284 (23.0%) | $68,220 |
| 4-Person Families | 126,889 (17.2%) | $82,331 |
| 5-Person Families | 57,214 (7.7%) | $80,237 |
| 6-Person Families | 18,725 (2.5%) | $83,646 |
| 7+ Person Families | 11,303 (1.5%) | $62,204 |
| Total | 739,850 (100.0%) | $67,731 |
Family Income by Number of Earners in Mississippi
The median family income in Mississippi is $67,731, with families comprising 3+ earners (64,476) having the highest median family income of $121,474, while families with no earners (134,554) have the lowest median family income of $33,744, accounting for 8.7% and 18.2% of families, respectively.
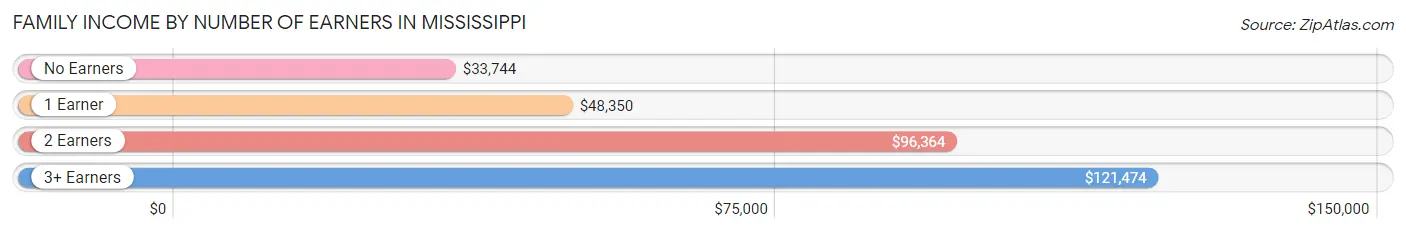
| Number of Earners | # Families | Median Income |
| No Earners | 134,554 (18.2%) | $33,744 |
| 1 Earner | 264,893 (35.8%) | $48,350 |
| 2 Earners | 275,927 (37.3%) | $96,364 |
| 3+ Earners | 64,476 (8.7%) | $121,474 |
| Total | 739,850 (100.0%) | $67,731 |
Household Income in Mississippi
Household Income Brackets in Mississippi
With 187,252 households falling in the category, the $50,000 to $74,999 income range is the most frequent in Mississippi, accounting for 16.7% of all households. In contrast, only 52,700 households (4.7%) fall into the $200,000+ income bracket, making it the least populous group.
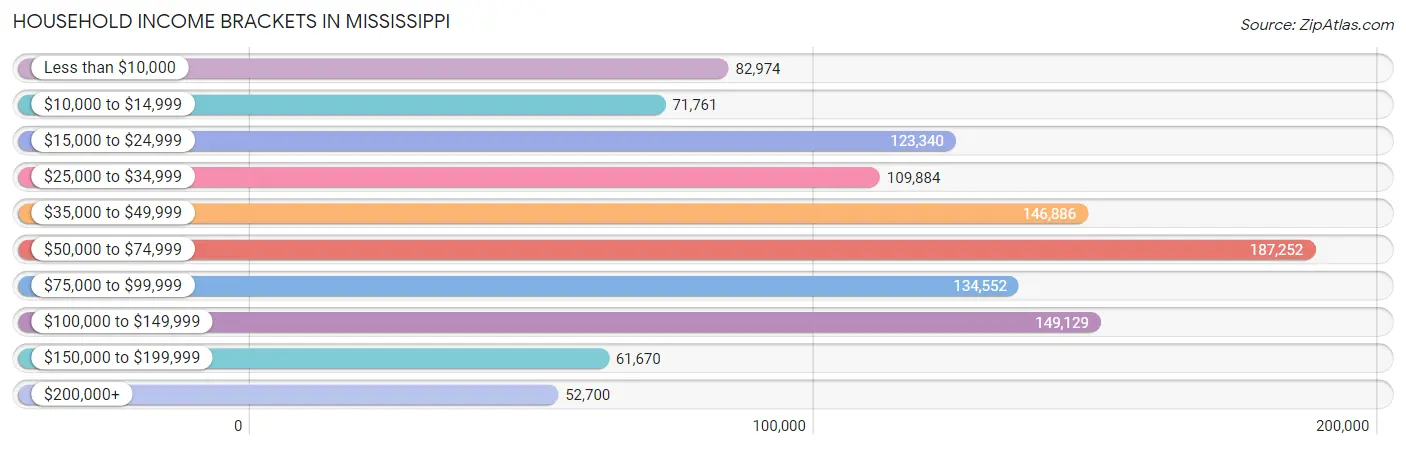
| Income Bracket | # Households | % Households |
| Less than $10,000 | 82,974 | 7.4% |
| $10,000 to $14,999 | 71,761 | 6.4% |
| $15,000 to $24,999 | 123,340 | 11.0% |
| $25,000 to $34,999 | 109,884 | 9.8% |
| $35,000 to $49,999 | 146,886 | 13.1% |
| $50,000 to $74,999 | 187,252 | 16.7% |
| $75,000 to $99,999 | 134,552 | 12.0% |
| $100,000 to $149,999 | 149,129 | 13.3% |
| $150,000 to $199,999 | 61,670 | 5.5% |
| $200,000+ | 52,700 | 4.7% |
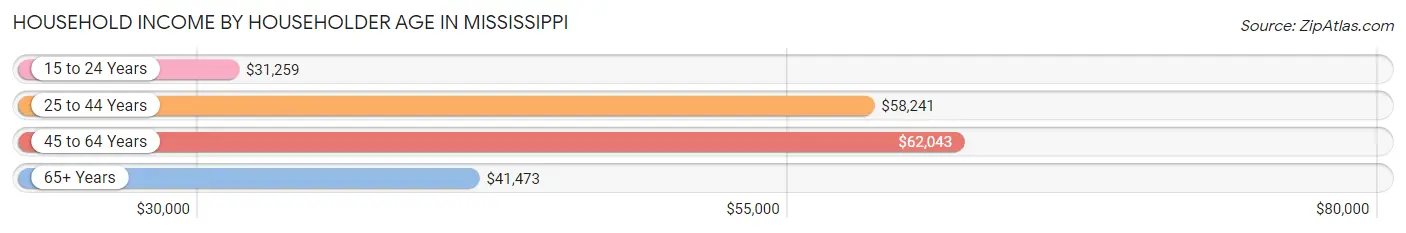
Household Income by Householder Age in Mississippi
The median household income in Mississippi is $52,985, with the highest median household income of $62,043 found in the 45 to 64 years age bracket for the primary householder. A total of 417,812 households (37.3%) fall into this category. Meanwhile, the 15 to 24 years age bracket for the primary householder has the lowest median household income of $31,259, with 43,694 households (3.9%) in this group.
| Income Bracket | # Households | Median Income |
| 15 to 24 Years | 43,694 (3.9%) | $31,259 |
| 25 to 44 Years | 348,145 (31.0%) | $58,241 |
| 45 to 64 Years | 417,812 (37.3%) | $62,043 |
| 65+ Years | 311,618 (27.8%) | $41,473 |
| Total | 1,121,269 (100.0%) | $52,985 |
Poverty in Mississippi
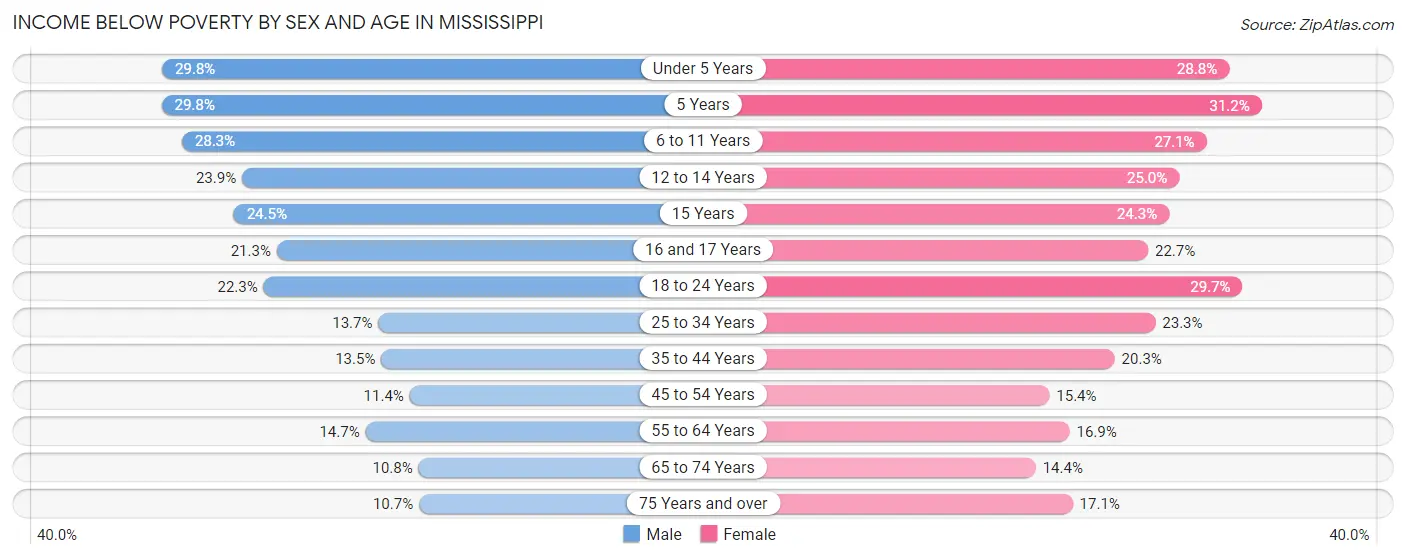
Income Below Poverty by Sex and Age in Mississippi
With 17.2% poverty level for males and 21.0% for females among the residents of Mississippi, 5 year old males and 5 year old females are the most vulnerable to poverty, with 5,126 males (29.8%) and 5,740 females (31.2%) in their respective age groups living below the poverty level.
| Age Bracket | Male | Female |
| Under 5 Years | 26,563 (29.8%) | 24,476 (28.7%) |
| 5 Years | 5,126 (29.8%) | 5,740 (31.2%) |
| 6 to 11 Years | 32,534 (28.3%) | 29,654 (27.1%) |
| 12 to 14 Years | 15,191 (23.9%) | 14,992 (25.0%) |
| 15 Years | 4,799 (24.5%) | 4,939 (24.3%) |
| 16 and 17 Years | 8,860 (21.3%) | 8,985 (22.7%) |
| 18 to 24 Years | 29,530 (22.3%) | 38,486 (29.7%) |
| 25 to 34 Years | 24,083 (13.7%) | 43,717 (23.3%) |
| 35 to 44 Years | 23,215 (13.5%) | 38,116 (20.3%) |
| 45 to 54 Years | 19,099 (11.4%) | 28,236 (15.4%) |
| 55 to 64 Years | 26,009 (14.7%) | 33,101 (16.9%) |
| 65 to 74 Years | 14,326 (10.7%) | 22,301 (14.4%) |
| 75 Years and over | 7,877 (10.7%) | 18,849 (17.1%) |
| Total | 237,212 (17.2%) | 311,592 (21.0%) |
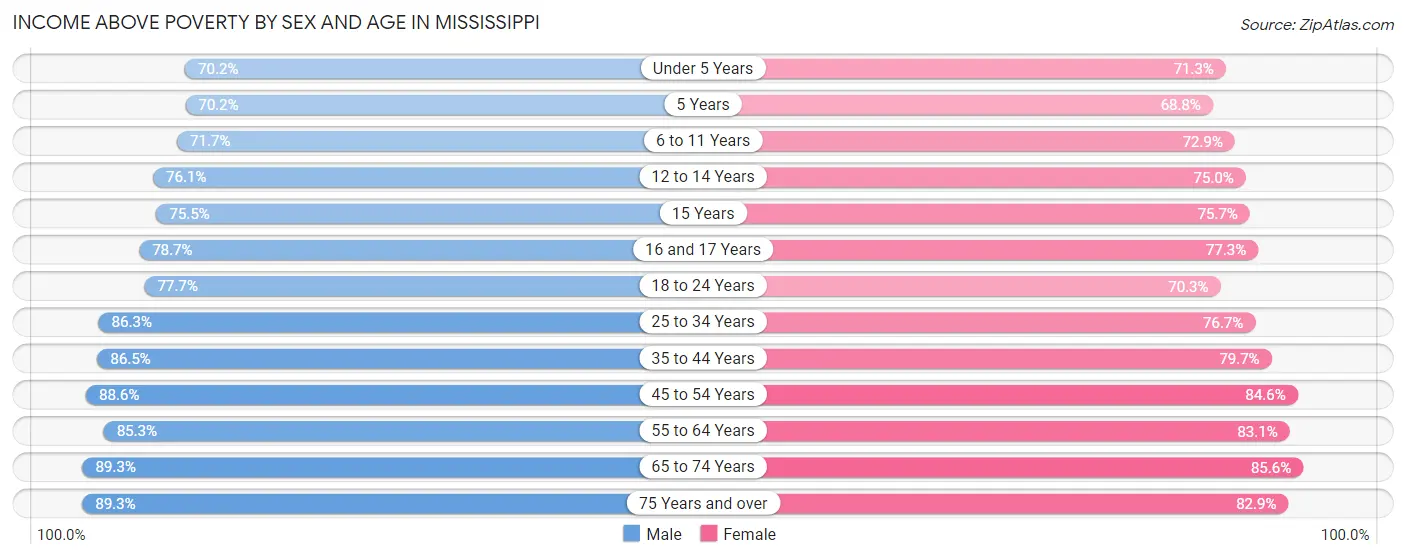
Income Above Poverty by Sex and Age in Mississippi
According to the poverty statistics in Mississippi, males aged 75 years and over and females aged 65 to 74 years are the age groups that are most secure financially, with 89.3% of males and 85.6% of females in these age groups living above the poverty line.
| Age Bracket | Male | Female |
| Under 5 Years | 62,580 (70.2%) | 60,663 (71.3%) |
| 5 Years | 12,060 (70.2%) | 12,684 (68.8%) |
| 6 to 11 Years | 82,361 (71.7%) | 79,888 (72.9%) |
| 12 to 14 Years | 48,479 (76.1%) | 44,890 (75.0%) |
| 15 Years | 14,816 (75.5%) | 15,394 (75.7%) |
| 16 and 17 Years | 32,768 (78.7%) | 30,522 (77.3%) |
| 18 to 24 Years | 103,131 (77.7%) | 90,921 (70.3%) |
| 25 to 34 Years | 151,157 (86.3%) | 144,044 (76.7%) |
| 35 to 44 Years | 148,519 (86.5%) | 149,988 (79.7%) |
| 45 to 54 Years | 148,324 (88.6%) | 154,951 (84.6%) |
| 55 to 64 Years | 150,991 (85.3%) | 162,666 (83.1%) |
| 65 to 74 Years | 118,976 (89.2%) | 132,557 (85.6%) |
| 75 Years and over | 65,588 (89.3%) | 91,097 (82.9%) |
| Total | 1,139,750 (82.8%) | 1,170,265 (79.0%) |
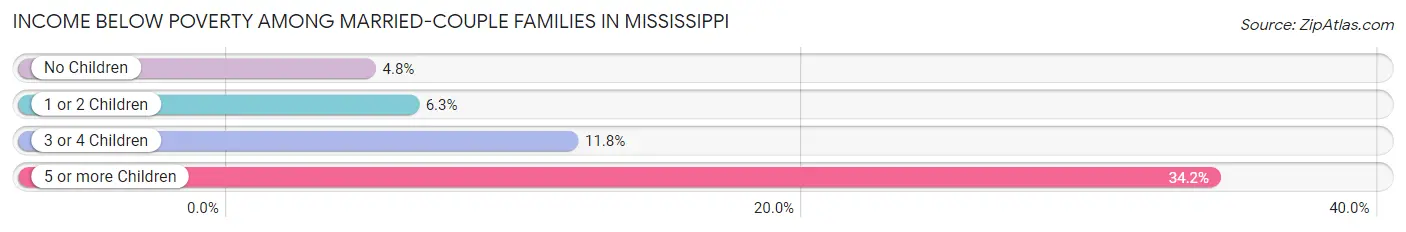
Income Below Poverty Among Married-Couple Families in Mississippi
The poverty statistics for married-couple families in Mississippi show that 6.0% or 29,876 of the total 497,533 families live below the poverty line. Families with 5 or more children have the highest poverty rate of 34.2%, comprising of 1,027 families. On the other hand, families with no children have the lowest poverty rate of 4.8%, which includes 14,188 families.
| Children | Above Poverty | Below Poverty |
| No Children | 281,974 (95.2%) | 14,188 (4.8%) |
| 1 or 2 Children | 149,097 (93.7%) | 10,013 (6.3%) |
| 3 or 4 Children | 34,612 (88.2%) | 4,648 (11.8%) |
| 5 or more Children | 1,974 (65.8%) | 1,027 (34.2%) |
| Total | 467,657 (94.0%) | 29,876 (6.0%) |
Income Below Poverty Among Single-Parent Households in Mississippi
According to the poverty data in Mississippi, 19.7% or 10,216 single-father households and 34.9% or 66,489 single-mother households are living below the poverty line. Among single-father households, those with 5 or more children have the highest poverty rate, with 360 households (83.9%) experiencing poverty. Likewise, among single-mother households, those with 5 or more children have the highest poverty rate, with 2,476 households (89.5%) falling below the poverty line.
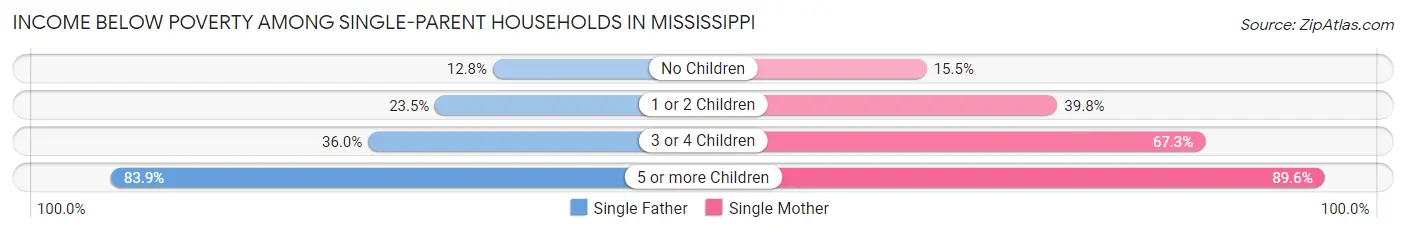
| Children | Single Father | Single Mother |
| No Children | 3,151 (12.8%) | 10,654 (15.5%) |
| 1 or 2 Children | 5,567 (23.5%) | 38,476 (39.8%) |
| 3 or 4 Children | 1,138 (36.0%) | 14,883 (67.3%) |
| 5 or more Children | 360 (83.9%) | 2,476 (89.5%) |
| Total | 10,216 (19.7%) | 66,489 (34.9%) |
Income Below Poverty Among Married-Couple vs Single-Parent Households in Mississippi
The poverty data for Mississippi shows that 29,876 of the married-couple family households (6.0%) and 76,705 of the single-parent households (31.7%) are living below the poverty level. Within the married-couple family households, those with 5 or more children have the highest poverty rate, with 1,027 households (34.2%) falling below the poverty line. Among the single-parent households, those with 5 or more children have the highest poverty rate, with 2,836 household (88.8%) living below poverty.
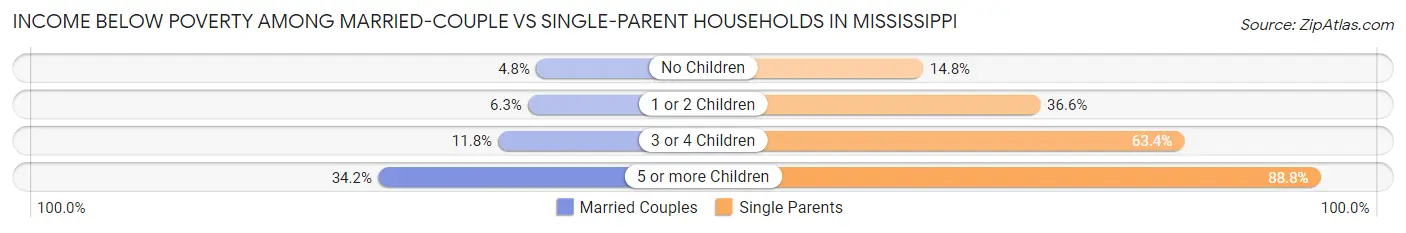
| Children | Married-Couple Families | Single-Parent Households |
| No Children | 14,188 (4.8%) | 13,805 (14.8%) |
| 1 or 2 Children | 10,013 (6.3%) | 44,043 (36.6%) |
| 3 or 4 Children | 4,648 (11.8%) | 16,021 (63.4%) |
| 5 or more Children | 1,027 (34.2%) | 2,836 (88.8%) |
| Total | 29,876 (6.0%) | 76,705 (31.7%) |
Largest Zip Codes by Population in Mississippi
The largest zip codes in Mississippi by population are 38654 (56,449), 39503 (53,049), 39110 (46,642), 38655 (45,290), and 39402 (44,020).
1.38654
56,449 (1.91%)
2.39503
53,049 (1.79%)
3.39110
46,642 (1.58%)
4.38655
45,290 (1.53%)
5.39402
44,020 (1.49%)
6.39759
43,243 (1.46%)
7.39401
41,755 (1.41%)
8.39564
41,748 (1.41%)
9.39047
40,490 (1.37%)
10.39042
38,379 (1.30%)
11.38671
37,288 (1.26%)
12.39532
36,004 (1.22%)
13.39208
33,371 (1.13%)
14.39180
29,769 (1.01%)
15.39212
29,687 (1.00%)
16.38801
29,680 (1.00%)
17.39120
29,526 (1.00%)
18.38632
29,491 (1.00%)
19.39046
28,460 (0.96%)
20.39466
28,433 (0.96%)
21.39452
28,368 (0.96%)
22.39056
27,760 (0.94%)
23.38834
27,521 (0.93%)
24.38637
26,652 (0.90%)
25.39209
26,332 (0.89%)
26.39157
24,624 (0.83%)
27.39501
24,091 (0.81%)
28.39350
23,804 (0.80%)
29.38930
23,682 (0.80%)
30.39702
23,524 (0.80%)
Largest Cities by Population in Mississippi
The largest cities in Mississippi by population are Jackson (153,271), Gulfport (72,524), Southaven (54,908), Biloxi (49,141), and Hattiesburg (48,466).
1.Jackson
153,271 (5.18%)
2.Gulfport
72,524 (2.45%)
54,908 (1.86%)
4.Biloxi
49,141 (1.66%)
48,466 (1.64%)
45,938 (1.55%)
7.Tupelo
37,939 (1.28%)
8.Meridian
34,990 (1.18%)
29,495 (1.00%)
10.Clinton
27,668 (0.94%)
11.Madison
27,595 (0.93%)
12.Pearl
27,255 (0.92%)
13.Horn Lake
26,652 (0.90%)
14.Oxford
25,713 (0.87%)
15.Brandon
25,142 (0.85%)
16.Ridgeland
24,618 (0.83%)
17.Starkville
24,274 (0.82%)
18.Columbus
23,896 (0.81%)
19.Pascagoula
21,904 (0.74%)
20.Vicksburg
21,337 (0.72%)
21.Gautier
19,007 (0.64%)
18,417 (0.62%)
23.Hernando
17,262 (0.58%)
24.Laurel
17,241 (0.58%)
25.Long Beach
16,809 (0.57%)
26.Clarksdale
14,769 (0.50%)
27.Corinth
14,520 (0.49%)
28.Natchez
14,380 (0.49%)
29.Greenwood
14,242 (0.48%)
30.Byram
12,922 (0.44%)
Largest Counties by Population in Mississippi
The largest counties in Mississippi by population are Hinds County (226,541), Harrison County (208,748), DeSoto County (186,214), Rankin County (157,185), and Jackson County (143,721).
226,541 (7.66%)
208,748 (7.06%)
186,214 (6.29%)
157,185 (5.31%)
143,721 (4.86%)
109,257 (3.69%)
83,343 (2.82%)
77,917 (2.63%)
72,741 (2.46%)
10.Jones County
67,152 (2.27%)
11.Lamar County
64,425 (2.18%)
58,547 (1.98%)
56,351 (1.90%)
56,172 (1.90%)
51,388 (1.74%)
46,010 (1.55%)
44,604 (1.51%)
44,341 (1.50%)
19.Pike County
40,098 (1.36%)
34,855 (1.18%)
34,717 (1.17%)
34,168 (1.15%)
33,980 (1.15%)
33,157 (1.12%)
31,202 (1.05%)
30,688 (1.04%)
27.Adams County
29,425 (0.99%)
28,970 (0.98%)
28,210 (0.95%)
30.Tate County
28,094 (0.95%)
Race in Mississippi
The most populous races in Mississippi are White / Caucasian (1,685,024 | 57.0%), Black / African American (1,101,836 | 37.2%), and Hispanic or Latino (97,123 | 3.3%).
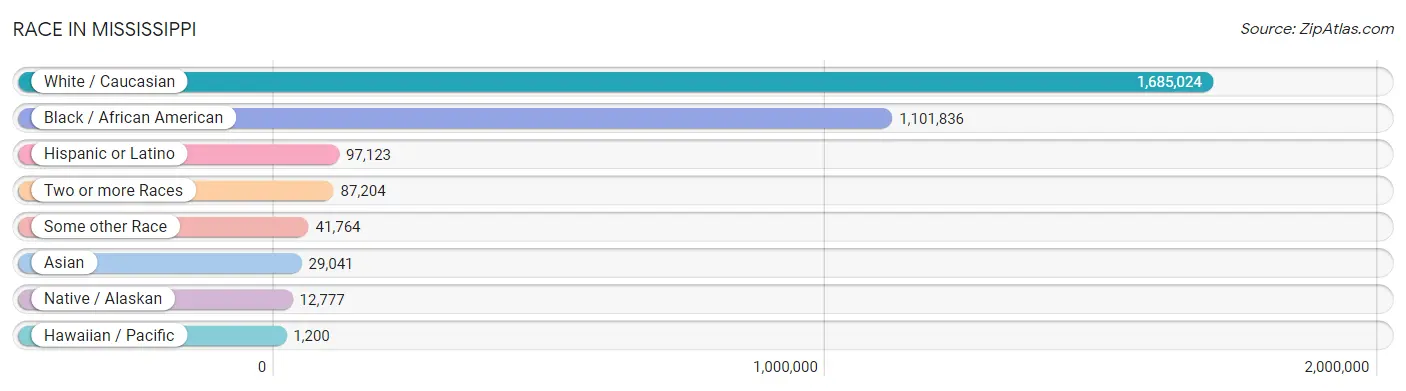
| Race | # Population | % Population |
| Asian | 29,041 | 1.0% |
| Black / African American | 1,101,836 | 37.2% |
| Hawaiian / Pacific | 1,200 | 0.0% |
| Hispanic or Latino | 97,123 | 3.3% |
| Native / Alaskan | 12,777 | 0.4% |
| White / Caucasian | 1,685,024 | 57.0% |
| Two or more Races | 87,204 | 2.9% |
| Some other Race | 41,764 | 1.4% |
| Total | 2,958,846 | 100.0% |
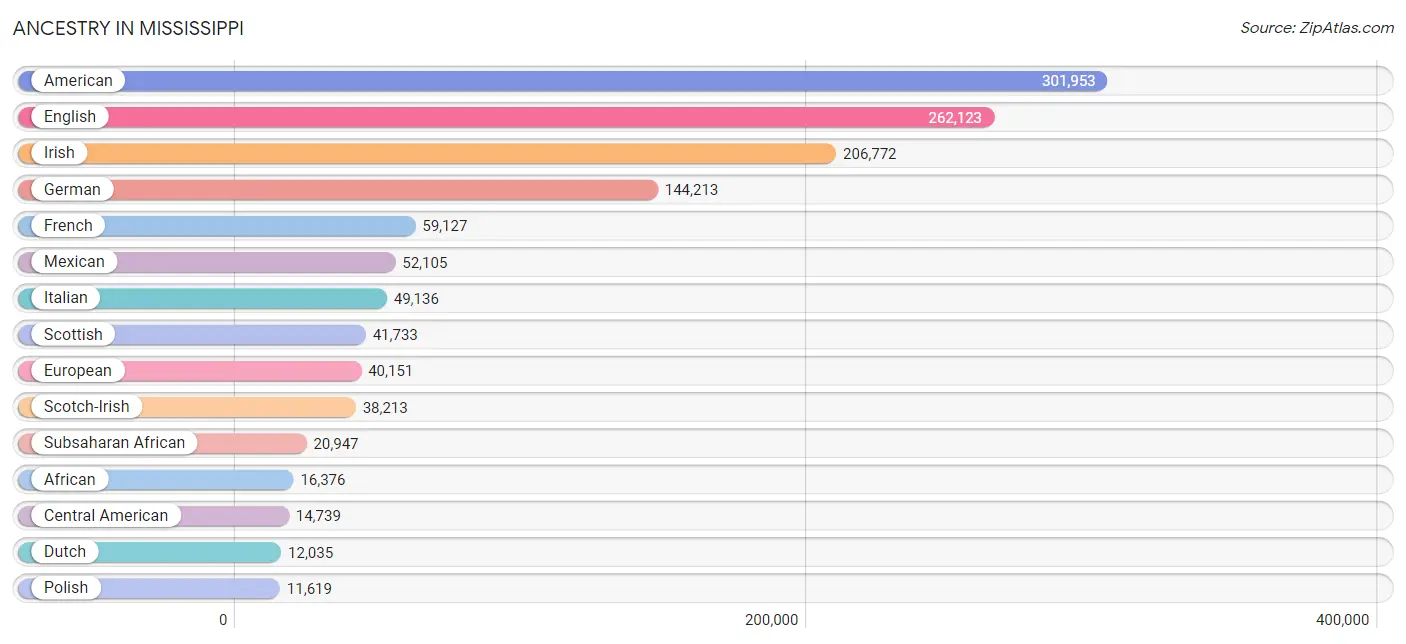
Ancestry in Mississippi
The most populous ancestries reported in Mississippi are American (301,953 | 10.2%), English (262,123 | 8.9%), Irish (206,772 | 7.0%), German (144,213 | 4.9%), and French (59,127 | 2.0%), together accounting for 32.9% of all Mississippi residents.
| Ancestry | # Population | % Population |
| Afghan | 94 | 0.0% |
| African | 16,376 | 0.5% |
| Albanian | 63 | 0.0% |
| Alsatian | 38 | 0.0% |
| American | 301,953 | 10.2% |
| Apache | 251 | 0.0% |
| Arab | 6,980 | 0.2% |
| Arapaho | 20 | 0.0% |
| Argentinean | 209 | 0.0% |
| Armenian | 427 | 0.0% |
| Australian | 277 | 0.0% |
| Austrian | 863 | 0.0% |
| Bahamian | 129 | 0.0% |
| Bangladeshi | 19 | 0.0% |
| Barbadian | 99 | 0.0% |
| Basque | 185 | 0.0% |
| Belgian | 577 | 0.0% |
| Belizean | 95 | 0.0% |
| Bhutanese | 2,296 | 0.1% |
| Blackfeet | 884 | 0.0% |
| Bolivian | 187 | 0.0% |
| Brazilian | 532 | 0.0% |
| British | 11,589 | 0.4% |
| British West Indian | 2 | 0.0% |
| Bulgarian | 61 | 0.0% |
| Burmese | 2,976 | 0.1% |
| Cajun | 1,810 | 0.1% |
| Cambodian | 1 | 0.0% |
| Canadian | 1,395 | 0.1% |
| Cape Verdean | 52 | 0.0% |
| Carpatho Rusyn | 31 | 0.0% |
| Celtic | 198 | 0.0% |
| Central American | 14,739 | 0.5% |
| Central American Indian | 852 | 0.0% |
| Cherokee | 4,938 | 0.2% |
| Cheyenne | 163 | 0.0% |
| Chickasaw | 219 | 0.0% |
| Chilean | 84 | 0.0% |
| Chinese | 311 | 0.0% |
| Chippewa | 193 | 0.0% |
| Choctaw | 10,687 | 0.4% |
| Colombian | 1,580 | 0.1% |
| Comanche | 142 | 0.0% |
| Costa Rican | 408 | 0.0% |
| Cree | 15 | 0.0% |
| Creek | 532 | 0.0% |
| Croatian | 1,264 | 0.0% |
| Crow | 20 | 0.0% |
| Cuban | 3,095 | 0.1% |
| Cypriot | 46 | 0.0% |
| Czech | 1,633 | 0.1% |
| Czechoslovakian | 302 | 0.0% |
| Danish | 1,536 | 0.1% |
| Dominican | 2,144 | 0.1% |
| Dutch | 12,035 | 0.4% |
| Dutch West Indian | 100 | 0.0% |
| Eastern European | 1,174 | 0.0% |
| Ecuadorian | 216 | 0.0% |
| Egyptian | 116 | 0.0% |
| English | 262,123 | 8.9% |
| Ethiopian | 437 | 0.0% |
| European | 40,151 | 1.4% |
| Fijian | 171 | 0.0% |
| Filipino | 190 | 0.0% |
| Finnish | 645 | 0.0% |
| French | 59,127 | 2.0% |
| French American Indian | 78 | 0.0% |
| French Canadian | 6,731 | 0.2% |
| German | 144,213 | 4.9% |
| Ghanaian | 97 | 0.0% |
| Greek | 3,773 | 0.1% |
| Guamanian / Chamorro | 352 | 0.0% |
| Guatemalan | 6,425 | 0.2% |
| Guyanese | 430 | 0.0% |
| Haitian | 672 | 0.0% |
| Honduran | 5,021 | 0.2% |
| Hopi | 18 | 0.0% |
| Houma | 516 | 0.0% |
| Hungarian | 1,326 | 0.0% |
| Icelander | 121 | 0.0% |
| Indian (Asian) | 6,290 | 0.2% |
| Indonesian | 29 | 0.0% |
| Inupiat | 26 | 0.0% |
| Iranian | 820 | 0.0% |
| Irish | 206,772 | 7.0% |
| Iroquois | 129 | 0.0% |
| Israeli | 406 | 0.0% |
| Italian | 49,136 | 1.7% |
| Jamaican | 2,057 | 0.1% |
| Japanese | 341 | 0.0% |
| Jordanian | 333 | 0.0% |
| Kenyan | 27 | 0.0% |
| Kiowa | 8 | 0.0% |
| Korean | 8,431 | 0.3% |
| Laotian | 277 | 0.0% |
| Latvian | 20 | 0.0% |
| Lebanese | 2,969 | 0.1% |
| Lithuanian | 569 | 0.0% |
| Lumbee | 25 | 0.0% |
| Luxembourger | 2 | 0.0% |
| Malaysian | 202 | 0.0% |
| Maltese | 55 | 0.0% |
| Mexican | 52,105 | 1.8% |
| Mexican American Indian | 978 | 0.0% |
| Mongolian | 192 | 0.0% |
| Moroccan | 165 | 0.0% |
| Native Hawaiian | 1,079 | 0.0% |
| Navajo | 120 | 0.0% |
| New Zealander | 164 | 0.0% |
| Nicaraguan | 753 | 0.0% |
| Nigerian | 2,481 | 0.1% |
| Northern European | 1,962 | 0.1% |
| Norwegian | 6,615 | 0.2% |
| Okinawan | 6 | 0.0% |
| Osage | 56 | 0.0% |
| Pakistani | 943 | 0.0% |
| Palestinian | 316 | 0.0% |
| Panamanian | 734 | 0.0% |
| Paraguayan | 87 | 0.0% |
| Pennsylvania German | 403 | 0.0% |
| Peruvian | 1,181 | 0.0% |
| Pima | 94 | 0.0% |
| Polish | 11,619 | 0.4% |
| Portuguese | 1,284 | 0.0% |
| Potawatomi | 13 | 0.0% |
| Pueblo | 3 | 0.0% |
| Puerto Rican | 9,783 | 0.3% |
| Puget Sound Salish | 66 | 0.0% |
| Romanian | 228 | 0.0% |
| Russian | 3,271 | 0.1% |
| Salvadoran | 1,298 | 0.0% |
| Samoan | 381 | 0.0% |
| Scandinavian | 2,929 | 0.1% |
| Scotch-Irish | 38,213 | 1.3% |
| Scottish | 41,733 | 1.4% |
| Seminole | 169 | 0.0% |
| Senegalese | 34 | 0.0% |
| Serbian | 125 | 0.0% |
| Shoshone | 23 | 0.0% |
| Sierra Leonean | 13 | 0.0% |
| Sioux | 268 | 0.0% |
| Slavic | 422 | 0.0% |
| Slovak | 709 | 0.0% |
| Slovene | 133 | 0.0% |
| Somali | 1 | 0.0% |
| South African | 384 | 0.0% |
| South American | 4,245 | 0.1% |
| South American Indian | 16 | 0.0% |
| Spaniard | 2,544 | 0.1% |
| Spanish | 3,539 | 0.1% |
| Spanish American | 45 | 0.0% |
| Spanish American Indian | 2 | 0.0% |
| Sri Lankan | 9,185 | 0.3% |
| Subsaharan African | 20,947 | 0.7% |
| Sudanese | 3 | 0.0% |
| Swedish | 8,105 | 0.3% |
| Swiss | 1,120 | 0.0% |
| Syrian | 362 | 0.0% |
| Thai | 7,644 | 0.3% |
| Tlingit-Haida | 14 | 0.0% |
| Tongan | 59 | 0.0% |
| Trinidadian and Tobagonian | 74 | 0.0% |
| Turkish | 185 | 0.0% |
| Ukrainian | 823 | 0.0% |
| Uruguayan | 5 | 0.0% |
| Venezuelan | 639 | 0.0% |
| Vietnamese | 83 | 0.0% |
| Welsh | 8,654 | 0.3% |
| West Indian | 218 | 0.0% |
| Yaqui | 47 | 0.0% |
| Yugoslavian | 528 | 0.0% |
| Zimbabwean | 5 | 0.0% | View All 172 Rows |
Immigrants in Mississippi
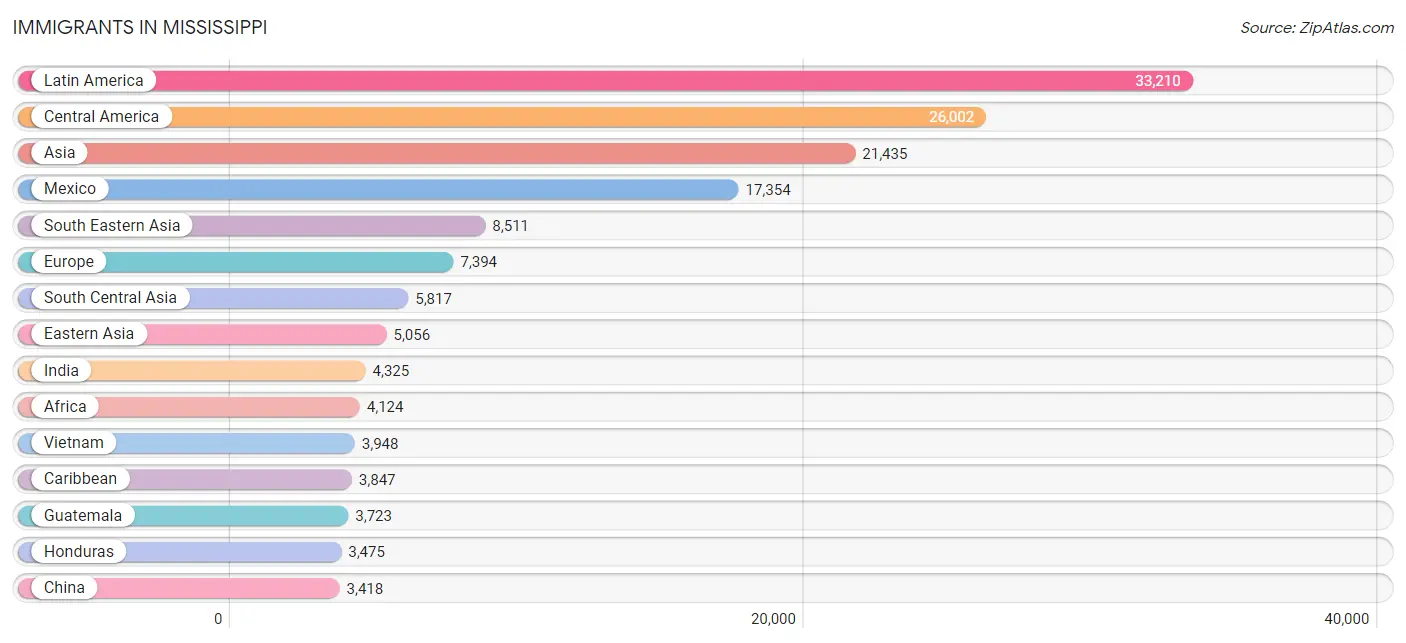
The most numerous immigrant groups reported in Mississippi came from Latin America (33,210 | 1.1%), Central America (26,002 | 0.9%), Asia (21,435 | 0.7%), Mexico (17,354 | 0.6%), and South Eastern Asia (8,511 | 0.3%), together accounting for 3.6% of all Mississippi residents.
| Immigration Origin | # Population | % Population |
| Afghanistan | 50 | 0.0% |
| Africa | 4,124 | 0.1% |
| Albania | 13 | 0.0% |
| Argentina | 127 | 0.0% |
| Armenia | 54 | 0.0% |
| Asia | 21,435 | 0.7% |
| Australia | 196 | 0.0% |
| Austria | 102 | 0.0% |
| Azores | 5 | 0.0% |
| Bahamas | 156 | 0.0% |
| Bangladesh | 100 | 0.0% |
| Barbados | 15 | 0.0% |
| Belarus | 10 | 0.0% |
| Belgium | 62 | 0.0% |
| Belize | 73 | 0.0% |
| Bolivia | 124 | 0.0% |
| Brazil | 556 | 0.0% |
| Bulgaria | 60 | 0.0% |
| Cambodia | 149 | 0.0% |
| Cameroon | 555 | 0.0% |
| Canada | 1,390 | 0.1% |
| Caribbean | 3,847 | 0.1% |
| Central America | 26,002 | 0.9% |
| Chile | 46 | 0.0% |
| China | 3,418 | 0.1% |
| Colombia | 941 | 0.0% |
| Congo | 28 | 0.0% |
| Costa Rica | 185 | 0.0% |
| Croatia | 4 | 0.0% |
| Cuba | 879 | 0.0% |
| Czechoslovakia | 67 | 0.0% |
| Denmark | 53 | 0.0% |
| Dominica | 12 | 0.0% |
| Dominican Republic | 1,324 | 0.0% |
| Eastern Africa | 726 | 0.0% |
| Eastern Asia | 5,056 | 0.2% |
| Eastern Europe | 1,595 | 0.1% |
| Ecuador | 73 | 0.0% |
| Egypt | 136 | 0.0% |
| El Salvador | 646 | 0.0% |
| England | 1,053 | 0.0% |
| Eritrea | 53 | 0.0% |
| Ethiopia | 314 | 0.0% |
| Europe | 7,394 | 0.3% |
| France | 259 | 0.0% |
| Germany | 2,126 | 0.1% |
| Ghana | 257 | 0.0% |
| Greece | 250 | 0.0% |
| Grenada | 21 | 0.0% |
| Guatemala | 3,723 | 0.1% |
| Guyana | 84 | 0.0% |
| Haiti | 385 | 0.0% |
| Honduras | 3,475 | 0.1% |
| Hong Kong | 56 | 0.0% |
| Hungary | 32 | 0.0% |
| India | 4,325 | 0.2% |
| Indonesia | 133 | 0.0% |
| Iran | 305 | 0.0% |
| Ireland | 184 | 0.0% |
| Israel | 111 | 0.0% |
| Italy | 154 | 0.0% |
| Jamaica | 899 | 0.0% |
| Japan | 595 | 0.0% |
| Jordan | 396 | 0.0% |
| Kazakhstan | 16 | 0.0% |
| Kenya | 72 | 0.0% |
| Korea | 1,043 | 0.0% |
| Kuwait | 22 | 0.0% |
| Laos | 83 | 0.0% |
| Latin America | 33,210 | 1.1% |
| Lebanon | 44 | 0.0% |
| Liberia | 132 | 0.0% |
| Lithuania | 39 | 0.0% |
| Malaysia | 115 | 0.0% |
| Mexico | 17,354 | 0.6% |
| Middle Africa | 601 | 0.0% |
| Moldova | 12 | 0.0% |
| Morocco | 145 | 0.0% |
| Nepal | 458 | 0.0% |
| Netherlands | 285 | 0.0% |
| Nicaragua | 325 | 0.0% |
| Nigeria | 718 | 0.0% |
| Northern Africa | 379 | 0.0% |
| Northern Europe | 2,226 | 0.1% |
| Norway | 46 | 0.0% |
| Oceania | 693 | 0.0% |
| Pakistan | 455 | 0.0% |
| Panama | 221 | 0.0% |
| Peru | 870 | 0.0% |
| Philippines | 3,211 | 0.1% |
| Poland | 189 | 0.0% |
| Portugal | 39 | 0.0% |
| Romania | 105 | 0.0% |
| Russia | 547 | 0.0% |
| Saudi Arabia | 215 | 0.0% |
| Scotland | 242 | 0.0% |
| Senegal | 131 | 0.0% |
| Serbia | 14 | 0.0% |
| Sierra Leone | 54 | 0.0% |
| Singapore | 38 | 0.0% |
| Somalia | 26 | 0.0% |
| South Africa | 496 | 0.0% |
| South America | 3,361 | 0.1% |
| South Central Asia | 5,817 | 0.2% |
| South Eastern Asia | 8,511 | 0.3% |
| Southern Europe | 723 | 0.0% |
| Spain | 258 | 0.0% |
| Sri Lanka | 11 | 0.0% |
| St. Vincent and the Grenadines | 21 | 0.0% |
| Sudan | 76 | 0.0% |
| Sweden | 5 | 0.0% |
| Switzerland | 8 | 0.0% |
| Syria | 220 | 0.0% |
| Taiwan | 414 | 0.0% |
| Thailand | 815 | 0.0% |
| Trinidad and Tobago | 89 | 0.0% |
| Turkey | 67 | 0.0% |
| Uganda | 87 | 0.0% |
| Ukraine | 268 | 0.0% |
| Uruguay | 100 | 0.0% |
| Uzbekistan | 93 | 0.0% |
| Venezuela | 200 | 0.0% |
| Vietnam | 3,948 | 0.1% |
| West Indies | 35 | 0.0% |
| Western Africa | 1,569 | 0.1% |
| Western Asia | 1,907 | 0.1% |
| Western Europe | 2,842 | 0.1% |
| Yemen | 680 | 0.0% |
| Zimbabwe | 17 | 0.0% | View All 129 Rows |
Sex and Age in Mississippi
Sex and Age in Mississippi
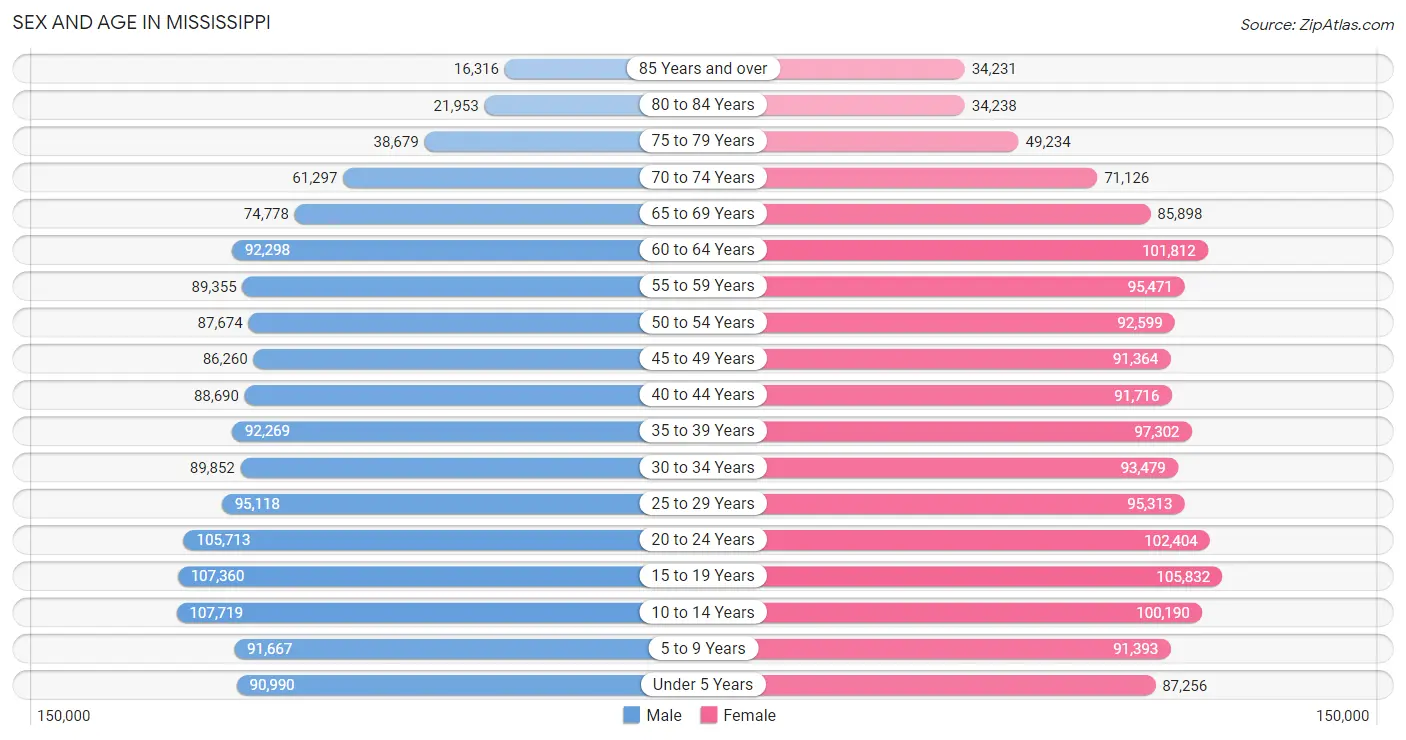
The most populous age groups in Mississippi are 10 to 14 Years (107,719 | 7.5%) for men and 15 to 19 Years (105,832 | 7.0%) for women.
| Age Bracket | Male | Female |
| Under 5 Years | 90,990 (6.3%) | 87,256 (5.7%) |
| 5 to 9 Years | 91,667 (6.4%) | 91,393 (6.0%) |
| 10 to 14 Years | 107,719 (7.5%) | 100,190 (6.6%) |
| 15 to 19 Years | 107,360 (7.5%) | 105,832 (7.0%) |
| 20 to 24 Years | 105,713 (7.3%) | 102,404 (6.7%) |
| 25 to 29 Years | 95,118 (6.6%) | 95,313 (6.3%) |
| 30 to 34 Years | 89,852 (6.2%) | 93,479 (6.1%) |
| 35 to 39 Years | 92,269 (6.4%) | 97,302 (6.4%) |
| 40 to 44 Years | 88,690 (6.2%) | 91,716 (6.0%) |
| 45 to 49 Years | 86,260 (6.0%) | 91,364 (6.0%) |
| 50 to 54 Years | 87,674 (6.1%) | 92,599 (6.1%) |
| 55 to 59 Years | 89,355 (6.2%) | 95,471 (6.3%) |
| 60 to 64 Years | 92,298 (6.4%) | 101,812 (6.7%) |
| 65 to 69 Years | 74,778 (5.2%) | 85,898 (5.7%) |
| 70 to 74 Years | 61,297 (4.3%) | 71,126 (4.7%) |
| 75 to 79 Years | 38,679 (2.7%) | 49,234 (3.2%) |
| 80 to 84 Years | 21,953 (1.5%) | 34,238 (2.2%) |
| 85 Years and over | 16,316 (1.1%) | 34,231 (2.2%) |
| Total | 1,437,988 (100.0%) | 1,520,858 (100.0%) |
Families and Households in Mississippi
Median Family Size in Mississippi
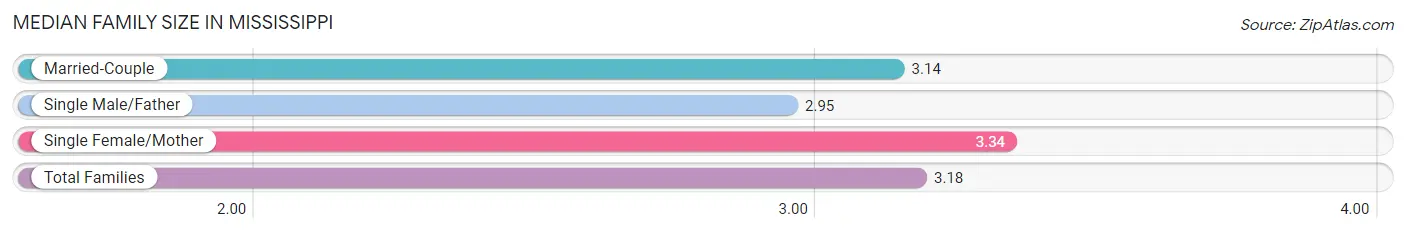
The median family size in Mississippi is 3.18 persons per family, with single female/mother families (190,400 | 25.7%) accounting for the largest median family size of 3.34 persons per family. On the other hand, single male/father families (51,917 | 7.0%) represent the smallest median family size with 2.95 persons per family.
| Family Type | # Families | Family Size |
| Married-Couple | 497,533 (67.2%) | 3.14 |
| Single Male/Father | 51,917 (7.0%) | 2.95 |
| Single Female/Mother | 190,400 (25.7%) | 3.34 |
| Total Families | 739,850 (100.0%) | 3.18 |
Median Household Size in Mississippi
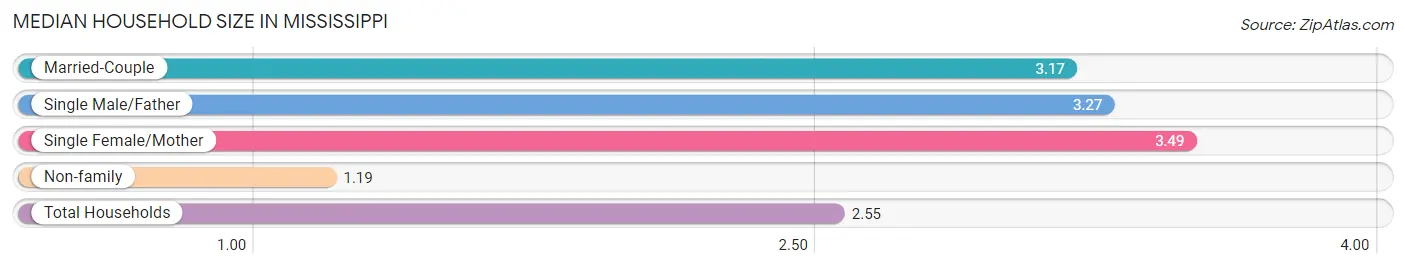
The median household size in Mississippi is 2.55 persons per household, with single female/mother households (190,400 | 17.0%) accounting for the largest median household size of 3.49 persons per household. non-family households (381,419 | 34.0%) represent the smallest median household size with 1.19 persons per household.
| Household Type | # Households | Household Size |
| Married-Couple | 497,533 (44.4%) | 3.17 |
| Single Male/Father | 51,917 (4.6%) | 3.27 |
| Single Female/Mother | 190,400 (17.0%) | 3.49 |
| Non-family | 381,419 (34.0%) | 1.19 |
| Total Households | 1,121,269 (100.0%) | 2.55 |
Household Size by Marriage Status in Mississippi
Out of a total of 1,121,269 households in Mississippi, 739,850 (66.0%) are family households, while 381,419 (34.0%) are nonfamily households. The most numerous type of family households are 2-person households, comprising 336,808, and the most common type of nonfamily households are 1-person households, comprising 329,462.
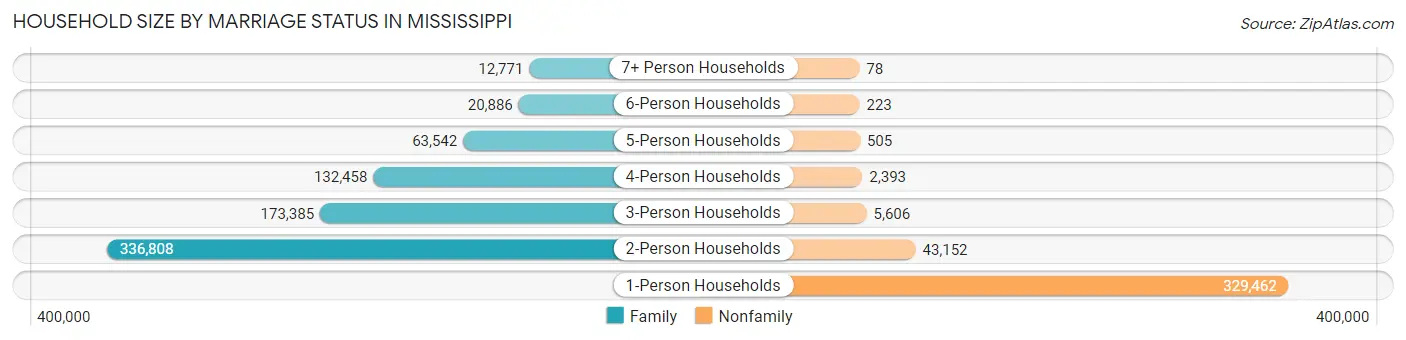
| Household Size | Family Households | Nonfamily Households |
| 1-Person Households | - | 329,462 (29.4%) |
| 2-Person Households | 336,808 (30.0%) | 43,152 (3.8%) |
| 3-Person Households | 173,385 (15.5%) | 5,606 (0.5%) |
| 4-Person Households | 132,458 (11.8%) | 2,393 (0.2%) |
| 5-Person Households | 63,542 (5.7%) | 505 (0.1%) |
| 6-Person Households | 20,886 (1.9%) | 223 (0.0%) |
| 7+ Person Households | 12,771 (1.1%) | 78 (0.0%) |
| Total | 739,850 (66.0%) | 381,419 (34.0%) |
Female Fertility in Mississippi
Fertility by Age in Mississippi
Average fertility rate in Mississippi is 55.0 births per 1,000 women. Women in the age bracket of 20 to 34 years have the highest fertility rate with 101.0 births per 1,000 women. Women in the age bracket of 20 to 34 years acount for 76.7% of all women with births.
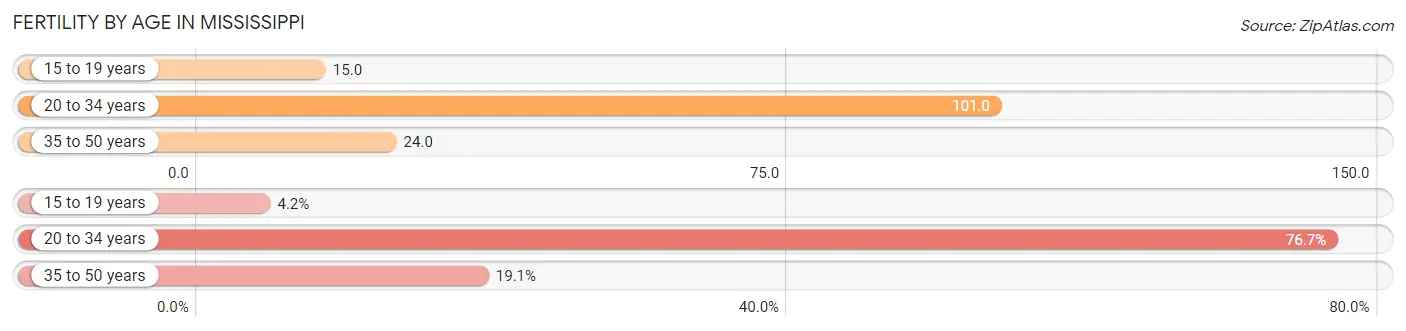
| Age Bracket | Women with Births | Births / 1,000 Women |
| 15 to 19 years | 1,625 (4.2%) | 15.0 |
| 20 to 34 years | 29,374 (76.7%) | 101.0 |
| 35 to 50 years | 7,302 (19.1%) | 24.0 |
| Total | 38,301 (100.0%) | 55.0 |
Fertility by Age by Marriage Status in Mississippi
54.2% of women with births (38,301) in Mississippi are married. The highest percentage of unmarried women with births falls into 15 to 19 years age bracket with 88.2% of them unmarried at the time of birth, while the lowest percentage of unmarried women with births belong to 35 to 50 years age bracket with 29.9% of them unmarried.
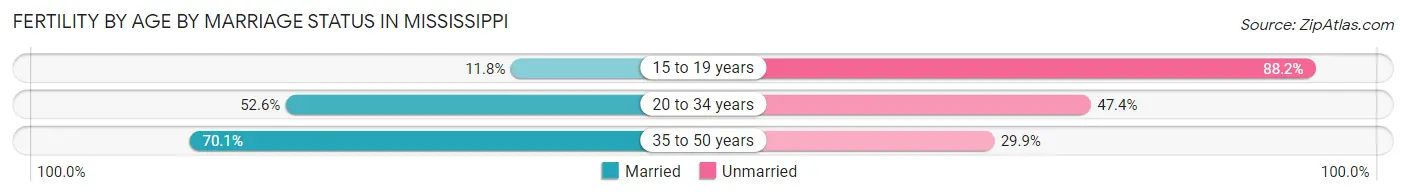
| Age Bracket | Married | Unmarried |
| 15 to 19 years | 192 (11.8%) | 1,433 (88.2%) |
| 20 to 34 years | 15,451 (52.6%) | 13,923 (47.4%) |
| 35 to 50 years | 5,119 (70.1%) | 2,183 (29.9%) |
| Total | 20,759 (54.2%) | 17,542 (45.8%) |
Fertility by Education in Mississippi
Average fertility rate in Mississippi is 55.0 births per 1,000 women. Women with the education attainment of graduate degree have the highest fertility rate of 77.0 births per 1,000 women, while women with the education attainment of less than high school have the lowest fertility at 42.0 births per 1,000 women. Women with the education attainment of college or associate's degree represent 38.7% of all women with births.
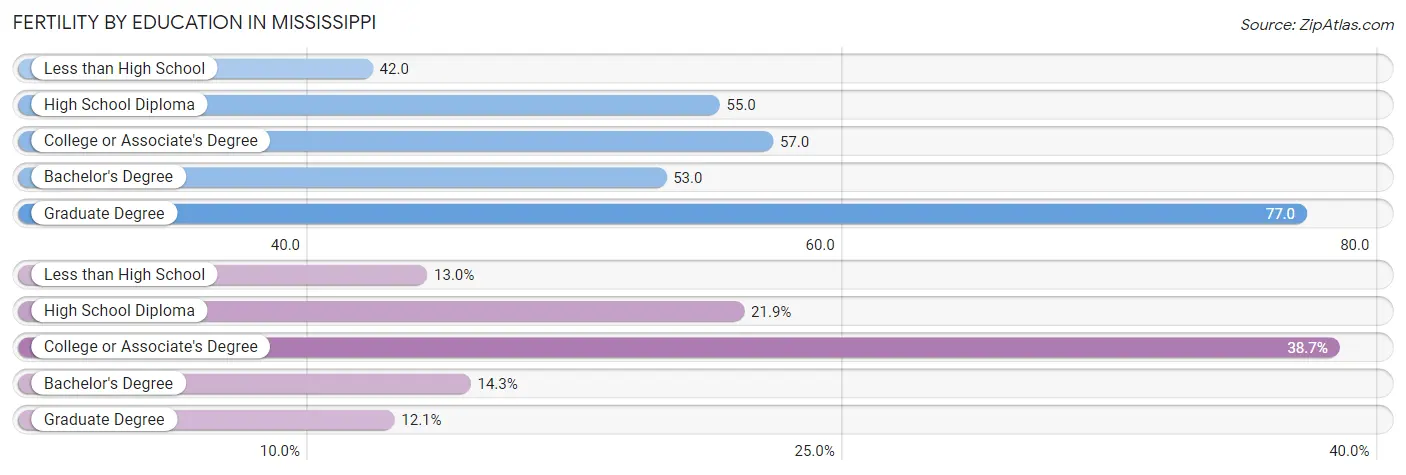
| Educational Attainment | Women with Births | Births / 1,000 Women |
| Less than High School | 4,990 (13.0%) | 42.0 |
| High School Diploma | 8,404 (21.9%) | 55.0 |
| College or Associate's Degree | 14,812 (38.7%) | 57.0 |
| Bachelor's Degree | 5,456 (14.2%) | 53.0 |
| Graduate Degree | 4,639 (12.1%) | 77.0 |
| Total | 38,301 (100.0%) | 55.0 |
Fertility by Education by Marriage Status in Mississippi
45.8% of women with births in Mississippi are unmarried. Women with the educational attainment of graduate degree are most likely to be married with 87.2% of them married at childbirth, while women with the educational attainment of high school diploma are least likely to be married with 64.8% of them unmarried at childbirth.
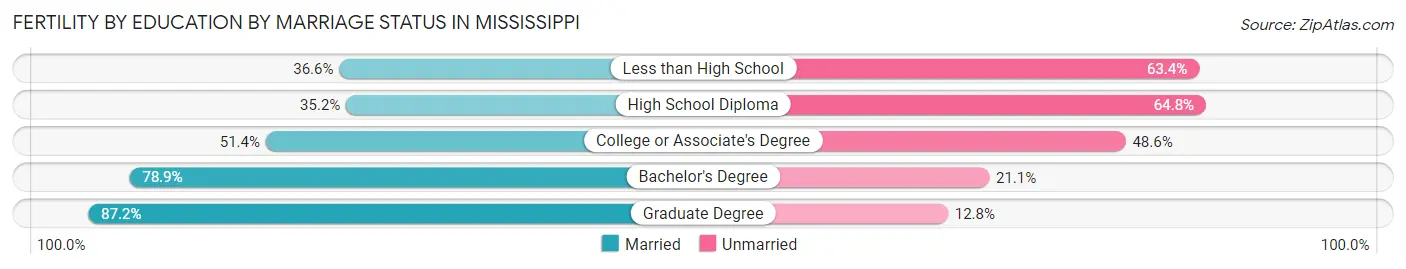
| Educational Attainment | Married | Unmarried |
| Less than High School | 1,826 (36.6%) | 3,164 (63.4%) |
| High School Diploma | 2,958 (35.2%) | 5,446 (64.8%) |
| College or Associate's Degree | 7,613 (51.4%) | 7,199 (48.6%) |
| Bachelor's Degree | 4,305 (78.9%) | 1,151 (21.1%) |
| Graduate Degree | 4,045 (87.2%) | 594 (12.8%) |
| Total | 20,759 (54.2%) | 17,542 (45.8%) |
Employment Characteristics in Mississippi
Employment by Class of Employer in Mississippi
Among the 1,232,826 employed individuals in Mississippi, private company employees (813,429 | 66.0%), state government employees (100,646 | 8.2%), and local government employees (82,569 | 6.7%) make up the most common classes of employment.
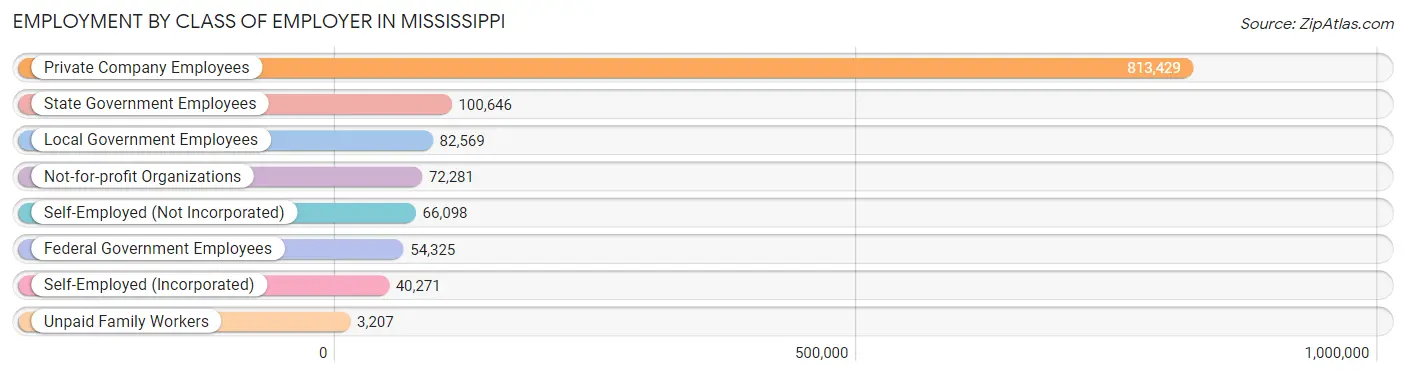
| Employer Class | # Employees | % Employees |
| Private Company Employees | 813,429 | 66.0% |
| Self-Employed (Incorporated) | 40,271 | 3.3% |
| Self-Employed (Not Incorporated) | 66,098 | 5.4% |
| Not-for-profit Organizations | 72,281 | 5.9% |
| Local Government Employees | 82,569 | 6.7% |
| State Government Employees | 100,646 | 8.2% |
| Federal Government Employees | 54,325 | 4.4% |
| Unpaid Family Workers | 3,207 | 0.3% |
| Total | 1,232,826 | 100.0% |
Employment Status by Age in Mississippi
According to the labor force statistics for Mississippi, out of the total population over 16 years of age (2,349,512), 57.2% or 1,343,921 individuals are in the labor force, with 6.4% or 86,011 of them unemployed. The age group with the highest labor force participation rate is 30 to 34 years, with 79.5% or 145,748 individuals in the labor force. Within the labor force, the 16 to 19 years age range has the highest percentage of unemployed individuals, with 18.9% or 10,369 of them being unemployed.
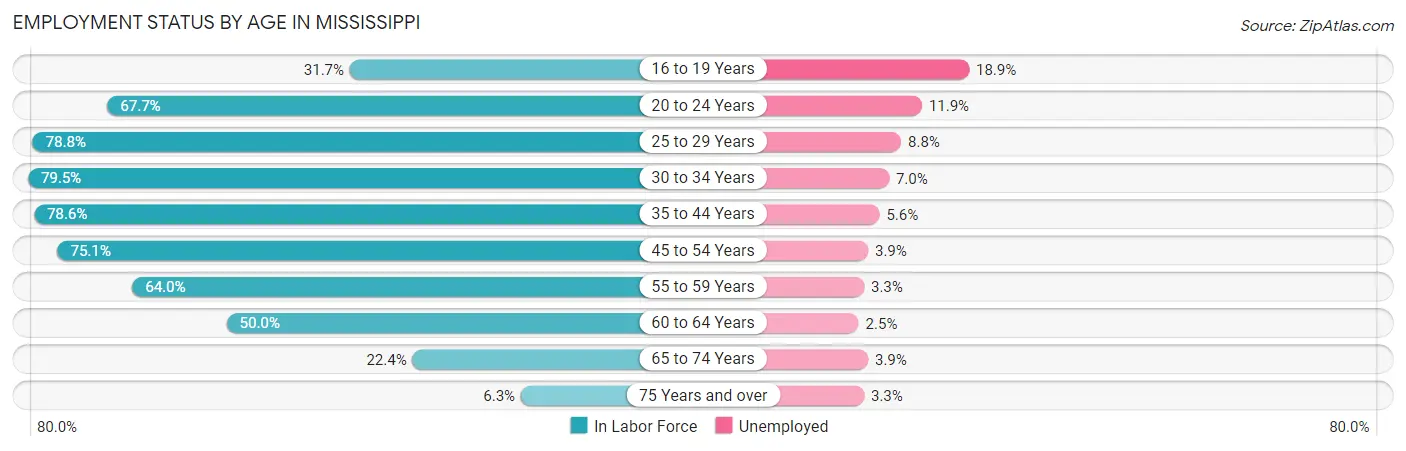
| Age Bracket | In Labor Force | Unemployed |
| 16 to 19 Years | 54,864 (31.7%) | 10,369 (18.9%) |
| 20 to 24 Years | 140,895 (67.7%) | 16,767 (11.9%) |
| 25 to 29 Years | 150,060 (78.8%) | 13,205 (8.8%) |
| 30 to 34 Years | 145,748 (79.5%) | 10,202 (7.0%) |
| 35 to 44 Years | 290,802 (78.6%) | 16,285 (5.6%) |
| 45 to 54 Years | 268,781 (75.1%) | 10,482 (3.9%) |
| 55 to 59 Years | 118,289 (64.0%) | 3,904 (3.3%) |
| 60 to 64 Years | 97,055 (50.0%) | 2,426 (2.5%) |
| 65 to 74 Years | 65,654 (22.4%) | 2,561 (3.9%) |
| 75 Years and over | 12,263 (6.3%) | 405 (3.3%) |
| Total | 1,343,921 (57.2%) | 86,011 (6.4%) |
Employment Status by Educational Attainment in Mississippi
According to labor force statistics for Mississippi, 72.3% of individuals (1,070,454) out of the total population between 25 and 64 years of age (1,480,572) are in the labor force, with 5.3% or 56,734 of them being unemployed. The group with the highest labor force participation rate are those with the educational attainment of bachelor's degree or higher, with 85.9% or 311,630 individuals in the labor force. Within the labor force, individuals with less than high school education have the highest percentage of unemployment, with 11.8% or 10,222 of them being unemployed.
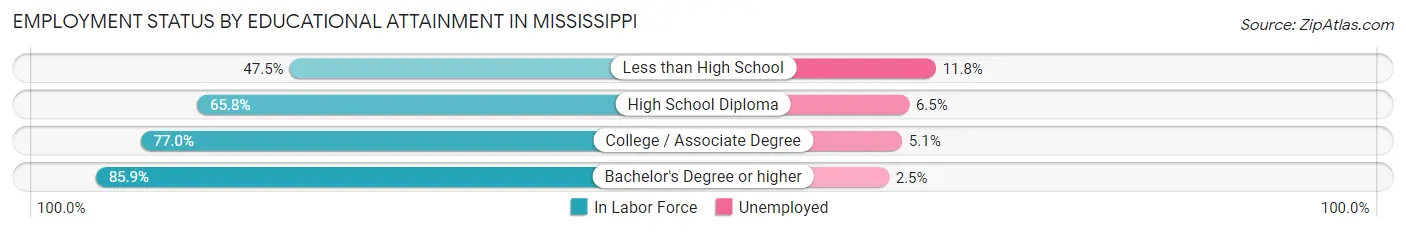
| Educational Attainment | In Labor Force | Unemployed |
| Less than High School | 86,631 (47.5%) | 21,521 (11.8%) |
| High School Diploma | 282,484 (65.8%) | 27,905 (6.5%) |
| College / Associate Degree | 389,699 (77.0%) | 25,811 (5.1%) |
| Bachelor's Degree or higher | 311,630 (85.9%) | 9,070 (2.5%) |
| Total | 1,070,454 (72.3%) | 78,470 (5.3%) |
Employment Occupations by Sex in Mississippi
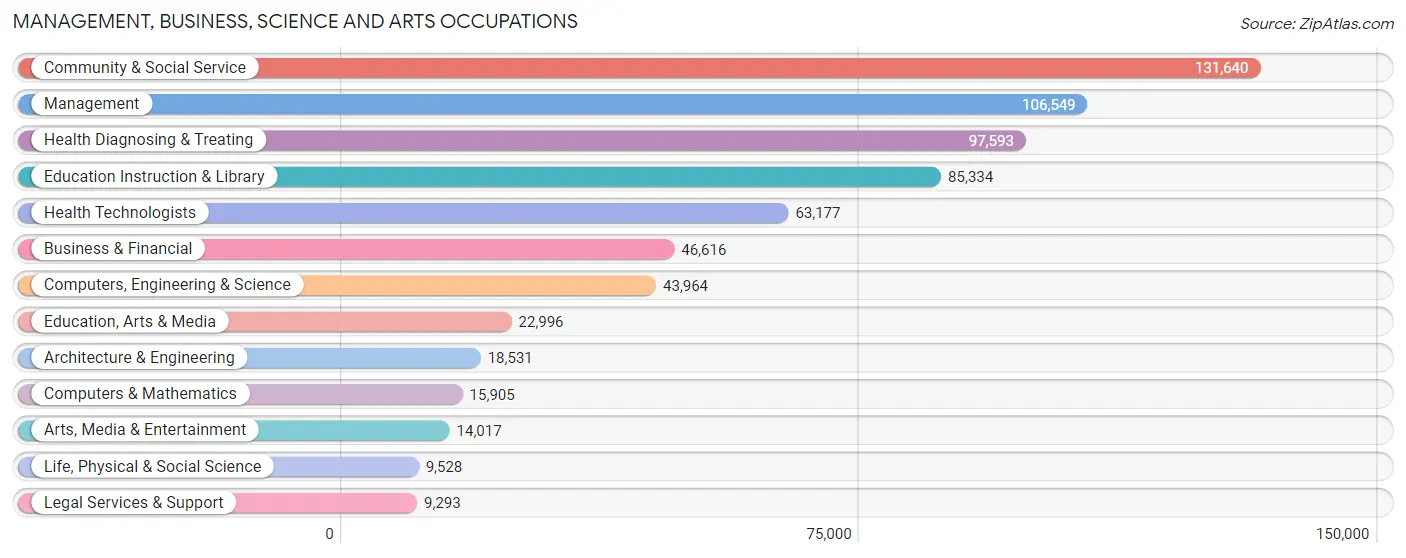
Management, Business, Science and Arts Occupations
The most common Management, Business, Science and Arts occupations in Mississippi are Community & Social Service (131,640 | 10.6%), Management (106,549 | 8.6%), Health Diagnosing & Treating (97,593 | 7.8%), Education Instruction & Library (85,334 | 6.9%), and Health Technologists (63,177 | 5.1%).
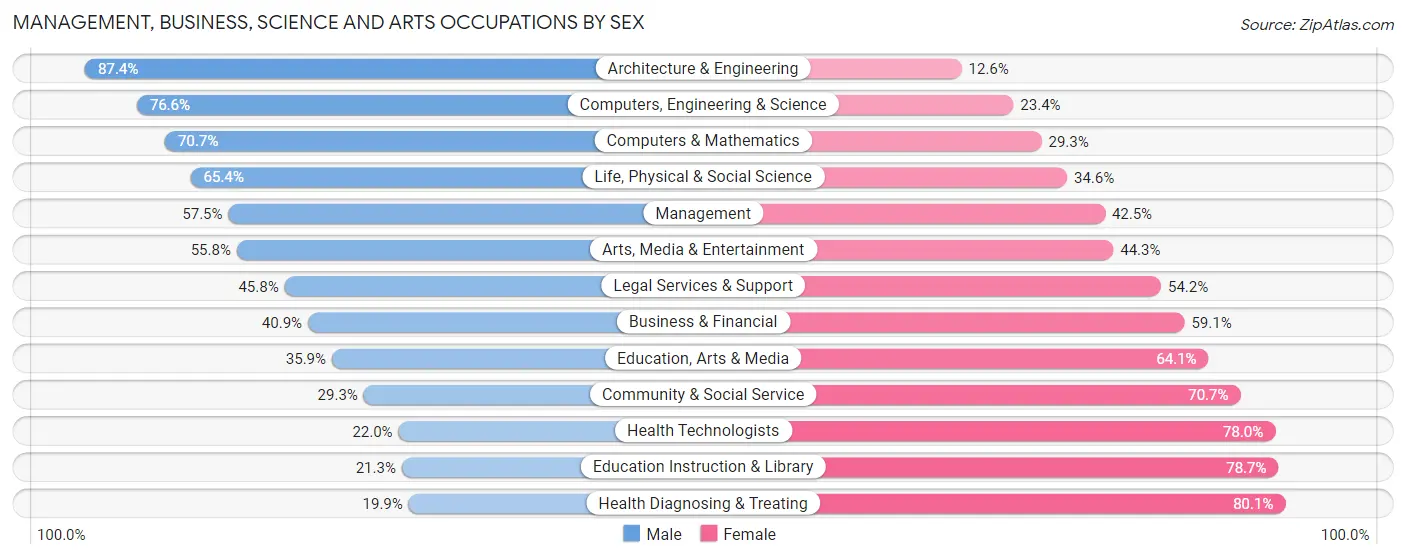
Management, Business, Science and Arts Occupations by Sex
Within the Management, Business, Science and Arts occupations in Mississippi, the most male-oriented occupations are Architecture & Engineering (87.4%), Computers, Engineering & Science (76.6%), and Computers & Mathematics (70.7%), while the most female-oriented occupations are Health Diagnosing & Treating (80.1%), Education Instruction & Library (78.7%), and Health Technologists (78.0%).
| Occupation | Male | Female |
| Management | 61,251 (57.5%) | 45,298 (42.5%) |
| Business & Financial | 19,067 (40.9%) | 27,549 (59.1%) |
| Computers, Engineering & Science | 33,671 (76.6%) | 10,293 (23.4%) |
| Computers & Mathematics | 11,247 (70.7%) | 4,658 (29.3%) |
| Architecture & Engineering | 16,194 (87.4%) | 2,337 (12.6%) |
| Life, Physical & Social Science | 6,230 (65.4%) | 3,298 (34.6%) |
| Community & Social Service | 38,528 (29.3%) | 93,112 (70.7%) |
| Education, Arts & Media | 8,259 (35.9%) | 14,737 (64.1%) |
| Legal Services & Support | 4,255 (45.8%) | 5,038 (54.2%) |
| Education Instruction & Library | 18,200 (21.3%) | 67,134 (78.7%) |
| Arts, Media & Entertainment | 7,814 (55.7%) | 6,203 (44.3%) |
| Health Diagnosing & Treating | 19,413 (19.9%) | 78,180 (80.1%) |
| Health Technologists | 13,906 (22.0%) | 49,271 (78.0%) |
| Total (Category) | 171,930 (40.3%) | 254,432 (59.7%) |
| Total (Overall) | 634,423 (50.9%) | 611,477 (49.1%) |
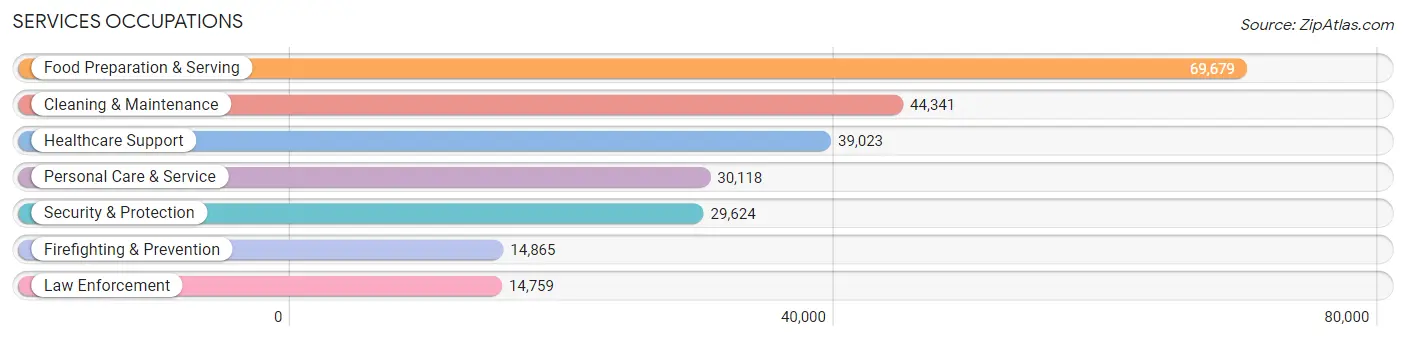
Services Occupations
The most common Services occupations in Mississippi are Food Preparation & Serving (69,679 | 5.6%), Cleaning & Maintenance (44,341 | 3.6%), Healthcare Support (39,023 | 3.1%), Personal Care & Service (30,118 | 2.4%), and Security & Protection (29,624 | 2.4%).
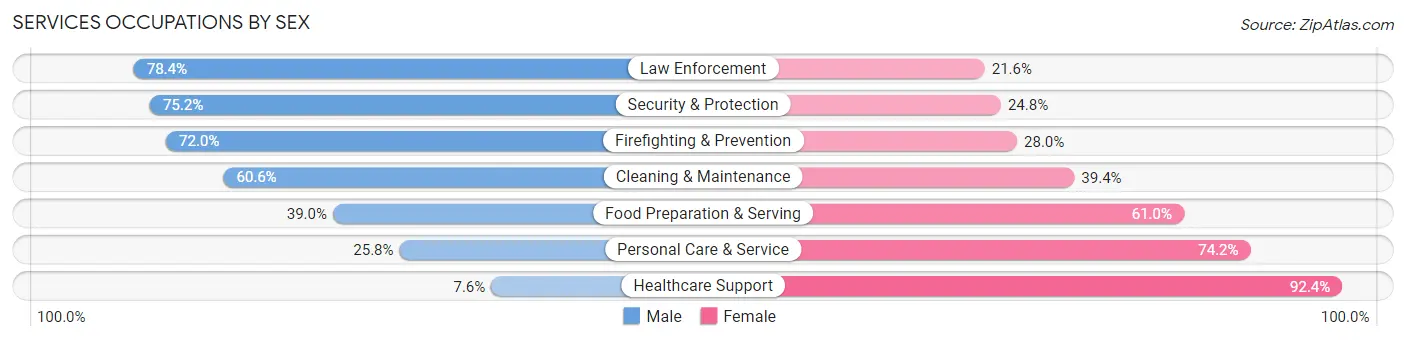
Services Occupations by Sex
Within the Services occupations in Mississippi, the most male-oriented occupations are Law Enforcement (78.4%), Security & Protection (75.2%), and Firefighting & Prevention (72.0%), while the most female-oriented occupations are Healthcare Support (92.4%), Personal Care & Service (74.2%), and Food Preparation & Serving (61.0%).
| Occupation | Male | Female |
| Healthcare Support | 2,972 (7.6%) | 36,051 (92.4%) |
| Security & Protection | 22,265 (75.2%) | 7,359 (24.8%) |
| Firefighting & Prevention | 10,698 (72.0%) | 4,167 (28.0%) |
| Law Enforcement | 11,567 (78.4%) | 3,192 (21.6%) |
| Food Preparation & Serving | 27,152 (39.0%) | 42,527 (61.0%) |
| Cleaning & Maintenance | 26,880 (60.6%) | 17,461 (39.4%) |
| Personal Care & Service | 7,768 (25.8%) | 22,350 (74.2%) |
| Total (Category) | 87,037 (40.9%) | 125,748 (59.1%) |
| Total (Overall) | 634,423 (50.9%) | 611,477 (49.1%) |
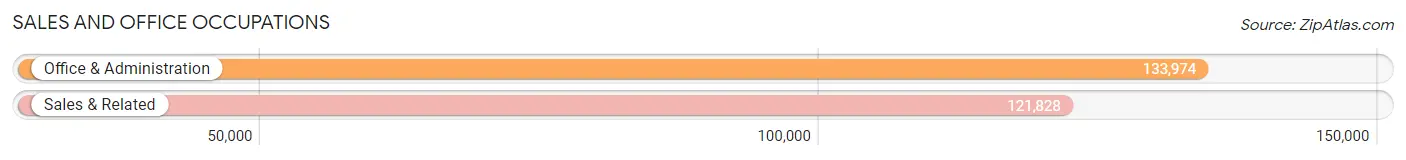
Sales and Office Occupations
The most common Sales and Office occupations in Mississippi are Office & Administration (133,974 | 10.7%), and Sales & Related (121,828 | 9.8%).
Sales and Office Occupations by Sex
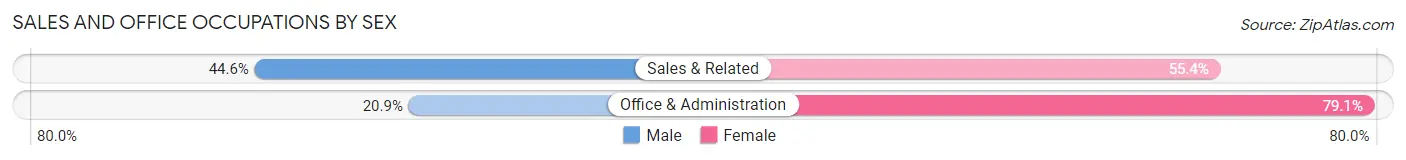
| Occupation | Male | Female |
| Sales & Related | 54,341 (44.6%) | 67,487 (55.4%) |
| Office & Administration | 27,996 (20.9%) | 105,978 (79.1%) |
| Total (Category) | 82,337 (32.2%) | 173,465 (67.8%) |
| Total (Overall) | 634,423 (50.9%) | 611,477 (49.1%) |
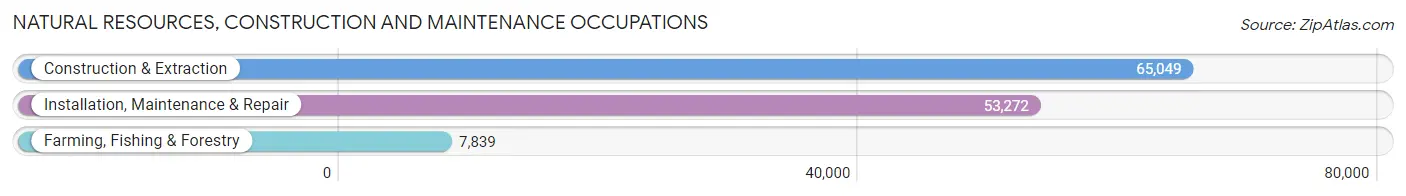
Natural Resources, Construction and Maintenance Occupations
The most common Natural Resources, Construction and Maintenance occupations in Mississippi are Construction & Extraction (65,049 | 5.2%), Installation, Maintenance & Repair (53,272 | 4.3%), and Farming, Fishing & Forestry (7,839 | 0.6%).
Natural Resources, Construction and Maintenance Occupations by Sex
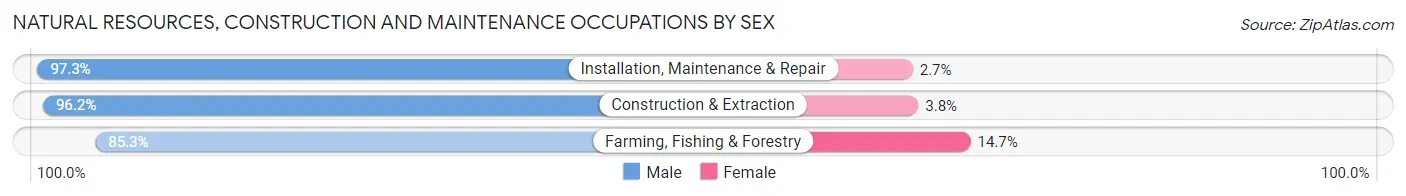
| Occupation | Male | Female |
| Farming, Fishing & Forestry | 6,686 (85.3%) | 1,153 (14.7%) |
| Construction & Extraction | 62,556 (96.2%) | 2,493 (3.8%) |
| Installation, Maintenance & Repair | 51,842 (97.3%) | 1,430 (2.7%) |
| Total (Category) | 121,084 (96.0%) | 5,076 (4.0%) |
| Total (Overall) | 634,423 (50.9%) | 611,477 (49.1%) |
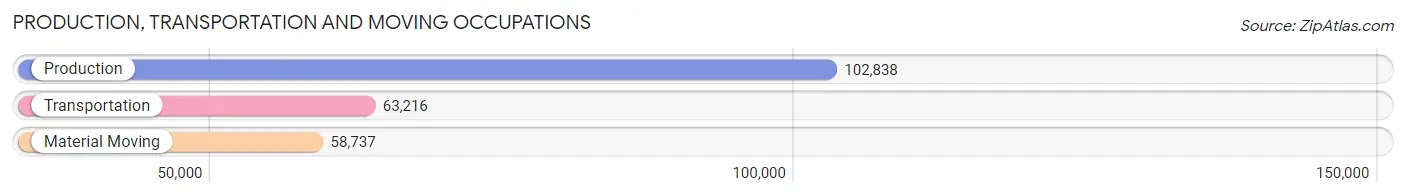
Production, Transportation and Moving Occupations
The most common Production, Transportation and Moving occupations in Mississippi are Production (102,838 | 8.3%), Transportation (63,216 | 5.1%), and Material Moving (58,737 | 4.7%).
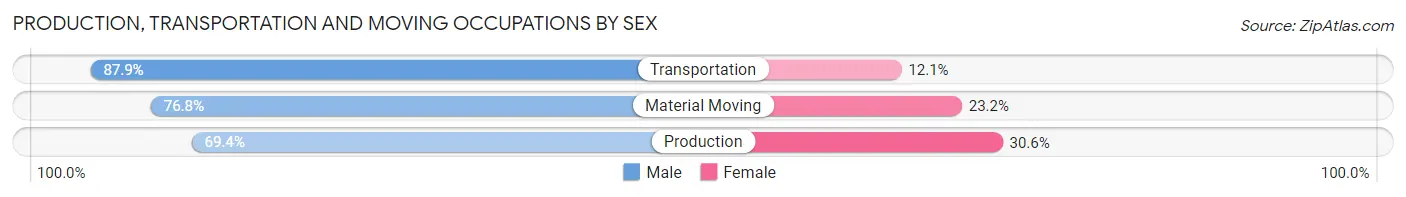
Production, Transportation and Moving Occupations by Sex
| Occupation | Male | Female |
| Production | 71,327 (69.4%) | 31,511 (30.6%) |
| Transportation | 55,572 (87.9%) | 7,644 (12.1%) |
| Material Moving | 45,136 (76.8%) | 13,601 (23.2%) |
| Total (Category) | 172,035 (76.5%) | 52,756 (23.5%) |
| Total (Overall) | 634,423 (50.9%) | 611,477 (49.1%) |
Employment Industries by Sex in Mississippi
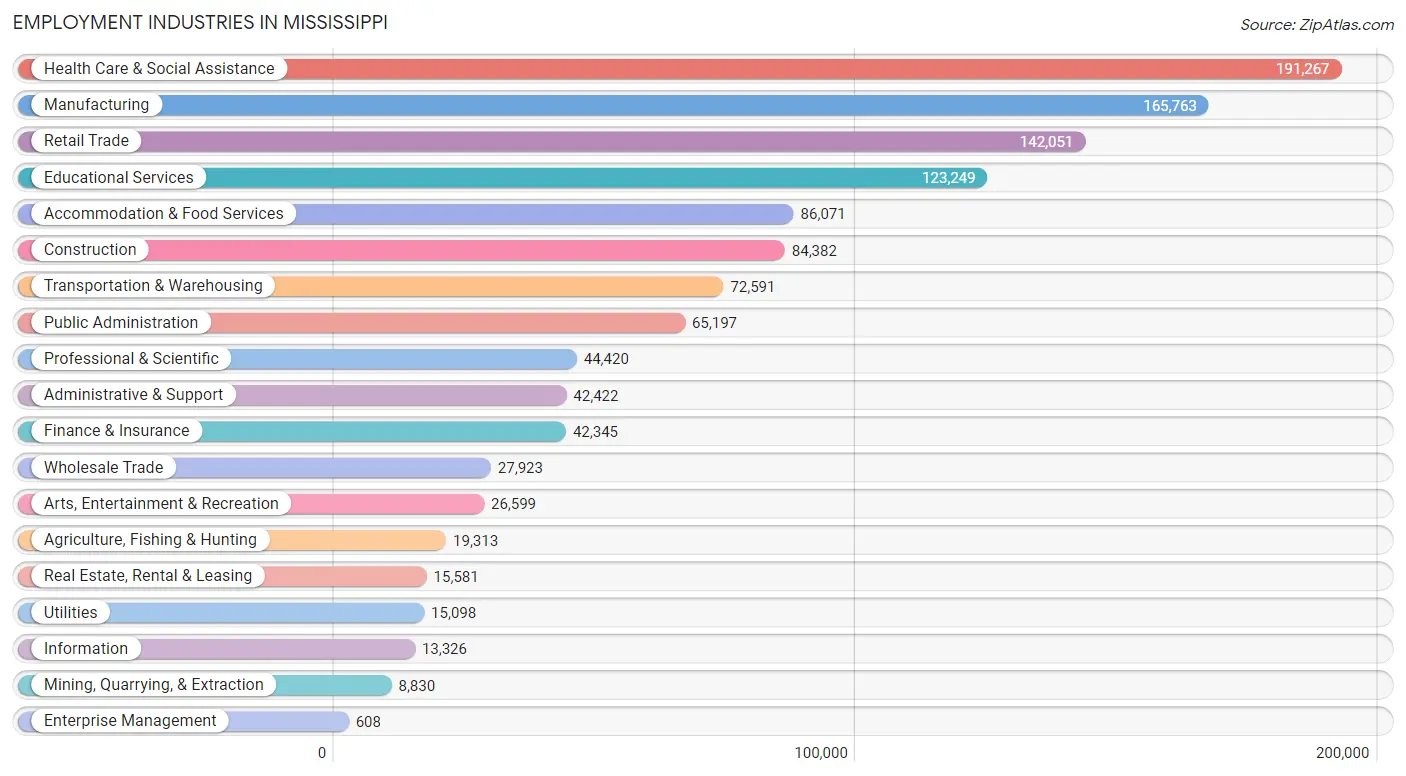
Employment Industries in Mississippi
The major employment industries in Mississippi include Health Care & Social Assistance (191,267 | 15.3%), Manufacturing (165,763 | 13.3%), Retail Trade (142,051 | 11.4%), Educational Services (123,249 | 9.9%), and Accommodation & Food Services (86,071 | 6.9%).
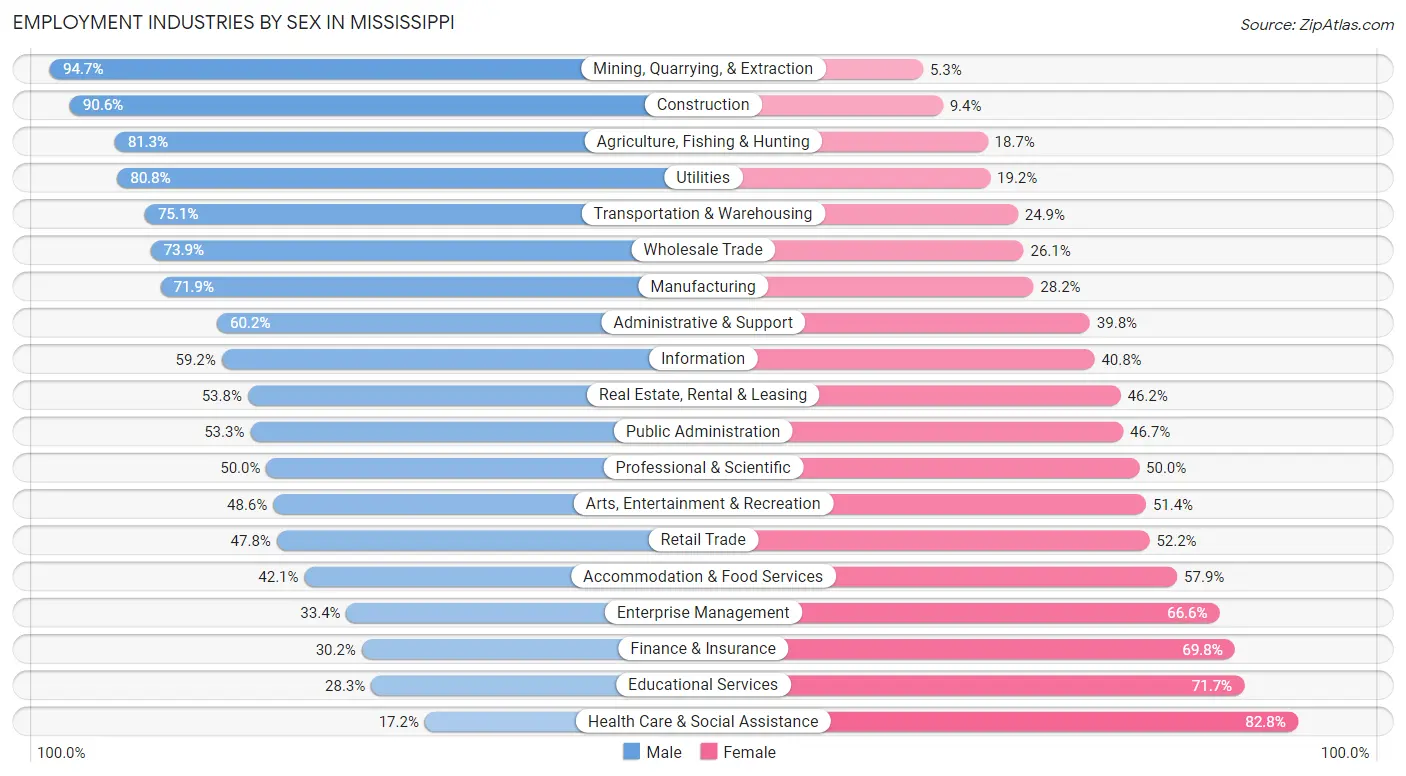
Employment Industries by Sex in Mississippi
The Mississippi industries that see more men than women are Mining, Quarrying, & Extraction (94.7%), Construction (90.6%), and Agriculture, Fishing & Hunting (81.3%), whereas the industries that tend to have a higher number of women are Health Care & Social Assistance (82.8%), Educational Services (71.7%), and Finance & Insurance (69.8%).
| Industry | Male | Female |
| Agriculture, Fishing & Hunting | 15,705 (81.3%) | 3,608 (18.7%) |
| Mining, Quarrying, & Extraction | 8,364 (94.7%) | 466 (5.3%) |
| Construction | 76,471 (90.6%) | 7,911 (9.4%) |
| Manufacturing | 119,106 (71.9%) | 46,657 (28.1%) |
| Wholesale Trade | 20,631 (73.9%) | 7,292 (26.1%) |
| Retail Trade | 67,942 (47.8%) | 74,109 (52.2%) |
| Transportation & Warehousing | 54,491 (75.1%) | 18,100 (24.9%) |
| Utilities | 12,201 (80.8%) | 2,897 (19.2%) |
| Information | 7,891 (59.2%) | 5,435 (40.8%) |
| Finance & Insurance | 12,800 (30.2%) | 29,545 (69.8%) |
| Real Estate, Rental & Leasing | 8,384 (53.8%) | 7,197 (46.2%) |
| Professional & Scientific | 22,195 (50.0%) | 22,225 (50.0%) |
| Enterprise Management | 203 (33.4%) | 405 (66.6%) |
| Administrative & Support | 25,520 (60.2%) | 16,902 (39.8%) |
| Educational Services | 34,858 (28.3%) | 88,391 (71.7%) |
| Health Care & Social Assistance | 32,862 (17.2%) | 158,405 (82.8%) |
| Arts, Entertainment & Recreation | 12,916 (48.6%) | 13,683 (51.4%) |
| Accommodation & Food Services | 36,232 (42.1%) | 49,839 (57.9%) |
| Public Administration | 34,751 (53.3%) | 30,446 (46.7%) |
| Total | 634,423 (50.9%) | 611,477 (49.1%) |
Education in Mississippi
School Enrollment in Mississippi
The most common levels of schooling among the 740,833 students in Mississippi are middle school (160,487 | 21.7%), high school (157,462 | 21.2%), and college / undergraduate (155,786 | 21.0%).
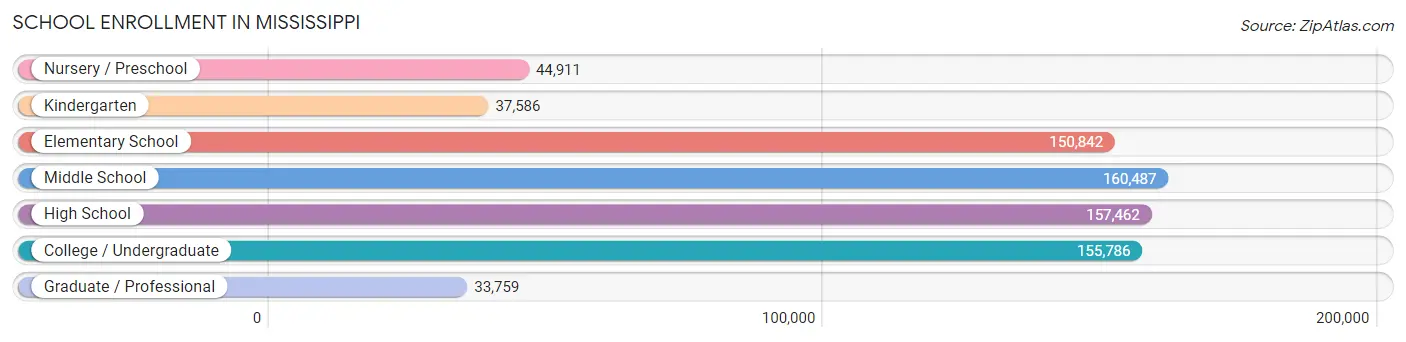
| School Level | # Students | % Students |
| Nursery / Preschool | 44,911 | 6.1% |
| Kindergarten | 37,586 | 5.1% |
| Elementary School | 150,842 | 20.4% |
| Middle School | 160,487 | 21.7% |
| High School | 157,462 | 21.2% |
| College / Undergraduate | 155,786 | 21.0% |
| Graduate / Professional | 33,759 | 4.6% |
| Total | 740,833 | 100.0% |
School Enrollment by Age by Funding Source in Mississippi
Out of a total of 740,833 students who are enrolled in schools in Mississippi, 111,125 (15.0%) attend a private institution, while the remaining 629,708 (85.0%) are enrolled in public schools. The age group of 3 to 4 year olds has the highest likelihood of being enrolled in private schools, with 12,906 (34.8% in the age bracket) enrolled. Conversely, the age group of 18 to 19 year olds has the lowest likelihood of being enrolled in a private school, with 62,140 (91.2% in the age bracket) attending a public institution.
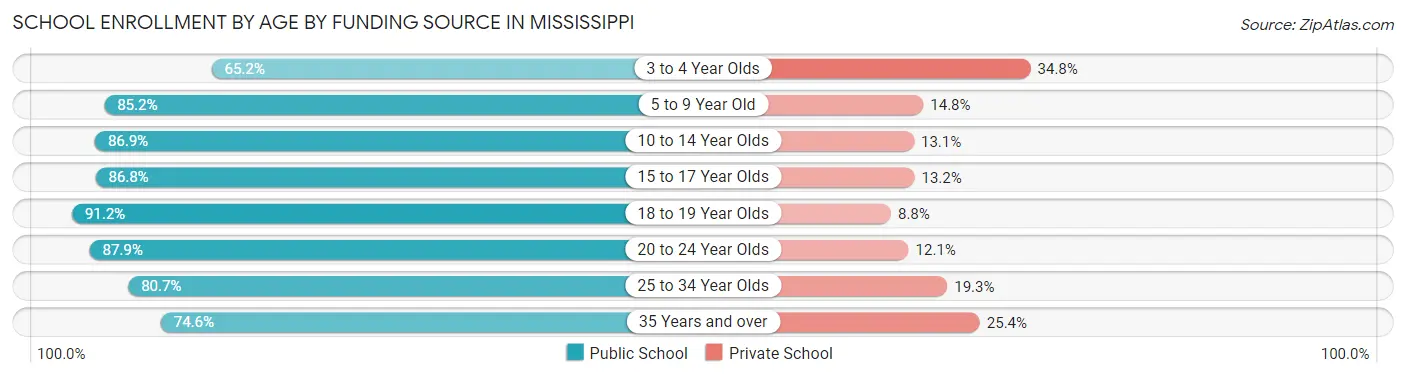
| Age Bracket | Public School | Private School |
| 3 to 4 Year Olds | 24,163 (65.2%) | 12,906 (34.8%) |
| 5 to 9 Year Old | 145,051 (85.2%) | 25,269 (14.8%) |
| 10 to 14 Year Olds | 174,532 (86.9%) | 26,329 (13.1%) |
| 15 to 17 Year Olds | 100,257 (86.8%) | 15,250 (13.2%) |
| 18 to 19 Year Olds | 62,140 (91.2%) | 6,014 (8.8%) |
| 20 to 24 Year Olds | 70,078 (87.9%) | 9,649 (12.1%) |
| 25 to 34 Year Olds | 28,854 (80.7%) | 6,901 (19.3%) |
| 35 Years and over | 24,957 (74.6%) | 8,483 (25.4%) |
| Total | 629,708 (85.0%) | 111,125 (15.0%) |
Educational Attainment by Field of Study in Mississippi
Business (104,268 | 20.9%), education (95,826 | 19.2%), science & technology (65,838 | 13.2%), arts & humanities (40,241 | 8.1%), and bio, nature & agricultural (35,348 | 7.1%) are the most common fields of study among 498,240 individuals in Mississippi who have obtained a bachelor's degree or higher.
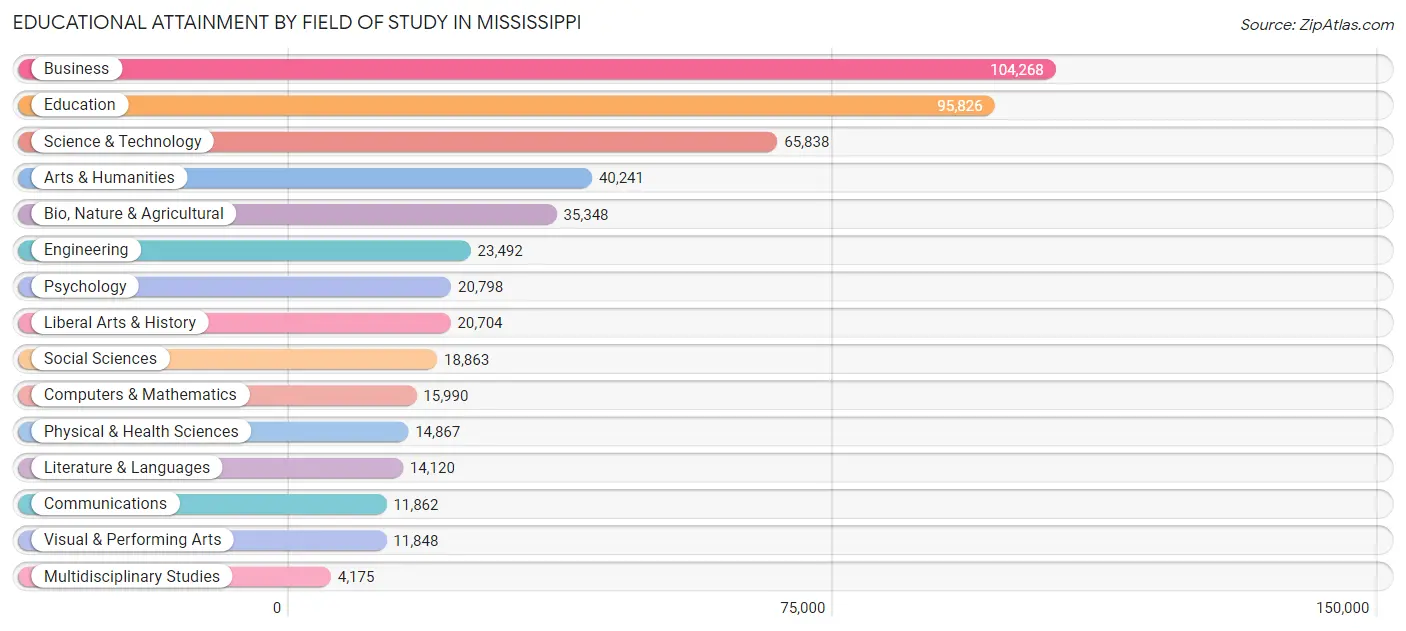
| Field of Study | # Graduates | % Graduates |
| Computers & Mathematics | 15,990 | 3.2% |
| Bio, Nature & Agricultural | 35,348 | 7.1% |
| Physical & Health Sciences | 14,867 | 3.0% |
| Psychology | 20,798 | 4.2% |
| Social Sciences | 18,863 | 3.8% |
| Engineering | 23,492 | 4.7% |
| Multidisciplinary Studies | 4,175 | 0.8% |
| Science & Technology | 65,838 | 13.2% |
| Business | 104,268 | 20.9% |
| Education | 95,826 | 19.2% |
| Literature & Languages | 14,120 | 2.8% |
| Liberal Arts & History | 20,704 | 4.2% |
| Visual & Performing Arts | 11,848 | 2.4% |
| Communications | 11,862 | 2.4% |
| Arts & Humanities | 40,241 | 8.1% |
| Total | 498,240 | 100.0% |
Transportation & Commute in Mississippi
Vehicle Availability by Sex in Mississippi
The most prevalent vehicle ownership categories in Mississippi are males with 2 vehicles (254,028, accounting for 40.5%) and females with 2 vehicles (226,720, making up 42.7%).
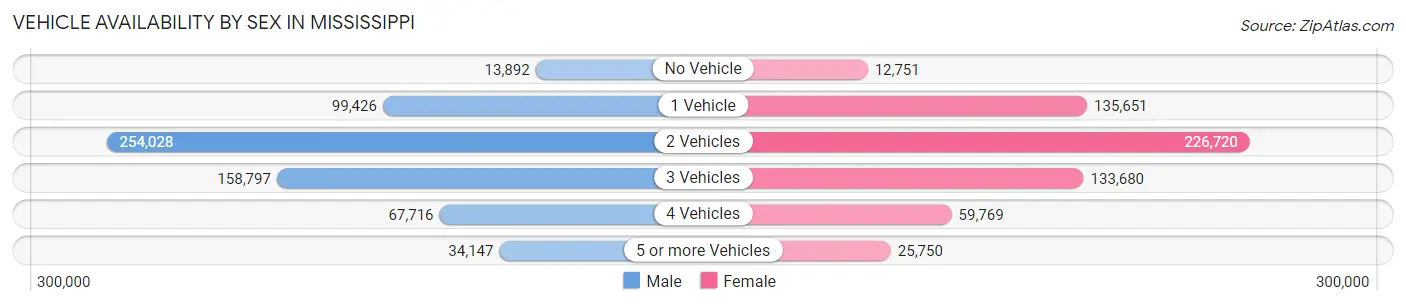
| Vehicles Available | Male | Female |
| No Vehicle | 13,892 (2.2%) | 12,751 (2.1%) |
| 1 Vehicle | 99,426 (15.8%) | 135,651 (22.8%) |
| 2 Vehicles | 254,028 (40.5%) | 226,720 (38.2%) |
| 3 Vehicles | 158,797 (25.3%) | 133,680 (22.5%) |
| 4 Vehicles | 67,716 (10.8%) | 59,769 (10.1%) |
| 5 or more Vehicles | 34,147 (5.4%) | 25,750 (4.3%) |
| Total | 628,006 (100.0%) | 594,321 (100.0%) |
Commute Time in Mississippi
The most frequently occuring commute durations in Mississippi are 15 to 19 minutes (192,445 commuters, 16.4%), 10 to 14 minutes (175,268 commuters, 14.9%), and 20 to 24 minutes (168,729 commuters, 14.3%).
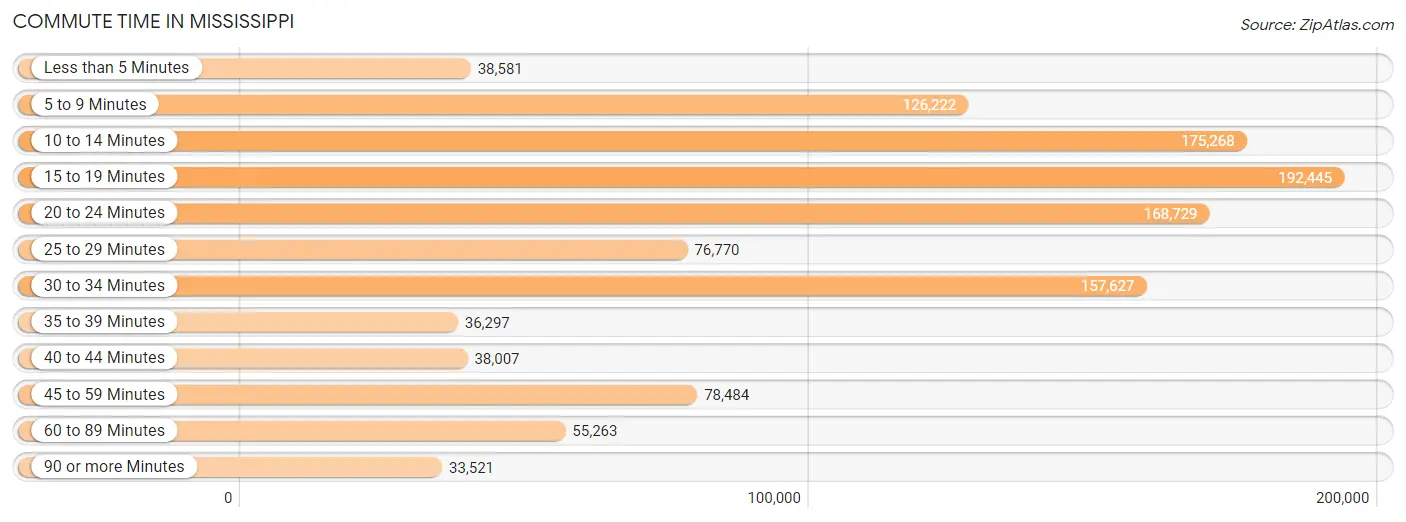
| Commute Time | # Commuters | % Commuters |
| Less than 5 Minutes | 38,581 | 3.3% |
| 5 to 9 Minutes | 126,222 | 10.7% |
| 10 to 14 Minutes | 175,268 | 14.9% |
| 15 to 19 Minutes | 192,445 | 16.4% |
| 20 to 24 Minutes | 168,729 | 14.3% |
| 25 to 29 Minutes | 76,770 | 6.5% |
| 30 to 34 Minutes | 157,627 | 13.4% |
| 35 to 39 Minutes | 36,297 | 3.1% |
| 40 to 44 Minutes | 38,007 | 3.2% |
| 45 to 59 Minutes | 78,484 | 6.7% |
| 60 to 89 Minutes | 55,263 | 4.7% |
| 90 or more Minutes | 33,521 | 2.9% |
Commute Time by Sex in Mississippi
The most common commute times in Mississippi are 15 to 19 minutes (95,727 commuters, 15.8%) for males and 15 to 19 minutes (96,718 commuters, 17.0%) for females.
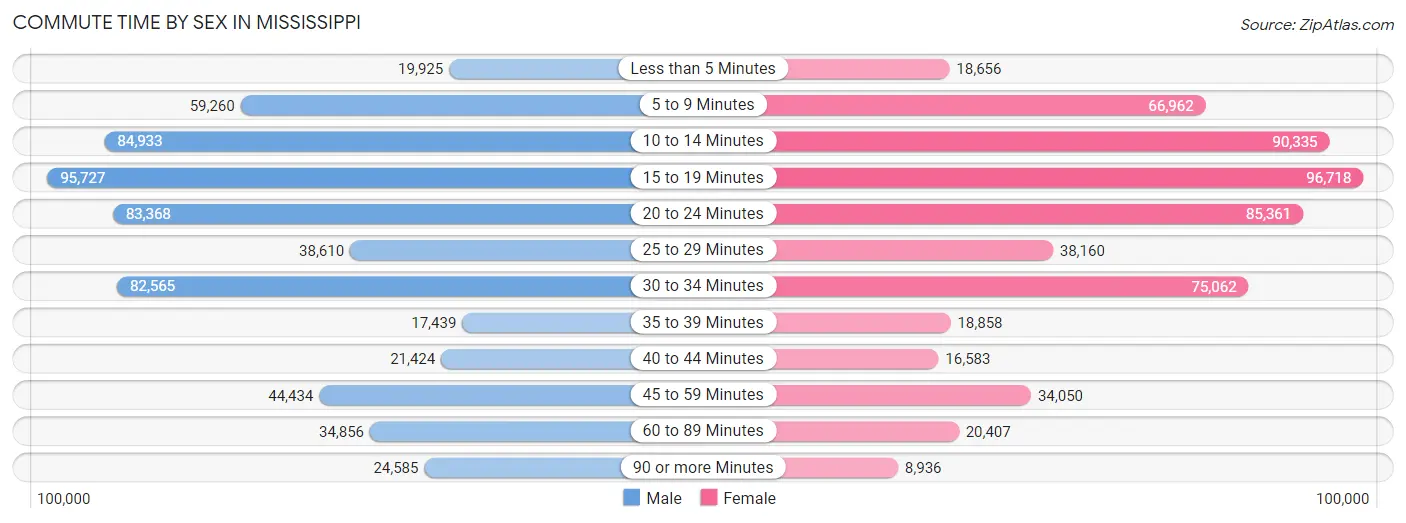
| Commute Time | Male | Female |
| Less than 5 Minutes | 19,925 (3.3%) | 18,656 (3.3%) |
| 5 to 9 Minutes | 59,260 (9.8%) | 66,962 (11.7%) |
| 10 to 14 Minutes | 84,933 (14.0%) | 90,335 (15.9%) |
| 15 to 19 Minutes | 95,727 (15.8%) | 96,718 (17.0%) |
| 20 to 24 Minutes | 83,368 (13.7%) | 85,361 (15.0%) |
| 25 to 29 Minutes | 38,610 (6.4%) | 38,160 (6.7%) |
| 30 to 34 Minutes | 82,565 (13.6%) | 75,062 (13.2%) |
| 35 to 39 Minutes | 17,439 (2.9%) | 18,858 (3.3%) |
| 40 to 44 Minutes | 21,424 (3.5%) | 16,583 (2.9%) |
| 45 to 59 Minutes | 44,434 (7.3%) | 34,050 (6.0%) |
| 60 to 89 Minutes | 34,856 (5.7%) | 20,407 (3.6%) |
| 90 or more Minutes | 24,585 (4.1%) | 8,936 (1.6%) |
Time of Departure to Work by Sex in Mississippi
The most frequent times of departure to work in Mississippi are 7:00 AM to 7:29 AM (88,878, 14.6%) for males and 7:00 AM to 7:29 AM (109,814, 19.3%) for females.
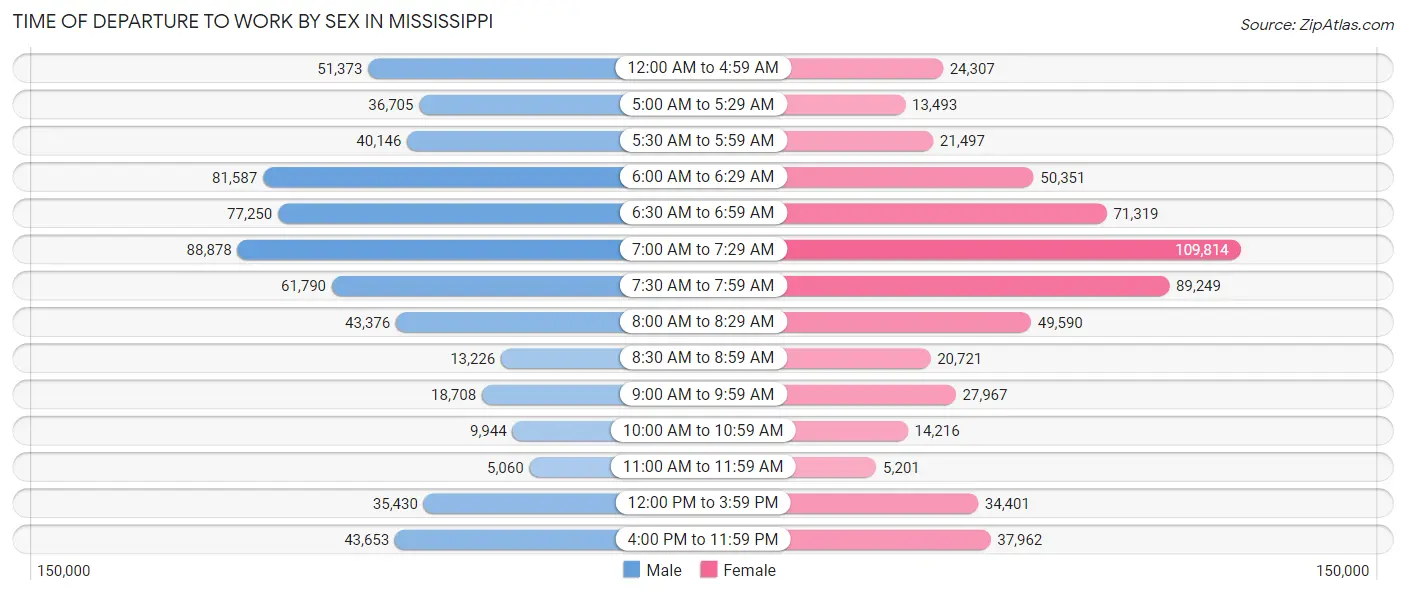
| Time of Departure | Male | Female |
| 12:00 AM to 4:59 AM | 51,373 (8.5%) | 24,307 (4.3%) |
| 5:00 AM to 5:29 AM | 36,705 (6.0%) | 13,493 (2.4%) |
| 5:30 AM to 5:59 AM | 40,146 (6.6%) | 21,497 (3.8%) |
| 6:00 AM to 6:29 AM | 81,587 (13.4%) | 50,351 (8.8%) |
| 6:30 AM to 6:59 AM | 77,250 (12.7%) | 71,319 (12.5%) |
| 7:00 AM to 7:29 AM | 88,878 (14.6%) | 109,814 (19.3%) |
| 7:30 AM to 7:59 AM | 61,790 (10.2%) | 89,249 (15.7%) |
| 8:00 AM to 8:29 AM | 43,376 (7.1%) | 49,590 (8.7%) |
| 8:30 AM to 8:59 AM | 13,226 (2.2%) | 20,721 (3.6%) |
| 9:00 AM to 9:59 AM | 18,708 (3.1%) | 27,967 (4.9%) |
| 10:00 AM to 10:59 AM | 9,944 (1.6%) | 14,216 (2.5%) |
| 11:00 AM to 11:59 AM | 5,060 (0.8%) | 5,201 (0.9%) |
| 12:00 PM to 3:59 PM | 35,430 (5.8%) | 34,401 (6.0%) |
| 4:00 PM to 11:59 PM | 43,653 (7.2%) | 37,962 (6.7%) |
| Total | 607,126 (100.0%) | 570,088 (100.0%) |
Housing Occupancy in Mississippi
Occupancy by Ownership in Mississippi
Of the total 1,121,269 dwellings in Mississippi, owner-occupied units account for 775,465 (69.2%), while renter-occupied units make up 345,804 (30.8%).
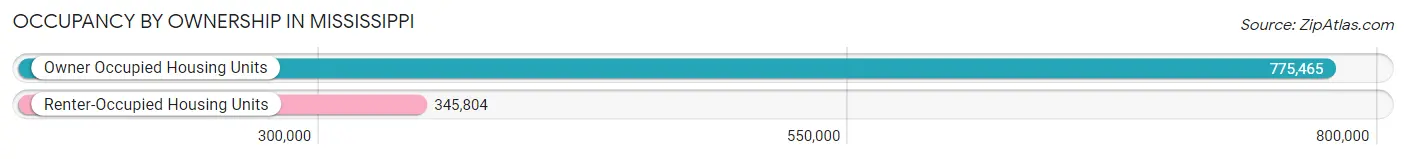
| Occupancy | # Housing Units | % Housing Units |
| Owner Occupied Housing Units | 775,465 | 69.2% |
| Renter-Occupied Housing Units | 345,804 | 30.8% |
| Total Occupied Housing Units | 1,121,269 | 100.0% |
Occupancy by Household Size in Mississippi
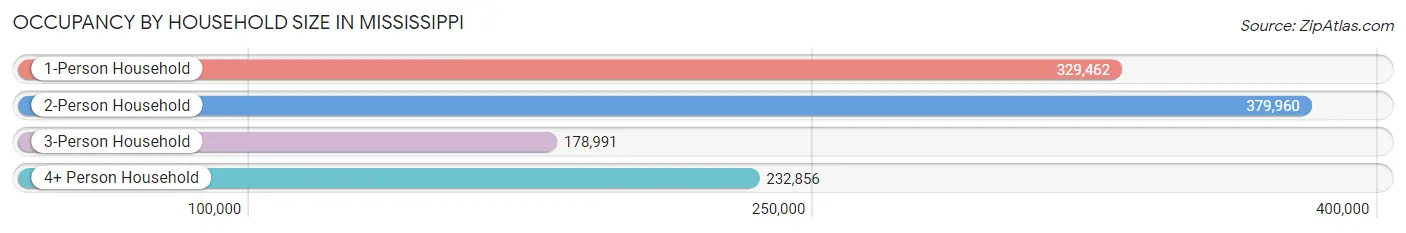
| Household Size | # Housing Units | % Housing Units |
| 1-Person Household | 329,462 | 29.4% |
| 2-Person Household | 379,960 | 33.9% |
| 3-Person Household | 178,991 | 16.0% |
| 4+ Person Household | 232,856 | 20.8% |
| Total Housing Units | 1,121,269 | 100.0% |
Occupancy by Ownership by Household Size in Mississippi
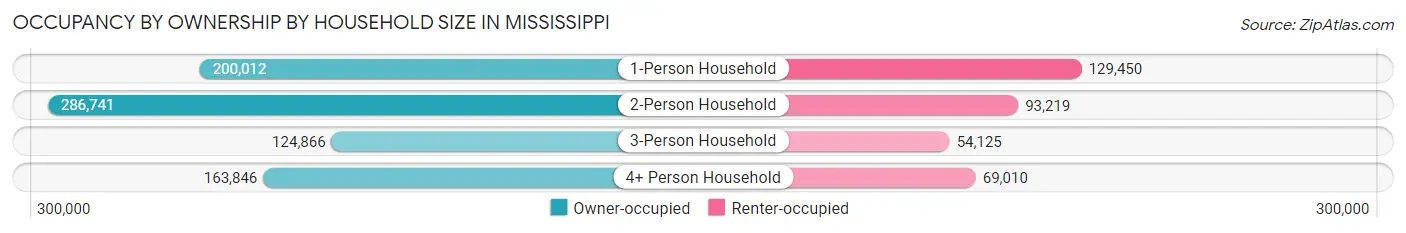
| Household Size | Owner-occupied | Renter-occupied |
| 1-Person Household | 200,012 (60.7%) | 129,450 (39.3%) |
| 2-Person Household | 286,741 (75.5%) | 93,219 (24.5%) |
| 3-Person Household | 124,866 (69.8%) | 54,125 (30.2%) |
| 4+ Person Household | 163,846 (70.4%) | 69,010 (29.6%) |
| Total Housing Units | 775,465 (69.2%) | 345,804 (30.8%) |
Occupancy by Educational Attainment in Mississippi
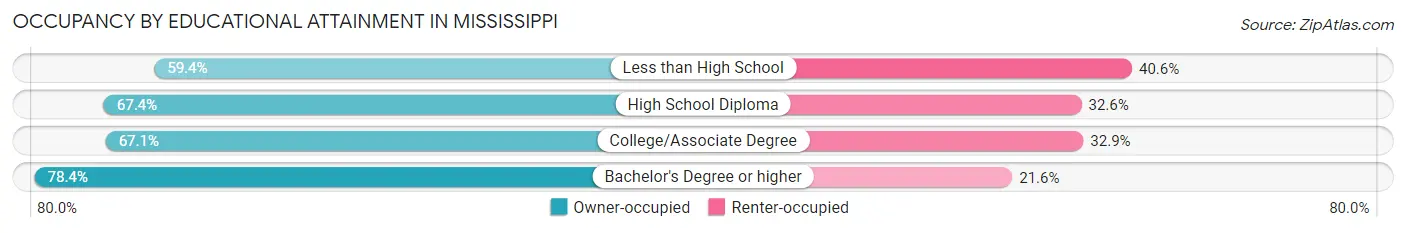
| Household Size | Owner-occupied | Renter-occupied |
| Less than High School | 82,510 (59.4%) | 56,338 (40.6%) |
| High School Diploma | 206,576 (67.4%) | 99,810 (32.6%) |
| College/Associate Degree | 260,051 (67.1%) | 127,352 (32.9%) |
| Bachelor's Degree or higher | 226,328 (78.4%) | 62,304 (21.6%) |
Occupancy by Age of Householder in Mississippi
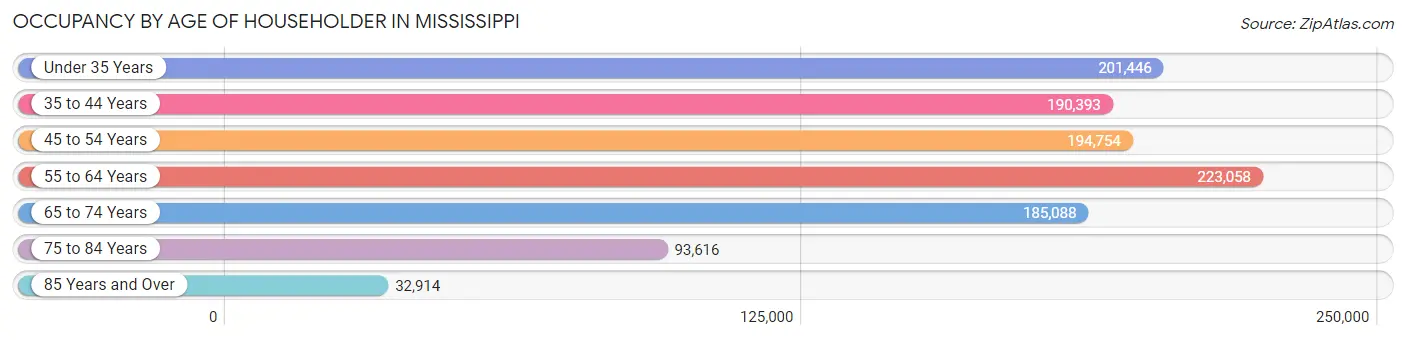
| Age Bracket | # Households | % Households |
| Under 35 Years | 201,446 | 18.0% |
| 35 to 44 Years | 190,393 | 17.0% |
| 45 to 54 Years | 194,754 | 17.4% |
| 55 to 64 Years | 223,058 | 19.9% |
| 65 to 74 Years | 185,088 | 16.5% |
| 75 to 84 Years | 93,616 | 8.4% |
| 85 Years and Over | 32,914 | 2.9% |
| Total | 1,121,269 | 100.0% |
Housing Finances in Mississippi
Median Income by Occupancy in Mississippi
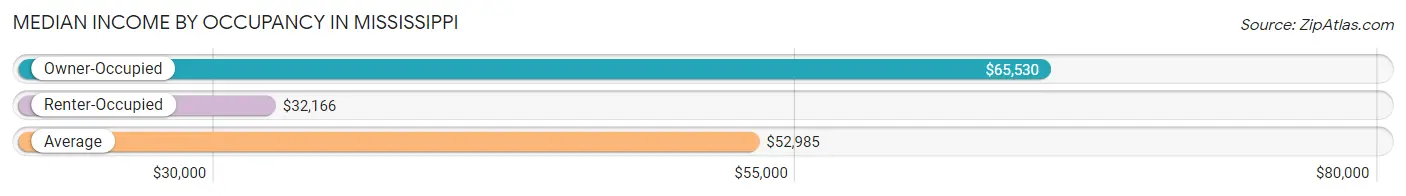
| Occupancy Type | # Households | Median Income |
| Owner-Occupied | 775,465 (69.2%) | $65,530 |
| Renter-Occupied | 345,804 (30.8%) | $32,166 |
| Average | 1,121,269 (100.0%) | $52,985 |
Occupancy by Householder Income Bracket in Mississippi
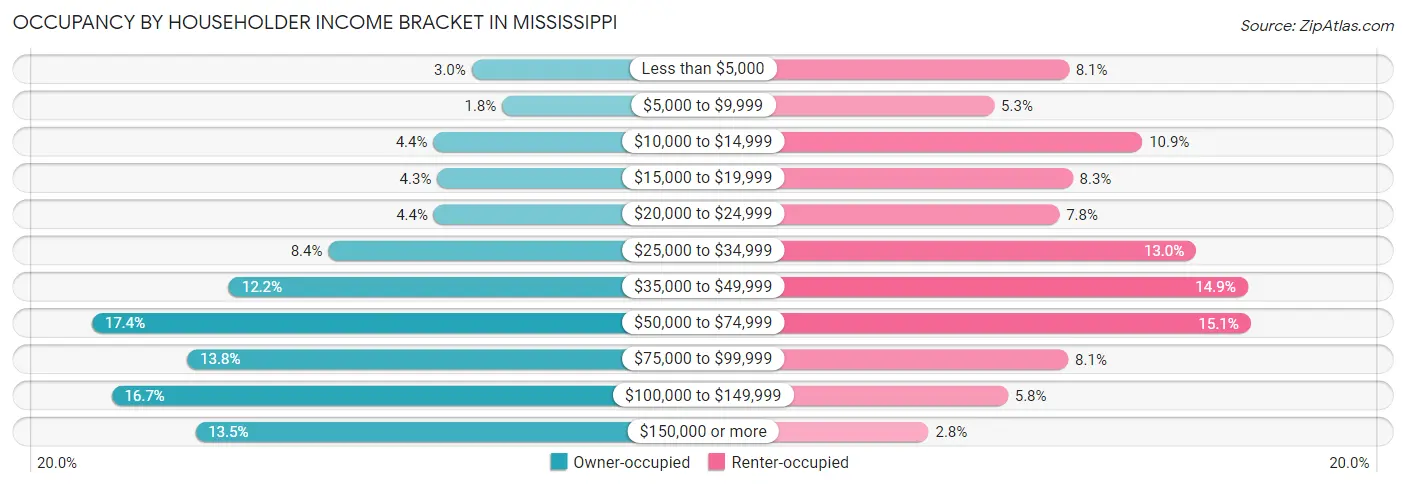
| Income Bracket | Owner-occupied | Renter-occupied |
| Less than $5,000 | 23,050 (3.0%) | 28,085 (8.1%) |
| $5,000 to $9,999 | 14,042 (1.8%) | 18,250 (5.3%) |
| $10,000 to $14,999 | 34,388 (4.4%) | 37,771 (10.9%) |
| $15,000 to $19,999 | 33,199 (4.3%) | 28,610 (8.3%) |
| $20,000 to $24,999 | 34,235 (4.4%) | 26,840 (7.8%) |
| $25,000 to $34,999 | 65,376 (8.4%) | 44,865 (13.0%) |
| $35,000 to $49,999 | 94,730 (12.2%) | 51,636 (14.9%) |
| $50,000 to $74,999 | 135,256 (17.4%) | 52,058 (15.0%) |
| $75,000 to $99,999 | 107,101 (13.8%) | 27,993 (8.1%) |
| $100,000 to $149,999 | 129,429 (16.7%) | 20,073 (5.8%) |
| $150,000 or more | 104,659 (13.5%) | 9,623 (2.8%) |
| Total | 775,465 (100.0%) | 345,804 (100.0%) |
Monthly Housing Cost Tiers in Mississippi
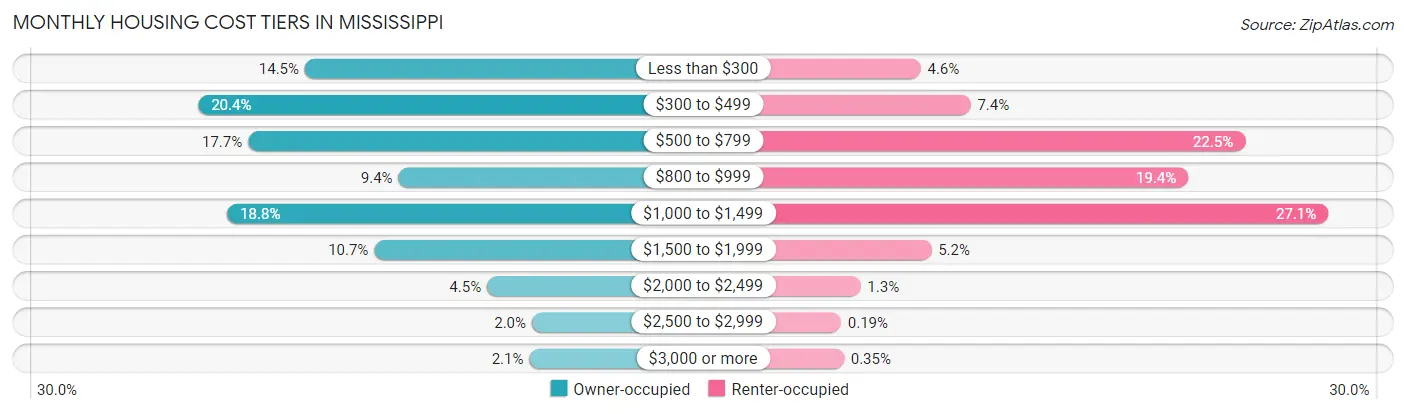
| Monthly Cost | Owner-occupied | Renter-occupied |
| Less than $300 | 112,559 (14.5%) | 15,857 (4.6%) |
| $300 to $499 | 158,286 (20.4%) | 25,416 (7.3%) |
| $500 to $799 | 136,911 (17.7%) | 77,854 (22.5%) |
| $800 to $999 | 72,486 (9.3%) | 66,992 (19.4%) |
| $1,000 to $1,499 | 145,908 (18.8%) | 93,726 (27.1%) |
| $1,500 to $1,999 | 82,904 (10.7%) | 17,902 (5.2%) |
| $2,000 to $2,499 | 34,559 (4.5%) | 4,389 (1.3%) |
| $2,500 to $2,999 | 15,385 (2.0%) | 649 (0.2%) |
| $3,000 or more | 16,467 (2.1%) | 1,222 (0.4%) |
| Total | 775,465 (100.0%) | 345,804 (100.0%) |
Physical Housing Characteristics in Mississippi
Housing Structures in Mississippi
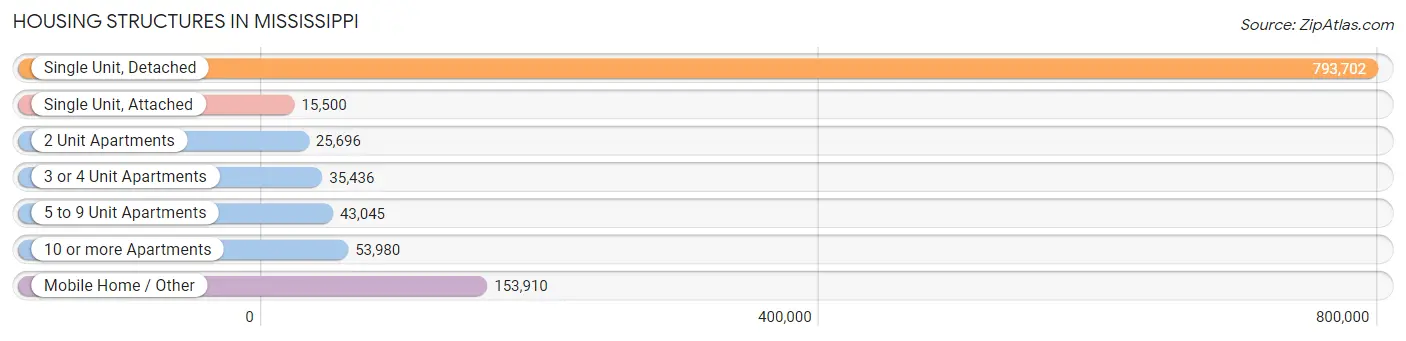
| Structure Type | # Housing Units | % Housing Units |
| Single Unit, Detached | 793,702 | 70.8% |
| Single Unit, Attached | 15,500 | 1.4% |
| 2 Unit Apartments | 25,696 | 2.3% |
| 3 or 4 Unit Apartments | 35,436 | 3.2% |
| 5 to 9 Unit Apartments | 43,045 | 3.8% |
| 10 or more Apartments | 53,980 | 4.8% |
| Mobile Home / Other | 153,910 | 13.7% |
| Total | 1,121,269 | 100.0% |
Housing Structures by Occupancy in Mississippi
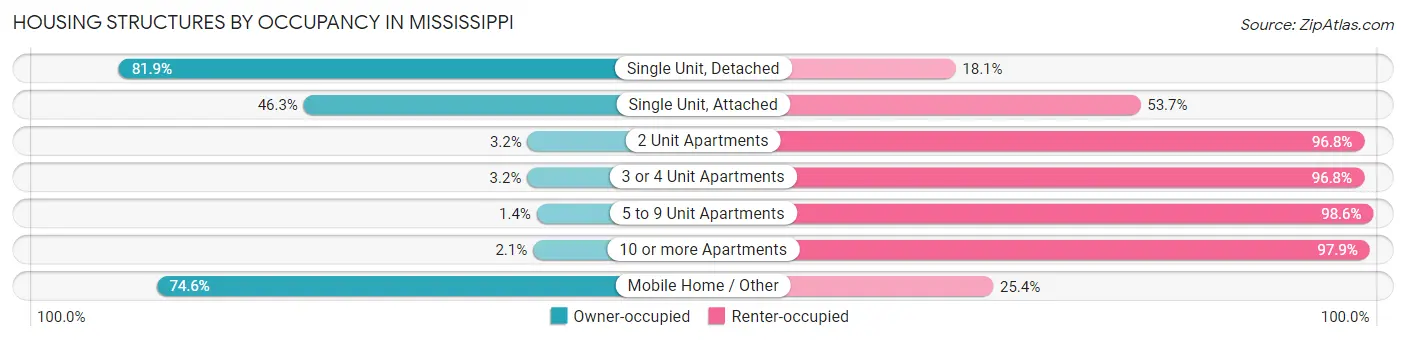
| Structure Type | Owner-occupied | Renter-occupied |
| Single Unit, Detached | 649,774 (81.9%) | 143,928 (18.1%) |
| Single Unit, Attached | 7,170 (46.3%) | 8,330 (53.7%) |
| 2 Unit Apartments | 813 (3.2%) | 24,883 (96.8%) |
| 3 or 4 Unit Apartments | 1,140 (3.2%) | 34,296 (96.8%) |
| 5 to 9 Unit Apartments | 604 (1.4%) | 42,441 (98.6%) |
| 10 or more Apartments | 1,131 (2.1%) | 52,849 (97.9%) |
| Mobile Home / Other | 114,833 (74.6%) | 39,077 (25.4%) |
| Total | 775,465 (69.2%) | 345,804 (30.8%) |
Housing Structures by Number of Rooms in Mississippi
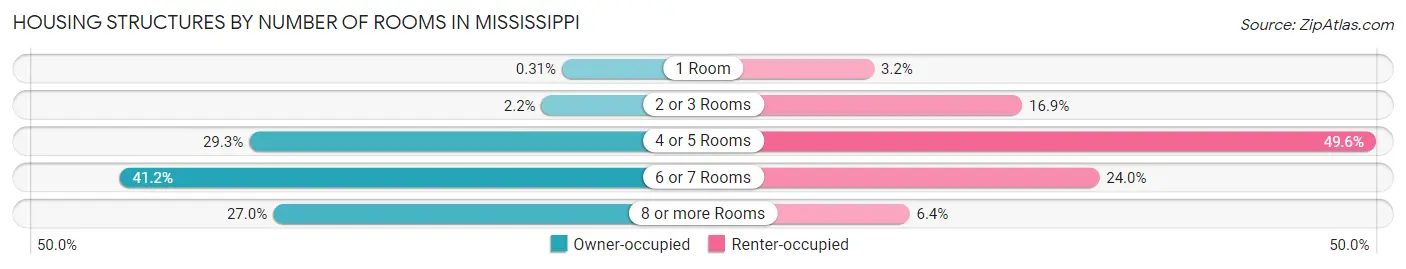
| Number of Rooms | Owner-occupied | Renter-occupied |
| 1 Room | 2,389 (0.3%) | 10,920 (3.2%) |
| 2 or 3 Rooms | 17,042 (2.2%) | 58,257 (16.9%) |
| 4 or 5 Rooms | 226,843 (29.2%) | 171,393 (49.6%) |
| 6 or 7 Rooms | 319,584 (41.2%) | 82,963 (24.0%) |
| 8 or more Rooms | 209,607 (27.0%) | 22,271 (6.4%) |
| Total | 775,465 (100.0%) | 345,804 (100.0%) |
Housing Structure by Heating Type in Mississippi
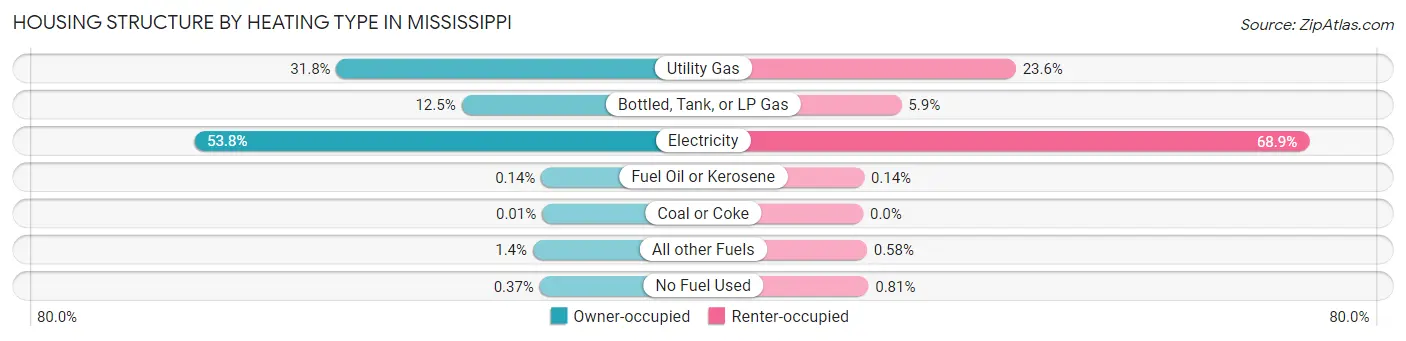
| Heating Type | Owner-occupied | Renter-occupied |
| Utility Gas | 246,608 (31.8%) | 81,610 (23.6%) |
| Bottled, Tank, or LP Gas | 96,591 (12.5%) | 20,504 (5.9%) |
| Electricity | 417,174 (53.8%) | 238,377 (68.9%) |
| Fuel Oil or Kerosene | 1,055 (0.1%) | 485 (0.1%) |
| Coal or Coke | 67 (0.0%) | 11 (0.0%) |
| All other Fuels | 11,095 (1.4%) | 2,000 (0.6%) |
| No Fuel Used | 2,875 (0.4%) | 2,817 (0.8%) |
| Total | 775,465 (100.0%) | 345,804 (100.0%) |
Household Vehicle Usage in Mississippi
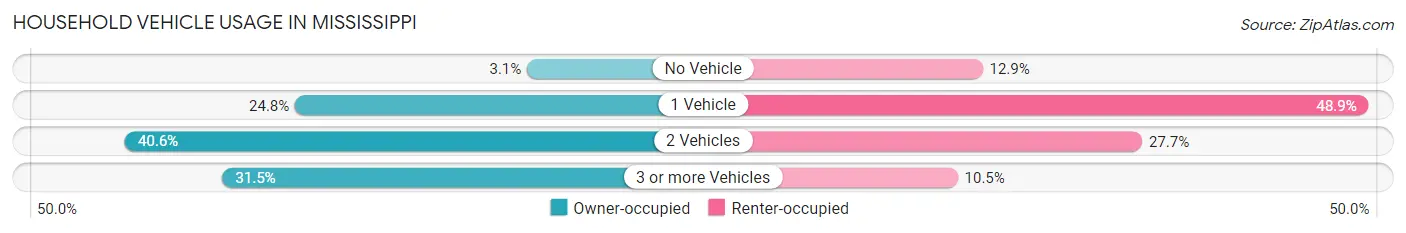
| Vehicles per Household | Owner-occupied | Renter-occupied |
| No Vehicle | 23,978 (3.1%) | 44,446 (12.9%) |
| 1 Vehicle | 191,910 (24.7%) | 169,045 (48.9%) |
| 2 Vehicles | 315,101 (40.6%) | 95,922 (27.7%) |
| 3 or more Vehicles | 244,476 (31.5%) | 36,391 (10.5%) |
| Total | 775,465 (100.0%) | 345,804 (100.0%) |
Real Estate & Mortgages in Mississippi
Real Estate and Mortgage Overview in Mississippi
| Characteristic | Without Mortgage | With Mortgage |
| Housing Units | 388,185 | 387,280 |
| Median Property Value | $112,300 | $180,800 |
| Median Household Income | $48,478 | $71,245 |
| Monthly Housing Costs | $400 | $15,919 |
| Real Estate Taxes | $790 | $52,521 |
Property Value by Mortgage Status in Mississippi
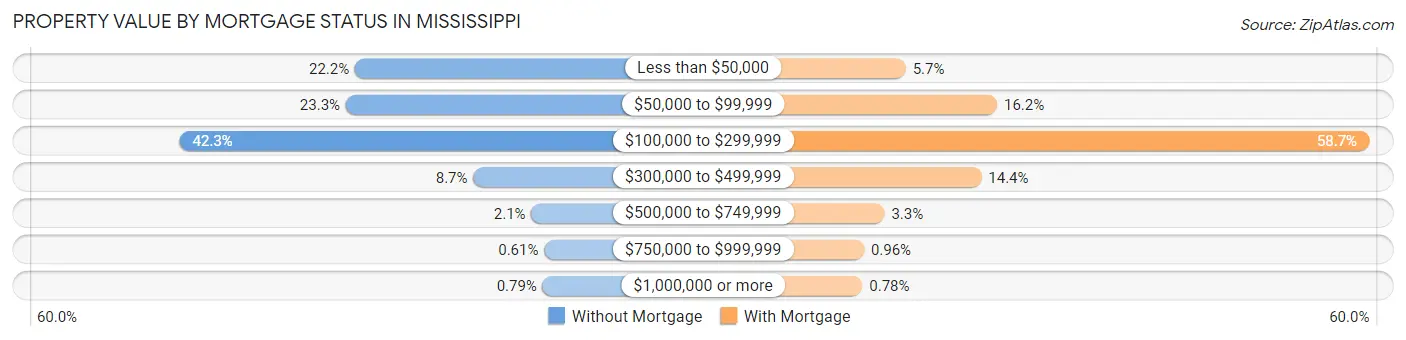
| Property Value | Without Mortgage | With Mortgage |
| Less than $50,000 | 86,295 (22.2%) | 22,200 (5.7%) |
| $50,000 to $99,999 | 90,365 (23.3%) | 62,626 (16.2%) |
| $100,000 to $299,999 | 164,198 (42.3%) | 227,211 (58.7%) |
| $300,000 to $499,999 | 33,814 (8.7%) | 55,684 (14.4%) |
| $500,000 to $749,999 | 8,082 (2.1%) | 12,800 (3.3%) |
| $750,000 to $999,999 | 2,351 (0.6%) | 3,730 (1.0%) |
| $1,000,000 or more | 3,080 (0.8%) | 3,029 (0.8%) |
| Total | 388,185 (100.0%) | 387,280 (100.0%) |
Household Income by Mortgage Status in Mississippi
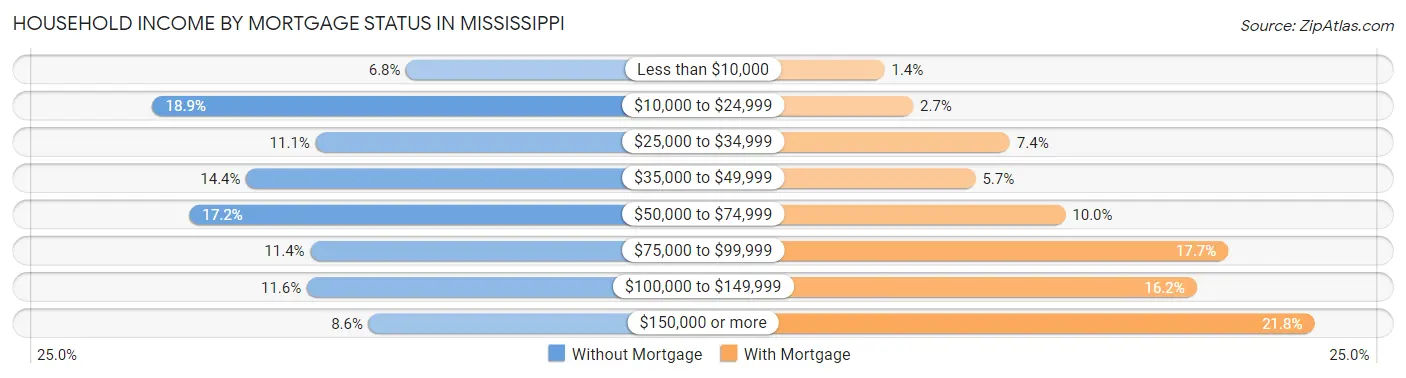
| Household Income | Without Mortgage | With Mortgage |
| Less than $10,000 | 26,478 (6.8%) | 5,332 (1.4%) |
| $10,000 to $24,999 | 73,370 (18.9%) | 10,614 (2.7%) |
| $25,000 to $34,999 | 43,247 (11.1%) | 28,452 (7.3%) |
| $35,000 to $49,999 | 56,047 (14.4%) | 22,129 (5.7%) |
| $50,000 to $74,999 | 66,570 (17.2%) | 38,683 (10.0%) |
| $75,000 to $99,999 | 44,211 (11.4%) | 68,686 (17.7%) |
| $100,000 to $149,999 | 44,848 (11.6%) | 62,890 (16.2%) |
| $150,000 or more | 33,414 (8.6%) | 84,581 (21.8%) |
| Total | 388,185 (100.0%) | 387,280 (100.0%) |
Property Value to Household Income Ratio in Mississippi
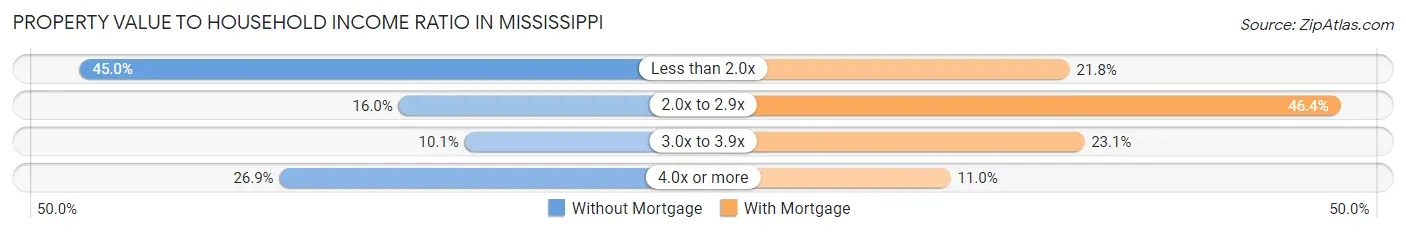
| Value-to-Income Ratio | Without Mortgage | With Mortgage |
| Less than 2.0x | 174,738 (45.0%) | 84,327 (21.8%) |
| 2.0x to 2.9x | 62,254 (16.0%) | 179,533 (46.4%) |
| 3.0x to 3.9x | 39,031 (10.1%) | 89,435 (23.1%) |
| 4.0x or more | 104,282 (26.9%) | 42,402 (11.0%) |
| Total | 388,185 (100.0%) | 387,280 (100.0%) |
Real Estate Taxes by Mortgage Status in Mississippi
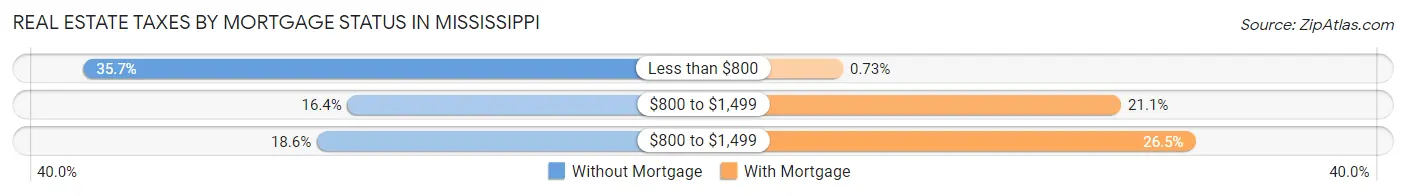
| Property Taxes | Without Mortgage | With Mortgage |
| Less than $800 | 138,587 (35.7%) | 2,830 (0.7%) |
| $800 to $1,499 | 63,645 (16.4%) | 81,511 (21.0%) |
| $800 to $1,499 | 72,360 (18.6%) | 102,516 (26.5%) |
| Total | 388,185 (100.0%) | 387,280 (100.0%) |
Health & Disability in Mississippi
Health Insurance Coverage by Age in Mississippi
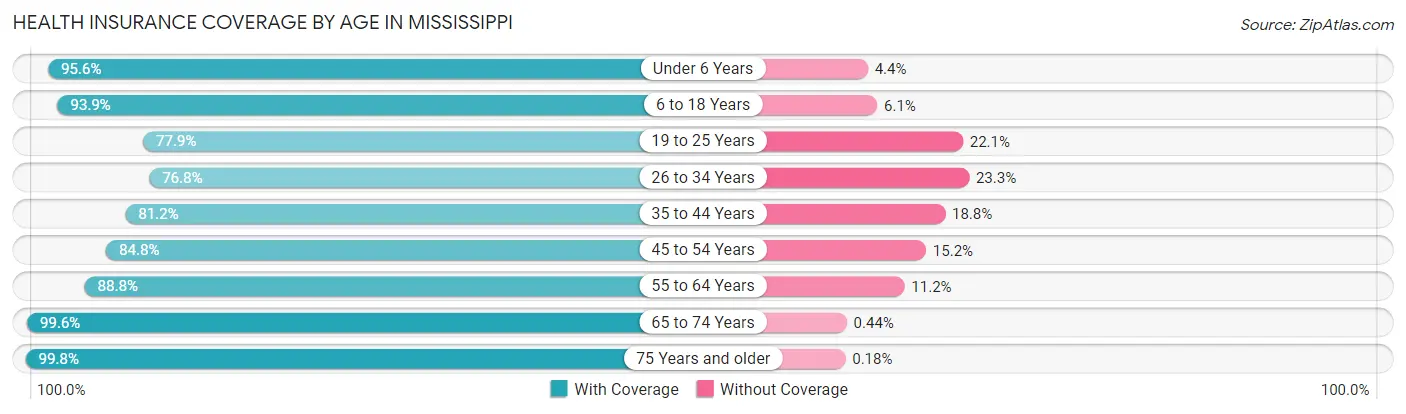
| Age Bracket | With Coverage | Without Coverage |
| Under 6 Years | 205,299 (95.6%) | 9,386 (4.4%) |
| 6 to 18 Years | 490,134 (93.9%) | 31,951 (6.1%) |
| 19 to 25 Years | 220,179 (77.9%) | 62,428 (22.1%) |
| 26 to 34 Years | 247,183 (76.7%) | 74,860 (23.3%) |
| 35 to 44 Years | 289,529 (81.2%) | 66,982 (18.8%) |
| 45 to 54 Years | 296,455 (84.8%) | 53,219 (15.2%) |
| 55 to 64 Years | 330,926 (88.8%) | 41,777 (11.2%) |
| 65 to 74 Years | 286,884 (99.6%) | 1,276 (0.4%) |
| 75 Years and older | 183,081 (99.8%) | 330 (0.2%) |
| Total | 2,549,670 (88.2%) | 342,209 (11.8%) |
Health Insurance Coverage by Citizenship Status in Mississippi
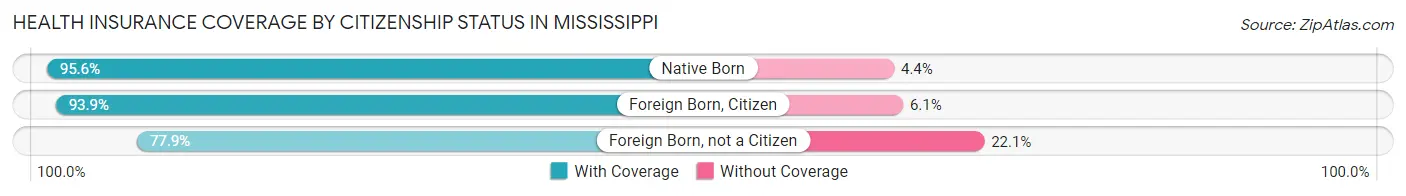
| Citizenship Status | With Coverage | Without Coverage |
| Native Born | 205,299 (95.6%) | 9,386 (4.4%) |
| Foreign Born, Citizen | 490,134 (93.9%) | 31,951 (6.1%) |
| Foreign Born, not a Citizen | 220,179 (77.9%) | 62,428 (22.1%) |
Health Insurance Coverage by Household Income in Mississippi
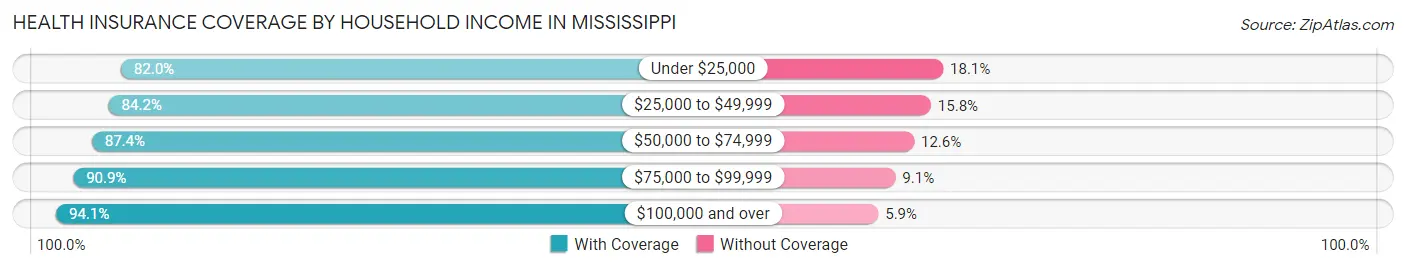
| Household Income | With Coverage | Without Coverage |
| Under $25,000 | 435,155 (82.0%) | 95,841 (18.0%) |
| $25,000 to $49,999 | 504,586 (84.2%) | 94,408 (15.8%) |
| $50,000 to $74,999 | 433,073 (87.4%) | 62,433 (12.6%) |
| $75,000 to $99,999 | 353,279 (90.9%) | 35,404 (9.1%) |
| $100,000 and over | 790,387 (94.1%) | 49,589 (5.9%) |
Public vs Private Health Insurance Coverage by Age in Mississippi
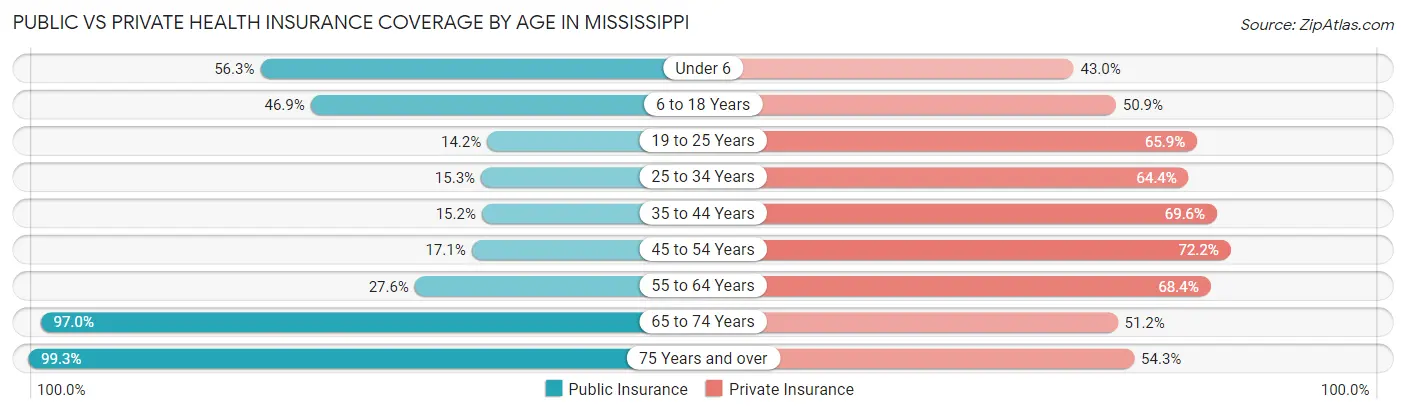
| Age Bracket | Public Insurance | Private Insurance |
| Under 6 | 120,782 (56.3%) | 92,368 (43.0%) |
| 6 to 18 Years | 245,033 (46.9%) | 265,564 (50.9%) |
| 19 to 25 Years | 40,055 (14.2%) | 186,363 (65.9%) |
| 25 to 34 Years | 49,272 (15.3%) | 207,311 (64.4%) |
| 35 to 44 Years | 54,006 (15.1%) | 248,185 (69.6%) |
| 45 to 54 Years | 59,603 (17.1%) | 252,362 (72.2%) |
| 55 to 64 Years | 102,839 (27.6%) | 255,040 (68.4%) |
| 65 to 74 Years | 279,615 (97.0%) | 147,518 (51.2%) |
| 75 Years and over | 182,200 (99.3%) | 99,533 (54.3%) |
| Total | 1,133,405 (39.2%) | 1,754,244 (60.7%) |
Disability Status by Sex by Age in Mississippi
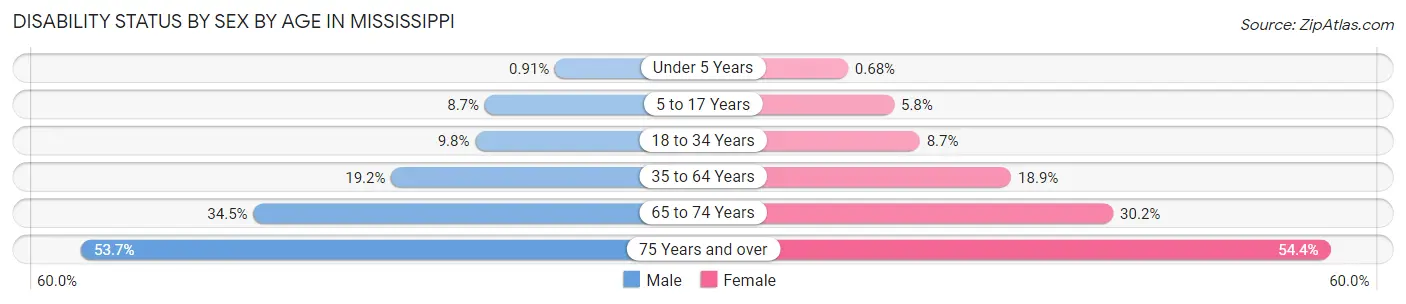
| Age Bracket | Male | Female |
| Under 5 Years | 830 (0.9%) | 593 (0.7%) |
| 5 to 17 Years | 22,783 (8.7%) | 14,637 (5.8%) |
| 18 to 34 Years | 31,096 (9.8%) | 29,007 (8.7%) |
| 35 to 64 Years | 98,218 (19.2%) | 106,817 (18.9%) |
| 65 to 74 Years | 46,020 (34.5%) | 46,798 (30.2%) |
| 75 Years and over | 39,459 (53.7%) | 59,821 (54.4%) |
Disability Class by Sex by Age in Mississippi
Disability Class: Hearing Difficulty
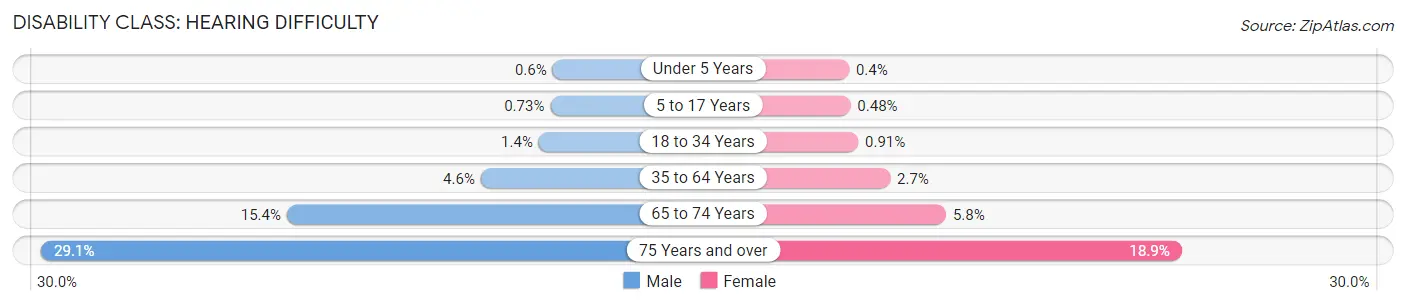
| Age Bracket | Male | Female |
| Under 5 Years | 550 (0.6%) | 352 (0.4%) |
| 5 to 17 Years | 1,890 (0.7%) | 1,218 (0.5%) |
| 18 to 34 Years | 4,332 (1.4%) | 3,049 (0.9%) |
| 35 to 64 Years | 23,590 (4.6%) | 15,208 (2.7%) |
| 65 to 74 Years | 20,526 (15.4%) | 8,984 (5.8%) |
| 75 Years and over | 21,366 (29.1%) | 20,801 (18.9%) |
Disability Class: Vision Difficulty
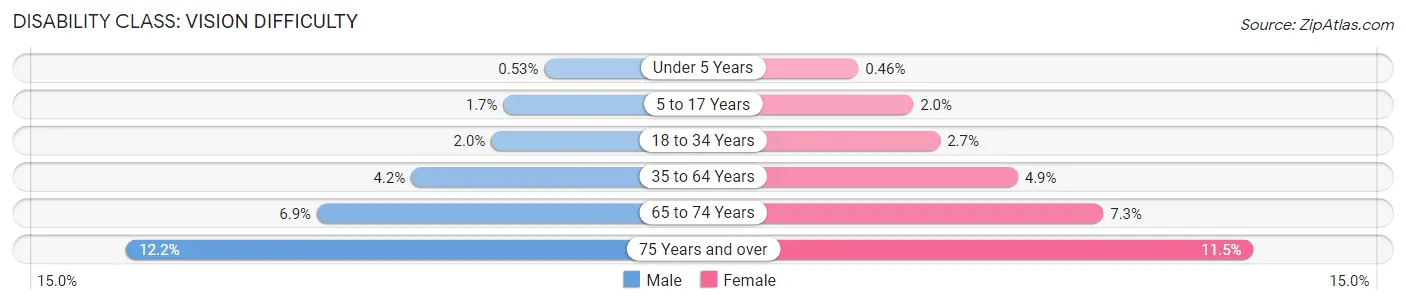
| Age Bracket | Male | Female |
| Under 5 Years | 479 (0.5%) | 403 (0.5%) |
| 5 to 17 Years | 4,359 (1.7%) | 4,992 (2.0%) |
| 18 to 34 Years | 6,363 (2.0%) | 9,165 (2.7%) |
| 35 to 64 Years | 21,737 (4.2%) | 27,761 (4.9%) |
| 65 to 74 Years | 9,149 (6.9%) | 11,273 (7.3%) |
| 75 Years and over | 8,944 (12.2%) | 12,602 (11.5%) |
Disability Class: Cognitive Difficulty
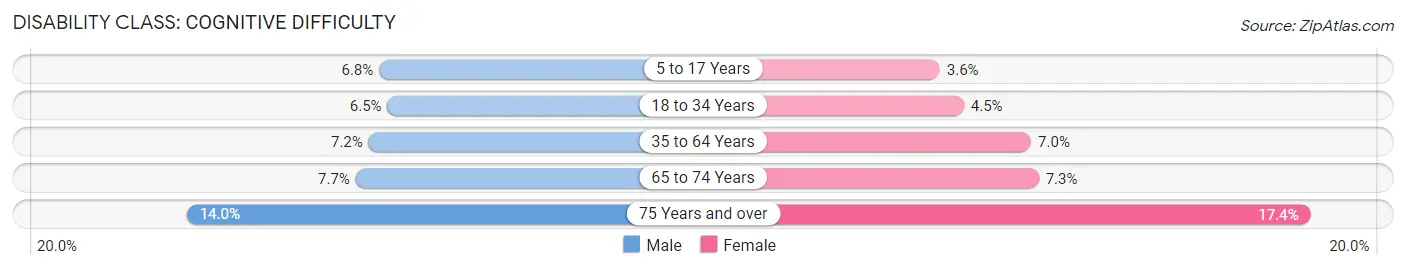
| Age Bracket | Male | Female |
| 5 to 17 Years | 17,812 (6.8%) | 9,163 (3.6%) |
| 18 to 34 Years | 20,706 (6.5%) | 15,139 (4.5%) |
| 35 to 64 Years | 37,053 (7.2%) | 39,806 (7.0%) |
| 65 to 74 Years | 10,277 (7.7%) | 11,321 (7.3%) |
| 75 Years and over | 10,273 (14.0%) | 19,132 (17.4%) |
Disability Class: Ambulatory Difficulty
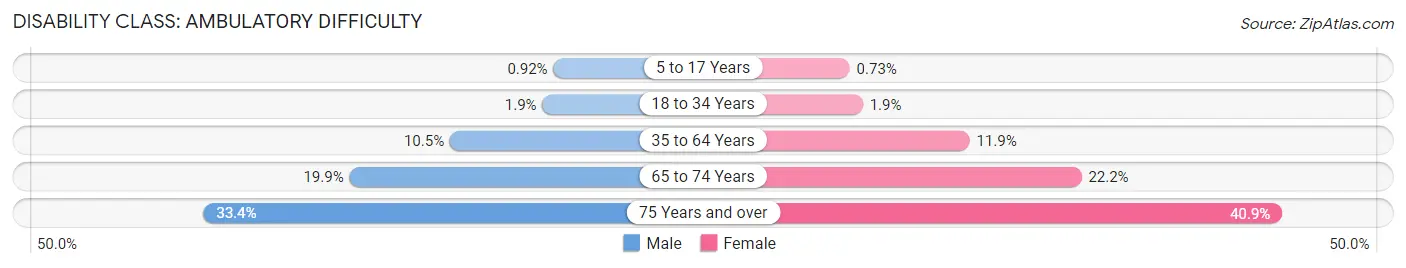
| Age Bracket | Male | Female |
| 5 to 17 Years | 2,393 (0.9%) | 1,835 (0.7%) |
| 18 to 34 Years | 6,148 (1.9%) | 6,496 (1.9%) |
| 35 to 64 Years | 53,934 (10.5%) | 67,154 (11.9%) |
| 65 to 74 Years | 26,456 (19.9%) | 34,436 (22.2%) |
| 75 Years and over | 24,547 (33.4%) | 44,931 (40.9%) |
Disability Class: Self-Care Difficulty
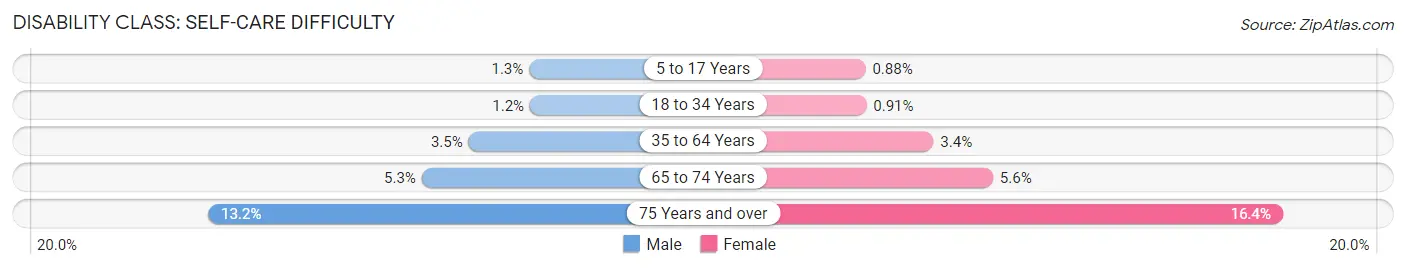
| Age Bracket | Male | Female |
| 5 to 17 Years | 3,319 (1.3%) | 2,201 (0.9%) |
| 18 to 34 Years | 3,925 (1.2%) | 3,044 (0.9%) |
| 35 to 64 Years | 18,044 (3.5%) | 19,239 (3.4%) |
| 65 to 74 Years | 7,013 (5.3%) | 8,695 (5.6%) |
| 75 Years and over | 9,689 (13.2%) | 17,997 (16.4%) |
Technology Access in Mississippi
Computing Device Access in Mississippi
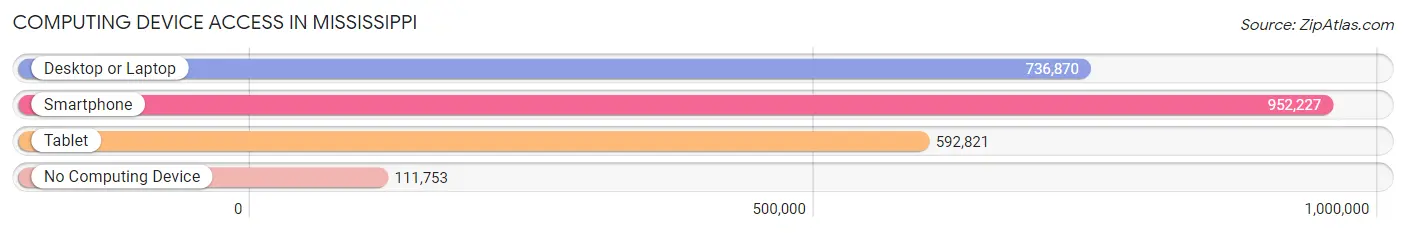
| Device Type | # Households | % Households |
| Desktop or Laptop | 736,870 | 65.7% |
| Smartphone | 952,227 | 84.9% |
| Tablet | 592,821 | 52.9% |
| No Computing Device | 111,753 | 10.0% |
| Total | 1,121,269 | 100.0% |
Internet Access in Mississippi
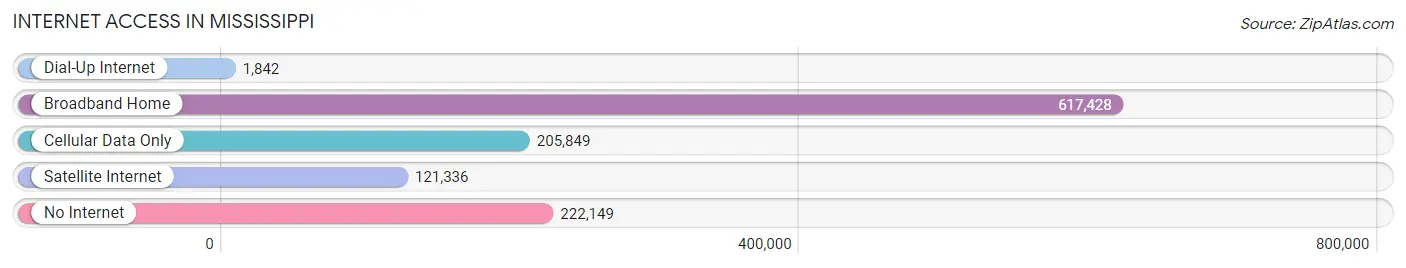
| Internet Type | # Households | % Households |
| Dial-Up Internet | 1,842 | 0.2% |
| Broadband Home | 617,428 | 55.1% |
| Cellular Data Only | 205,849 | 18.4% |
| Satellite Internet | 121,336 | 10.8% |
| No Internet | 222,149 | 19.8% |
| Total | 1,121,269 | 100.0% |
Mississippi Summary
Mississippi is a state located in the southeastern region of the United States. It is bordered by Tennessee to the north, Alabama to the east, the Gulf of Mexico to the south, and Louisiana and Arkansas to the west. Mississippi is the 32nd largest state in the United States, with an area of 48,430 square miles (125,440 km2). Mississippi is the 32nd most populous state in the United States, with a population of 2,976,149 as of the 2010 census.
History
Mississippi has a long and rich history. The first inhabitants of the area were Native American tribes, including the Choctaw, Chickasaw, and Natchez. The first Europeans to explore the area were the Spanish, who arrived in the early 16th century. The French also explored the area, and in 1699, they established the first permanent settlement in the area, Fort Maurepas. The French and Spanish both had a significant influence on the culture and language of the area.
In 1798, Mississippi became part of the United States as part of the Mississippi Territory. In 1817, Mississippi became the 20th state to join the Union. During the Civil War, Mississippi was a Confederate state, and it was the site of several major battles. After the war, Mississippi was the first state to ratify the 13th Amendment, which abolished slavery.
Geography
Mississippi is located in the southeastern region of the United States. It is bordered by Tennessee to the north, Alabama to the east, the Gulf of Mexico to the south, and Louisiana and Arkansas to the west. Mississippi is the 32nd largest state in the United States, with an area of 48,430 square miles (125,440 km2).
Mississippi is divided into three distinct geographic regions. The Gulf Coastal Plain is located in the southern part of the state and is characterized by flat, low-lying land. The Piedmont Plateau is located in the central part of the state and is characterized by rolling hills and valleys. The Mississippi Alluvial Plain is located in the northern part of the state and is characterized by flat, fertile land.
Economy
Mississippi’s economy is largely based on agriculture, forestry, and manufacturing. The state’s agricultural products include cotton, soybeans, corn, rice, and sweet potatoes. Mississippi is also a major producer of timber, and the state’s forests are home to a variety of hardwood trees.
Manufacturing is also an important part of Mississippi’s economy. The state is home to a number of major manufacturing companies, including Nissan, Toyota, and Continental Tire. Mississippi is also home to a number of military bases, which provide a significant boost to the state’s economy.
Demographics
As of the 2010 census, Mississippi had a population of 2,976,149. The racial makeup of the state was 58.4% White, 37.3% African American, 0.4% Native American, 1.2% Asian, 0.1% Pacific Islander, 0.7% from other races, and 2.0% from two or more races. Hispanic or Latino of any race were 2.7% of the population.
The median household income in Mississippi was $37,095 in 2018. The poverty rate in the state was 19.8%, which is higher than the national average of 11.8%. The largest cities in Mississippi are Jackson, Gulfport, Southaven, Hattiesburg, and Biloxi.
Common Questions
When was Mississippi Incorporated?
Mississippi was Incorporated into the Union on Dec 10, 1817.
What is the Total Area of Mississippi?
Total Area of Mississippi is 48,432 Square Miles.
What is the Total Land Area of Mississippi?
Total Land Area of Mississippi is 46,920 Square Miles.
What is the Total Water Area of Mississippi?
Total Water Area of Mississippi is 1,512 Square Miles.
What is the Average Elevation in Mississippi?
Average Elevation in Mississippi is 300 Feet.
What is the Highest Elevation in Mississippi?
Highest Elevation in Mississippi is 806 Feet.
What is the Lowest Elevation in Mississippi?
Lowest Elevation in Mississippi is 0 Feet.
What is the Population Density in Mississippi?
Population Density in Mississippi is 63.1 People per Square Mile.
What is Per Capita Income in Mississippi?
Per Capita income in Mississippi is $29,209.
What is the Median Family Income in Mississippi?
Median Family Income in Mississippi is $67,731.
What is the Median Household income in Mississippi?
Median Household Income in Mississippi is $52,985.
What is Income or Wage Gap in Mississippi?
Income or Wage Gap in Mississippi is 30.5%.
Women in Mississippi earn 69.5 cents for every dollar earned by a man.
What is Family Income Deficit in Mississippi?
Family Income Deficit in Mississippi is $11,405.
Families that are below poverty line in Mississippi earn $11,405 less on average than the poverty threshold level.
What is Inequality or Gini Index in Mississippi?
Inequality or Gini Index in Mississippi is 0.48.
What is the Total Population of Mississippi?
Total Population of Mississippi is 2,958,846.
What is the Total Male Population of Mississippi?
Total Male Population of Mississippi is 1,437,988.
What is the Total Female Population of Mississippi?
Total Female Population of Mississippi is 1,520,858.
What is the Ratio of Males per 100 Females in Mississippi?
There are 94.55 Males per 100 Females in Mississippi.
What is the Ratio of Females per 100 Males in Mississippi?
There are 105.76 Females per 100 Males in Mississippi.
What is the Median Population Age in Mississippi?
Median Population Age in Mississippi is 38.1 Years.
What is the Average Family Size in Mississippi
Average Family Size in Mississippi is 3.2 People.
What is the Average Household Size in Mississippi
Average Household Size in Mississippi is 2.5 People.
How Large is the Labor Force in Mississippi?
There are 1,343,921 People in the Labor Forcein in Mississippi.
What is the Percentage of People in the Labor Force in Mississippi?
57.2% of People are in the Labor Force in Mississippi.
What is the Unemployment Rate in Mississippi?
Unemployment Rate in Mississippi is 6.4%.