Cities with the Highest Percentage of Population Employed in Community & Social Service in California
RELATED REPORTS & OPTIONS
Community & Social Service
California
Compare Cities
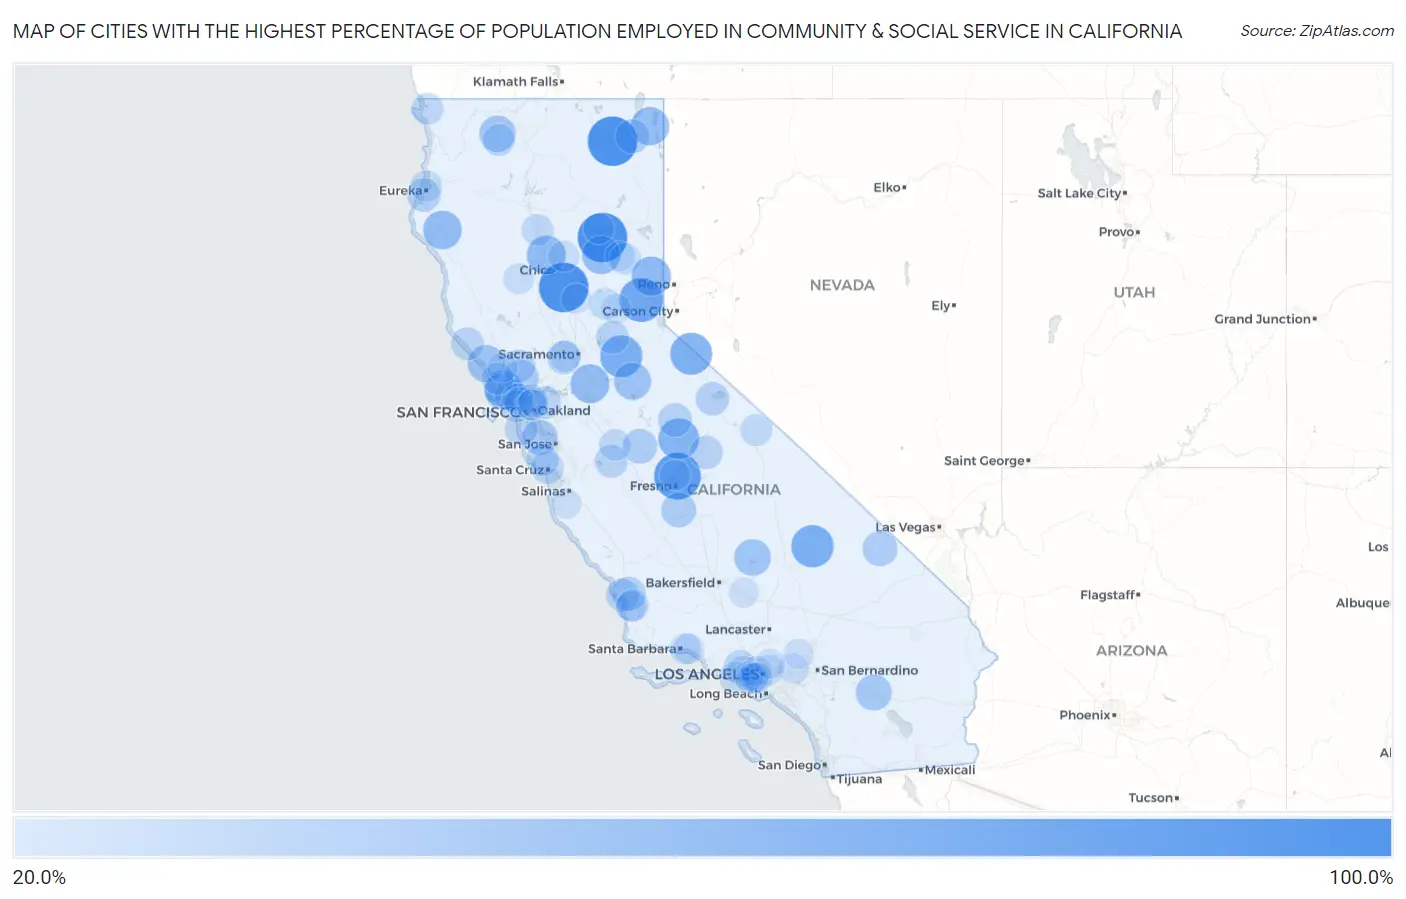
Map of Cities with the Highest Percentage of Population Employed in Community & Social Service in California
0.0%
100.0%
Cities with the Highest Percentage of Population Employed in Community & Social Service in California
| City | % Employed | vs State | vs National | |
| 1. | Canby | 100.0% | 11.5%(+88.5)#1 | 11.2%(+88.8)#1 |
| 2. | Richvale | 100.0% | 11.5%(+88.5)#2 | 11.2%(+88.8)#2 |
| 3. | Foresta | 100.0% | 11.5%(+88.5)#3 | 11.2%(+88.8)#12 |
| 4. | Strawberry Cdp Tuolumne County | 100.0% | 11.5%(+88.5)#4 | 11.2%(+88.8)#16 |
| 5. | Canyondam | 100.0% | 11.5%(+88.5)#5 | 11.2%(+88.8)#48 |
| 6. | Fort Washington | 88.7% | 11.5%(+77.3)#6 | 11.2%(+77.5)#53 |
| 7. | Soda Springs | 77.8% | 11.5%(+66.3)#7 | 11.2%(+66.6)#69 |
| 8. | Homewood Canyon | 71.0% | 11.5%(+59.5)#8 | 11.2%(+59.8)#83 |
| 9. | River Pines | 69.9% | 11.5%(+58.4)#9 | 11.2%(+58.6)#86 |
| 10. | Coleville | 69.0% | 11.5%(+57.6)#10 | 11.2%(+57.8)#90 |
| 11. | Nipinnawasee | 64.8% | 11.5%(+53.3)#11 | 11.2%(+53.6)#102 |
| 12. | Sierra Brooks | 59.1% | 11.5%(+47.6)#12 | 11.2%(+47.9)#121 |
| 13. | Point Reyes Station | 57.8% | 11.5%(+46.3)#13 | 11.2%(+46.5)#129 |
| 14. | Vina | 56.9% | 11.5%(+45.5)#14 | 11.2%(+45.7)#140 |
| 15. | Acampo | 56.6% | 11.5%(+45.1)#15 | 11.2%(+45.3)#144 |
| 16. | Myers Flat | 56.0% | 11.5%(+44.5)#16 | 11.2%(+44.7)#146 |
| 17. | Meadow Valley | 55.1% | 11.5%(+43.6)#17 | 11.2%(+43.9)#153 |
| 18. | Lake City | 55.0% | 11.5%(+43.5)#18 | 11.2%(+43.8)#155 |
| 19. | Mountain Ranch | 50.0% | 11.5%(+38.5)#19 | 11.2%(+38.8)#187 |
| 20. | Jenner | 50.0% | 11.5%(+38.5)#20 | 11.2%(+38.8)#200 |
| 21. | Kernville | 48.0% | 11.5%(+36.5)#21 | 11.2%(+36.8)#224 |
| 22. | Greenview | 46.7% | 11.5%(+35.2)#22 | 11.2%(+35.5)#245 |
| 23. | Desert Palms | 45.1% | 11.5%(+33.6)#23 | 11.2%(+33.9)#271 |
| 24. | University Of California-Santa Barbara | 43.8% | 11.5%(+32.3)#24 | 11.2%(+32.6)#294 |
| 25. | Stanford | 42.8% | 11.5%(+31.3)#25 | 11.2%(+31.5)#316 |
| 26. | Temelec | 42.1% | 11.5%(+30.6)#26 | 11.2%(+30.9)#326 |
| 27. | Camp Pendleton Mainside | 41.4% | 11.5%(+29.9)#27 | 11.2%(+30.1)#334 |
| 28. | Hardwick | 41.0% | 11.5%(+29.5)#28 | 11.2%(+29.8)#337 |
| 29. | Tecopa | 40.9% | 11.5%(+29.4)#29 | 11.2%(+29.7)#338 |
| 30. | Rumsey | 40.4% | 11.5%(+28.9)#30 | 11.2%(+29.2)#342 |
| 31. | Bear Creek | 40.3% | 11.5%(+28.8)#31 | 11.2%(+29.1)#343 |
| 32. | Daphnedale Park | 37.7% | 11.5%(+26.2)#32 | 11.2%(+26.5)#403 |
| 33. | Edna | 37.1% | 11.5%(+25.6)#33 | 11.2%(+25.9)#429 |
| 34. | Pepperdine University | 36.9% | 11.5%(+25.4)#34 | 11.2%(+25.7)#439 |
| 35. | El Portal | 36.5% | 11.5%(+25.0)#35 | 11.2%(+25.2)#449 |
| 36. | Fields Landing | 35.6% | 11.5%(+24.1)#36 | 11.2%(+24.4)#473 |
| 37. | Lee Vining | 35.5% | 11.5%(+24.0)#37 | 11.2%(+24.3)#476 |
| 38. | San Geronimo | 35.0% | 11.5%(+23.5)#38 | 11.2%(+23.7)#501 |
| 39. | University Of California Davis | 34.8% | 11.5%(+23.3)#39 | 11.2%(+23.6)#505 |
| 40. | Big Creek | 34.8% | 11.5%(+23.3)#40 | 11.2%(+23.6)#506 |
| 41. | Avila Beach | 34.5% | 11.5%(+23.0)#41 | 11.2%(+23.3)#524 |
| 42. | Olde Stockdale | 34.2% | 11.5%(+22.7)#42 | 11.2%(+23.0)#536 |
| 43. | Coloma | 34.1% | 11.5%(+22.6)#43 | 11.2%(+22.9)#537 |
| 44. | Inverness | 33.9% | 11.5%(+22.4)#44 | 11.2%(+22.7)#546 |
| 45. | Old River | 33.8% | 11.5%(+22.3)#45 | 11.2%(+22.6)#548 |
| 46. | Kenwood | 33.5% | 11.5%(+22.0)#46 | 11.2%(+22.3)#554 |
| 47. | Sea Ranch | 33.3% | 11.5%(+21.8)#47 | 11.2%(+22.1)#556 |
| 48. | Volta | 33.1% | 11.5%(+21.6)#48 | 11.2%(+21.9)#581 |
| 49. | Montara | 32.5% | 11.5%(+21.0)#49 | 11.2%(+21.3)#610 |
| 50. | Paradise Park | 31.9% | 11.5%(+20.4)#50 | 11.2%(+20.7)#642 |
| 51. | Acalanes Ridge | 31.6% | 11.5%(+20.1)#51 | 11.2%(+20.4)#658 |
| 52. | Blacklake | 31.6% | 11.5%(+20.1)#52 | 11.2%(+20.3)#659 |
| 53. | Hidden Hills | 30.9% | 11.5%(+19.4)#53 | 11.2%(+19.7)#693 |
| 54. | Brookdale | 30.5% | 11.5%(+19.0)#54 | 11.2%(+19.3)#723 |
| 55. | Muir Beach | 30.1% | 11.5%(+18.6)#55 | 11.2%(+18.9)#747 |
| 56. | Tomales | 29.8% | 11.5%(+18.3)#56 | 11.2%(+18.5)#773 |
| 57. | Etna | 29.7% | 11.5%(+18.2)#57 | 11.2%(+18.5)#777 |
| 58. | Chalfant | 29.6% | 11.5%(+18.1)#58 | 11.2%(+18.4)#784 |
| 59. | Fort Dick | 29.6% | 11.5%(+18.1)#59 | 11.2%(+18.4)#785 |
| 60. | Stevinson | 28.8% | 11.5%(+17.4)#60 | 11.2%(+17.6)#837 |
| 61. | Bend | 28.5% | 11.5%(+17.0)#61 | 11.2%(+17.3)#871 |
| 62. | Manila | 28.2% | 11.5%(+16.8)#62 | 11.2%(+17.0)#888 |
| 63. | Nevada City | 28.1% | 11.5%(+16.6)#63 | 11.2%(+16.9)#901 |
| 64. | Cromberg | 27.7% | 11.5%(+16.2)#64 | 11.2%(+16.5)#937 |
| 65. | Malibu | 27.3% | 11.5%(+15.8)#65 | 11.2%(+16.1)#973 |
| 66. | Mountain Meadows | 27.2% | 11.5%(+15.7)#66 | 11.2%(+16.0)#983 |
| 67. | Modjeska | 26.9% | 11.5%(+15.4)#67 | 11.2%(+15.7)#1,020 |
| 68. | Topanga | 26.8% | 11.5%(+15.3)#68 | 11.2%(+15.6)#1,027 |
| 69. | East Richmond Heights | 26.7% | 11.5%(+15.3)#69 | 11.2%(+15.5)#1,033 |
| 70. | Davis | 26.3% | 11.5%(+14.8)#70 | 11.2%(+15.1)#1,081 |
| 71. | Cohasset | 25.7% | 11.5%(+14.2)#71 | 11.2%(+14.5)#1,133 |
| 72. | Albany | 25.5% | 11.5%(+14.0)#72 | 11.2%(+14.2)#1,154 |
| 73. | Berkeley | 25.3% | 11.5%(+13.8)#73 | 11.2%(+14.1)#1,167 |
| 74. | Woodlands | 25.2% | 11.5%(+13.7)#74 | 11.2%(+14.0)#1,181 |
| 75. | Montecito | 25.2% | 11.5%(+13.7)#75 | 11.2%(+14.0)#1,186 |
| 76. | Lake Almanor Peninsula | 25.0% | 11.5%(+13.5)#76 | 11.2%(+13.8)#1,216 |
| 77. | Elk Creek | 25.0% | 11.5%(+13.5)#77 | 11.2%(+13.8)#1,232 |
| 78. | Sonoma State University | 24.7% | 11.5%(+13.2)#78 | 11.2%(+13.5)#1,276 |
| 79. | Rolling Hills | 24.6% | 11.5%(+13.1)#79 | 11.2%(+13.4)#1,287 |
| 80. | Ross | 24.5% | 11.5%(+13.0)#80 | 11.2%(+13.3)#1,307 |
| 81. | Toro Canyon | 24.5% | 11.5%(+13.0)#81 | 11.2%(+13.2)#1,313 |
| 82. | Alto | 24.3% | 11.5%(+12.9)#82 | 11.2%(+13.1)#1,331 |
| 83. | Claremont | 24.1% | 11.5%(+12.6)#83 | 11.2%(+12.9)#1,368 |
| 84. | South Pasadena | 24.1% | 11.5%(+12.6)#84 | 11.2%(+12.9)#1,369 |
| 85. | Ladera Heights | 23.8% | 11.5%(+12.3)#85 | 11.2%(+12.6)#1,426 |
| 86. | Stones Landing | 23.7% | 11.5%(+12.2)#86 | 11.2%(+12.5)#1,453 |
| 87. | West Hollywood | 23.4% | 11.5%(+11.9)#87 | 11.2%(+12.2)#1,517 |
| 88. | Marina Del Rey | 23.2% | 11.5%(+11.8)#88 | 11.2%(+12.0)#1,546 |
| 89. | View Park Windsor Hills | 23.1% | 11.5%(+11.6)#89 | 11.2%(+11.9)#1,563 |
| 90. | Wrightwood | 23.1% | 11.5%(+11.6)#90 | 11.2%(+11.9)#1,565 |
| 91. | Keene | 23.1% | 11.5%(+11.6)#91 | 11.2%(+11.9)#1,568 |
| 92. | Santa Monica | 23.1% | 11.5%(+11.6)#92 | 11.2%(+11.9)#1,576 |
| 93. | Dutch Flat | 23.1% | 11.5%(+11.6)#93 | 11.2%(+11.9)#1,587 |
| 94. | Kensington | 22.9% | 11.5%(+11.5)#94 | 11.2%(+11.7)#1,613 |
| 95. | Honcut | 22.9% | 11.5%(+11.4)#95 | 11.2%(+11.7)#1,617 |
| 96. | Altadena | 22.8% | 11.5%(+11.3)#96 | 11.2%(+11.6)#1,638 |
| 97. | Carmel Valley Village | 22.8% | 11.5%(+11.3)#97 | 11.2%(+11.6)#1,643 |
| 98. | Sebastopol | 22.8% | 11.5%(+11.3)#98 | 11.2%(+11.6)#1,654 |
| 99. | Greenhorn | 22.6% | 11.5%(+11.2)#99 | 11.2%(+11.4)#1,679 |
| 100. | Culver City | 22.6% | 11.5%(+11.1)#100 | 11.2%(+11.4)#1,693 |
Common Questions
What are the Top 10 Cities with the Highest Percentage of Population Employed in Community & Social Service in California?
Top 10 Cities with the Highest Percentage of Population Employed in Community & Social Service in California are:
#1
100.0%
#2
100.0%
#3
100.0%
#4
88.7%
#5
77.8%
#6
71.0%
#7
69.9%
#8
69.0%
#9
64.8%
#10
59.1%
What city has the Highest Percentage of Population Employed in Community & Social Service in California?
Canby has the Highest Percentage of Population Employed in Community & Social Service in California with 100.0%.
What is the Percentage of Population Employed in Community & Social Service in the State of California?
Percentage of Population Employed in Community & Social Service in California is 11.5%.
What is the Percentage of Population Employed in Community & Social Service in the United States?
Percentage of Population Employed in Community & Social Service in the United States is 11.2%.