Cities with the Lowest Poverty Level Among Single Mothers in California
RELATED REPORTS & OPTIONS
Lowest Poverty | Single Mother
California
Compare Cities
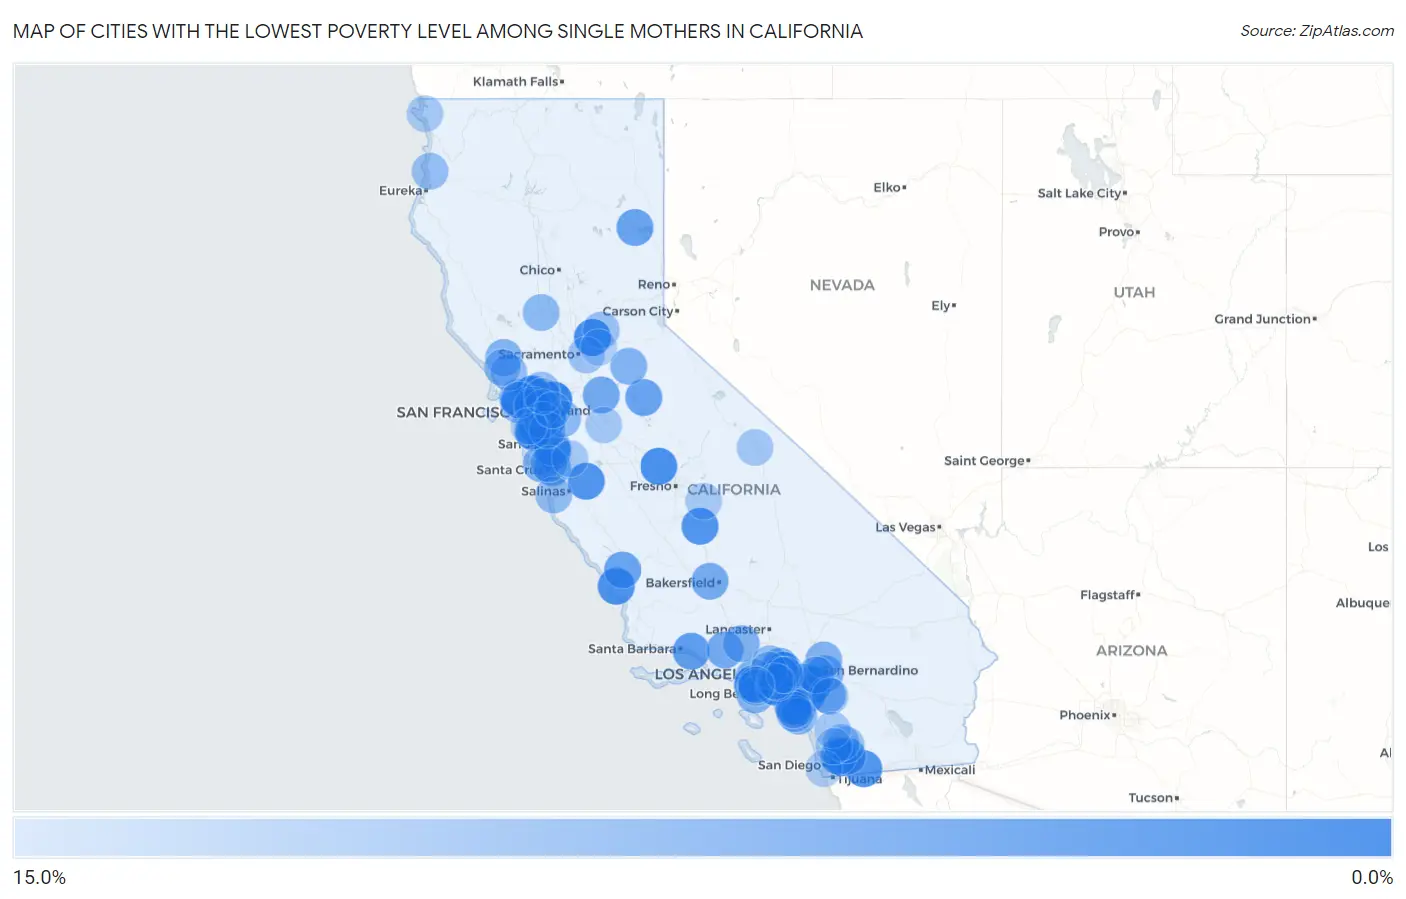
Map of Cities with the Lowest Poverty Level Among Single Mothers in California
15.0%
0.0%
Cities with the Lowest Poverty Level Among Single Mothers in California
| City | Single Mother Poverty | vs State | vs National | |
| 1. | Clayton | 1.2% | 29.2%(-28.0)#1 | 33.1%(-32.0)#8 |
| 2. | Foster City | 1.4% | 29.2%(-27.8)#2 | 33.1%(-31.8)#16 |
| 3. | Rocklin | 2.2% | 29.2%(-26.9)#3 | 33.1%(-30.9)#45 |
| 4. | Pinole | 2.8% | 29.2%(-26.4)#4 | 33.1%(-30.3)#77 |
| 5. | Madera Acres | 2.8% | 29.2%(-26.4)#5 | 33.1%(-30.3)#78 |
| 6. | Vincent | 2.8% | 29.2%(-26.4)#6 | 33.1%(-30.3)#79 |
| 7. | Los Osos | 3.1% | 29.2%(-26.1)#7 | 33.1%(-30.1)#97 |
| 8. | Harbison Canyon | 3.3% | 29.2%(-25.9)#8 | 33.1%(-29.8)#118 |
| 9. | Fairview | 3.4% | 29.2%(-25.8)#9 | 33.1%(-29.7)#124 |
| 10. | Ridgemark | 3.6% | 29.2%(-25.6)#10 | 33.1%(-29.6)#138 |
| 11. | Matheny | 3.6% | 29.2%(-25.6)#11 | 33.1%(-29.6)#140 |
| 12. | Campo | 3.7% | 29.2%(-25.5)#12 | 33.1%(-29.4)#149 |
| 13. | Los Gatos | 3.9% | 29.2%(-25.3)#13 | 33.1%(-29.2)#169 |
| 14. | Woodcrest | 4.0% | 29.2%(-25.2)#14 | 33.1%(-29.1)#175 |
| 15. | Rancho Mission Viejo | 4.1% | 29.2%(-25.1)#15 | 33.1%(-29.0)#186 |
| 16. | Bayview Cdp Contra Costa County | 4.5% | 29.2%(-24.7)#16 | 33.1%(-28.7)#219 |
| 17. | San Carlos | 4.6% | 29.2%(-24.6)#17 | 33.1%(-28.5)#238 |
| 18. | Temescal Valley | 4.8% | 29.2%(-24.4)#18 | 33.1%(-28.3)#263 |
| 19. | Alpine | 4.9% | 29.2%(-24.3)#19 | 33.1%(-28.3)#271 |
| 20. | Norco | 4.9% | 29.2%(-24.3)#20 | 33.1%(-28.2)#280 |
| 21. | Carpinteria | 4.9% | 29.2%(-24.3)#21 | 33.1%(-28.2)#281 |
| 22. | Manhattan Beach | 5.1% | 29.2%(-24.1)#22 | 33.1%(-28.0)#309 |
| 23. | Larkspur | 5.5% | 29.2%(-23.7)#23 | 33.1%(-27.6)#365 |
| 24. | Janesville | 5.6% | 29.2%(-23.6)#24 | 33.1%(-27.5)#383 |
| 25. | East Sonora | 5.7% | 29.2%(-23.5)#25 | 33.1%(-27.4)#400 |
| 26. | Templeton | 5.8% | 29.2%(-23.4)#26 | 33.1%(-27.3)#411 |
| 27. | Winter Gardens | 6.0% | 29.2%(-23.2)#27 | 33.1%(-27.1)#434 |
| 28. | Hercules | 6.1% | 29.2%(-23.1)#28 | 33.1%(-27.1)#445 |
| 29. | Laguna Hills | 6.5% | 29.2%(-22.7)#29 | 33.1%(-26.6)#517 |
| 30. | Johnson Park | 6.6% | 29.2%(-22.6)#30 | 33.1%(-26.5)#525 |
| 31. | Linden | 6.7% | 29.2%(-22.5)#31 | 33.1%(-26.5)#538 |
| 32. | Fillmore | 6.7% | 29.2%(-22.5)#32 | 33.1%(-26.4)#556 |
| 33. | Rosedale | 6.9% | 29.2%(-22.3)#33 | 33.1%(-26.2)#587 |
| 34. | Orinda | 7.3% | 29.2%(-21.9)#34 | 33.1%(-25.9)#646 |
| 35. | Artesia | 7.3% | 29.2%(-21.8)#35 | 33.1%(-25.8)#659 |
| 36. | Soquel | 7.4% | 29.2%(-21.8)#36 | 33.1%(-25.7)#667 |
| 37. | Redlands | 7.4% | 29.2%(-21.8)#37 | 33.1%(-25.7)#678 |
| 38. | Duarte | 7.5% | 29.2%(-21.7)#38 | 33.1%(-25.7)#682 |
| 39. | Culver City | 7.5% | 29.2%(-21.7)#39 | 33.1%(-25.6)#686 |
| 40. | Ladera Ranch | 7.6% | 29.2%(-21.6)#40 | 33.1%(-25.5)#707 |
| 41. | Bonny Doon | 7.7% | 29.2%(-21.5)#41 | 33.1%(-25.4)#717 |
| 42. | Castaic | 7.9% | 29.2%(-21.3)#42 | 33.1%(-25.2)#769 |
| 43. | Lake Arrowhead | 8.0% | 29.2%(-21.1)#43 | 33.1%(-25.1)#789 |
| 44. | Rancho Palos Verdes | 8.1% | 29.2%(-21.1)#44 | 33.1%(-25.0)#794 |
| 45. | Red Corral | 8.1% | 29.2%(-21.1)#45 | 33.1%(-25.0)#803 |
| 46. | Windsor | 8.2% | 29.2%(-20.9)#46 | 33.1%(-24.9)#831 |
| 47. | Homeland | 8.3% | 29.2%(-20.9)#47 | 33.1%(-24.8)#836 |
| 48. | Campbell | 8.4% | 29.2%(-20.8)#48 | 33.1%(-24.8)#866 |
| 49. | Tamalpais Homestead Valley | 8.5% | 29.2%(-20.7)#49 | 33.1%(-24.7)#882 |
| 50. | Aliso Viejo | 8.7% | 29.2%(-20.5)#50 | 33.1%(-24.4)#925 |
| 51. | Williams | 8.9% | 29.2%(-20.3)#51 | 33.1%(-24.2)#968 |
| 52. | Cerritos | 8.9% | 29.2%(-20.3)#52 | 33.1%(-24.2)#969 |
| 53. | Livermore | 8.9% | 29.2%(-20.3)#53 | 33.1%(-24.2)#971 |
| 54. | San Anselmo | 9.0% | 29.2%(-20.2)#54 | 33.1%(-24.2)#978 |
| 55. | San Clemente | 9.1% | 29.2%(-20.1)#55 | 33.1%(-24.0)#987 |
| 56. | La Palma | 9.3% | 29.2%(-19.9)#56 | 33.1%(-23.8)#1,047 |
| 57. | Dana Point | 9.4% | 29.2%(-19.8)#57 | 33.1%(-23.8)#1,049 |
| 58. | Grand Terrace | 9.4% | 29.2%(-19.8)#58 | 33.1%(-23.7)#1,050 |
| 59. | Pacific Grove | 9.4% | 29.2%(-19.8)#59 | 33.1%(-23.7)#1,057 |
| 60. | Scotts Valley | 9.5% | 29.2%(-19.7)#60 | 33.1%(-23.7)#1,061 |
| 61. | Altadena | 9.6% | 29.2%(-19.6)#61 | 33.1%(-23.6)#1,085 |
| 62. | Cotati | 9.7% | 29.2%(-19.5)#62 | 33.1%(-23.5)#1,106 |
| 63. | Westhaven Moonstone | 9.8% | 29.2%(-19.4)#63 | 33.1%(-23.3)#1,125 |
| 64. | Citrus | 9.8% | 29.2%(-19.4)#64 | 33.1%(-23.3)#1,128 |
| 65. | Auburn | 10.0% | 29.2%(-19.2)#65 | 33.1%(-23.2)#1,151 |
| 66. | Benicia | 10.0% | 29.2%(-19.2)#66 | 33.1%(-23.2)#1,152 |
| 67. | Emeryville | 10.0% | 29.2%(-19.2)#67 | 33.1%(-23.1)#1,155 |
| 68. | Sebastopol | 10.0% | 29.2%(-19.2)#68 | 33.1%(-23.1)#1,157 |
| 69. | Valinda | 10.1% | 29.2%(-19.1)#69 | 33.1%(-23.0)#1,211 |
| 70. | Berkeley | 10.2% | 29.2%(-19.0)#70 | 33.1%(-23.0)#1,215 |
| 71. | San Diego Country Estates | 10.3% | 29.2%(-18.9)#71 | 33.1%(-22.8)#1,236 |
| 72. | La Riviera | 10.4% | 29.2%(-18.8)#72 | 33.1%(-22.7)#1,258 |
| 73. | Ramona | 10.4% | 29.2%(-18.8)#73 | 33.1%(-22.7)#1,259 |
| 74. | Moraga | 10.5% | 29.2%(-18.7)#74 | 33.1%(-22.7)#1,270 |
| 75. | San Lorenzo | 10.8% | 29.2%(-18.4)#75 | 33.1%(-22.4)#1,341 |
| 76. | Green Acres | 10.8% | 29.2%(-18.4)#76 | 33.1%(-22.4)#1,345 |
| 77. | Laguna Niguel | 10.9% | 29.2%(-18.3)#77 | 33.1%(-22.2)#1,367 |
| 78. | El Segundo | 10.9% | 29.2%(-18.3)#78 | 33.1%(-22.2)#1,368 |
| 79. | Strawberry Cdp Marin County | 11.0% | 29.2%(-18.2)#79 | 33.1%(-22.1)#1,381 |
| 80. | South Pasadena | 11.1% | 29.2%(-18.1)#80 | 33.1%(-22.0)#1,393 |
| 81. | Wilkerson | 11.1% | 29.2%(-18.1)#81 | 33.1%(-22.0)#1,433 |
| 82. | Morgan Hill | 11.2% | 29.2%(-18.0)#82 | 33.1%(-21.9)#1,456 |
| 83. | Valley Center | 11.3% | 29.2%(-17.9)#83 | 33.1%(-21.9)#1,465 |
| 84. | Riverdale Park | 11.3% | 29.2%(-17.9)#84 | 33.1%(-21.9)#1,467 |
| 85. | Redondo Beach | 11.3% | 29.2%(-17.9)#85 | 33.1%(-21.8)#1,472 |
| 86. | Cutler | 11.4% | 29.2%(-17.8)#86 | 33.1%(-21.8)#1,483 |
| 87. | Belmont | 11.4% | 29.2%(-17.8)#87 | 33.1%(-21.7)#1,494 |
| 88. | Crescent City | 11.5% | 29.2%(-17.7)#88 | 33.1%(-21.6)#1,507 |
| 89. | East Whittier | 11.5% | 29.2%(-17.7)#89 | 33.1%(-21.6)#1,513 |
| 90. | Newark | 11.8% | 29.2%(-17.4)#90 | 33.1%(-21.3)#1,586 |
| 91. | Coronado | 11.8% | 29.2%(-17.4)#91 | 33.1%(-21.3)#1,589 |
| 92. | Poway | 12.0% | 29.2%(-17.2)#92 | 33.1%(-21.2)#1,613 |
| 93. | South Whittier | 12.1% | 29.2%(-17.1)#93 | 33.1%(-21.0)#1,639 |
| 94. | Kentfield | 12.1% | 29.2%(-17.1)#94 | 33.1%(-21.0)#1,645 |
| 95. | Burlingame | 12.2% | 29.2%(-17.0)#95 | 33.1%(-20.9)#1,665 |
| 96. | Martinez | 12.4% | 29.2%(-16.8)#96 | 33.1%(-20.8)#1,695 |
| 97. | Folsom | 12.4% | 29.2%(-16.8)#97 | 33.1%(-20.7)#1,703 |
| 98. | Walnut | 12.6% | 29.2%(-16.6)#98 | 33.1%(-20.6)#1,767 |
| 99. | Lawndale | 12.6% | 29.2%(-16.6)#99 | 33.1%(-20.5)#1,780 |
| 100. | Danville | 12.8% | 29.2%(-16.4)#100 | 33.1%(-20.4)#1,811 |
Common Questions
What are the Top 10 Cities with the Lowest Poverty Level Among Single Mothers in California?
Top 10 Cities with the Lowest Poverty Level Among Single Mothers in California are:
#1
1.2%
#2
1.4%
#3
2.2%
#4
2.8%
#5
2.8%
#6
2.8%
#7
3.1%
#8
3.3%
#9
3.4%
#10
3.6%
What city has the Lowest Poverty Level Among Single Mothers in California?
Clayton has the Lowest Poverty Level Among Single Mothers in California with 1.2%.
What is the Poverty Level Among Single Mothers in the State of California?
Poverty Level Among Single Mothers in California is 29.2%.
What is the Poverty Level Among Single Mothers in the United States?
Poverty Level Among Single Mothers in the United States is 33.1%.