Cities with the Highest Percentage of Population with a Degree in Visual and Performing Arts in California
RELATED REPORTS & OPTIONS
Visual and Performing Arts
California
Compare Cities
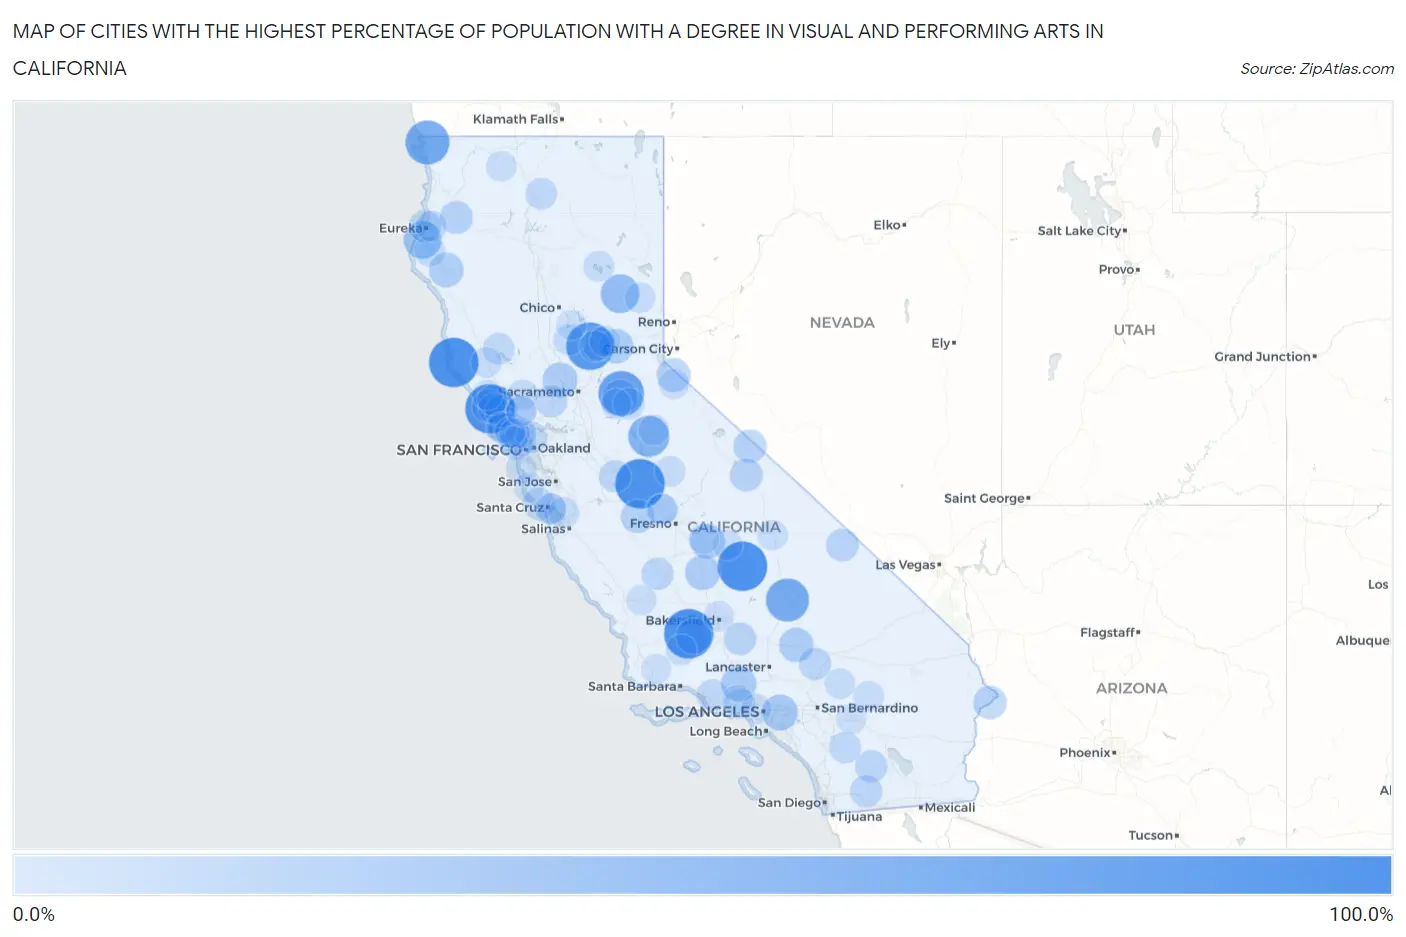
Map of Cities with the Highest Percentage of Population with a Degree in Visual and Performing Arts in California
0.0%
100.0%
Cities with the Highest Percentage of Population with a Degree in Visual and Performing Arts in California
| City | % Graduates | vs State | vs National | |
| 1. | Manchester | 100.0% | 5.7%(+94.3)#1 | 4.3%(+95.7)#13 |
| 2. | Bear Creek | 100.0% | 5.7%(+94.3)#2 | 4.3%(+95.7)#15 |
| 3. | Camp Nelson | 100.0% | 5.7%(+94.3)#3 | 4.3%(+95.7)#32 |
| 4. | Fellows | 100.0% | 5.7%(+94.3)#4 | 4.3%(+95.7)#35 |
| 5. | Salmon Creek | 100.0% | 5.7%(+94.3)#5 | 4.3%(+95.7)#46 |
| 6. | Smartsville | 90.9% | 5.7%(+85.2)#6 | 4.3%(+86.7)#48 |
| 7. | River Pines | 81.6% | 5.7%(+75.9)#7 | 4.3%(+77.3)#53 |
| 8. | Smith River | 74.2% | 5.7%(+68.5)#8 | 4.3%(+69.9)#60 |
| 9. | Inyokern | 70.8% | 5.7%(+65.0)#9 | 4.3%(+66.5)#61 |
| 10. | Tuolumne City | 61.1% | 5.7%(+55.3)#10 | 4.3%(+56.8)#78 |
| 11. | Foresta | 55.8% | 5.7%(+50.1)#11 | 4.3%(+51.6)#94 |
| 12. | Greenhorn | 50.0% | 5.7%(+44.3)#12 | 4.3%(+45.7)#116 |
| 13. | Loleta | 46.0% | 5.7%(+40.3)#13 | 4.3%(+41.8)#145 |
| 14. | Industry | 37.0% | 5.7%(+31.3)#14 | 4.3%(+32.8)#203 |
| 15. | South Taft | 36.8% | 5.7%(+31.1)#15 | 4.3%(+32.6)#206 |
| 16. | Fiddletown | 36.4% | 5.7%(+30.6)#16 | 4.3%(+32.1)#210 |
| 17. | Val Verde | 34.6% | 5.7%(+28.9)#17 | 4.3%(+30.4)#232 |
| 18. | Tipton | 33.3% | 5.7%(+27.6)#18 | 4.3%(+29.1)#244 |
| 19. | Seville | 33.3% | 5.7%(+27.6)#19 | 4.3%(+29.1)#249 |
| 20. | Yolo | 33.3% | 5.7%(+27.6)#20 | 4.3%(+29.1)#252 |
| 21. | Boron | 32.0% | 5.7%(+26.2)#21 | 4.3%(+27.7)#282 |
| 22. | Miranda | 31.8% | 5.7%(+26.1)#22 | 4.3%(+27.6)#283 |
| 23. | Dutch Flat | 31.4% | 5.7%(+25.6)#23 | 4.3%(+27.1)#291 |
| 24. | Mesa Vista | 29.0% | 5.7%(+23.3)#24 | 4.3%(+24.8)#330 |
| 25. | Sereno Del Mar | 27.4% | 5.7%(+21.6)#25 | 4.3%(+23.1)#367 |
| 26. | Bluewater | 26.9% | 5.7%(+21.2)#26 | 4.3%(+22.7)#379 |
| 27. | Firebaugh | 26.7% | 5.7%(+21.0)#27 | 4.3%(+22.5)#383 |
| 28. | Benton | 26.5% | 5.7%(+20.8)#28 | 4.3%(+22.3)#389 |
| 29. | Rough And Ready | 26.0% | 5.7%(+20.3)#29 | 4.3%(+21.8)#398 |
| 30. | Willow Creek | 25.7% | 5.7%(+20.0)#30 | 4.3%(+21.4)#404 |
| 31. | Mesa | 25.4% | 5.7%(+19.7)#31 | 4.3%(+21.1)#407 |
| 32. | Stallion Springs | 24.1% | 5.7%(+18.4)#32 | 4.3%(+19.9)#461 |
| 33. | Furnace Creek | 23.5% | 5.7%(+17.8)#33 | 4.3%(+19.3)#474 |
| 34. | Borrego Springs | 22.3% | 5.7%(+16.5)#34 | 4.3%(+18.0)#511 |
| 35. | Samoa | 22.2% | 5.7%(+16.5)#35 | 4.3%(+18.0)#517 |
| 36. | Nicasio | 22.2% | 5.7%(+16.5)#36 | 4.3%(+18.0)#523 |
| 37. | Silver Lakes | 22.0% | 5.7%(+16.3)#37 | 4.3%(+17.8)#528 |
| 38. | Allendale | 22.0% | 5.7%(+16.2)#38 | 4.3%(+17.7)#530 |
| 39. | Hilmar Irwin | 21.8% | 5.7%(+16.1)#39 | 4.3%(+17.6)#534 |
| 40. | Avenal | 21.8% | 5.7%(+16.0)#40 | 4.3%(+17.5)#536 |
| 41. | Mount Laguna | 21.7% | 5.7%(+15.9)#41 | 4.3%(+17.4)#545 |
| 42. | Bloomfield | 21.5% | 5.7%(+15.8)#42 | 4.3%(+17.3)#550 |
| 43. | Davenport | 21.2% | 5.7%(+15.4)#43 | 4.3%(+16.9)#566 |
| 44. | Muir Beach | 20.4% | 5.7%(+14.7)#44 | 4.3%(+16.2)#605 |
| 45. | Saticoy | 20.4% | 5.7%(+14.7)#45 | 4.3%(+16.1)#607 |
| 46. | Alto | 20.3% | 5.7%(+14.5)#46 | 4.3%(+16.0)#613 |
| 47. | Point Reyes Station | 19.8% | 5.7%(+14.0)#47 | 4.3%(+15.5)#653 |
| 48. | Upper Lake | 19.4% | 5.7%(+13.6)#48 | 4.3%(+15.1)#678 |
| 49. | Lake Riverside | 19.3% | 5.7%(+13.6)#49 | 4.3%(+15.1)#681 |
| 50. | Twin Lakes | 19.2% | 5.7%(+13.5)#50 | 4.3%(+15.0)#685 |
| 51. | Mccloud | 19.2% | 5.7%(+13.4)#51 | 4.3%(+14.9)#694 |
| 52. | Parkwood | 18.8% | 5.7%(+13.1)#52 | 4.3%(+14.6)#721 |
| 53. | East Richmond Heights | 18.8% | 5.7%(+13.1)#53 | 4.3%(+14.6)#722 |
| 54. | Red Corral | 18.3% | 5.7%(+12.6)#54 | 4.3%(+14.1)#752 |
| 55. | Live Oak | 17.3% | 5.7%(+11.6)#55 | 4.3%(+13.1)#826 |
| 56. | Silverado | 17.2% | 5.7%(+11.5)#56 | 4.3%(+12.9)#837 |
| 57. | Penn Valley | 16.7% | 5.7%(+10.9)#57 | 4.3%(+12.4)#870 |
| 58. | Scotia | 16.7% | 5.7%(+10.9)#58 | 4.3%(+12.4)#880 |
| 59. | Potomac Park | 16.6% | 5.7%(+10.9)#59 | 4.3%(+12.3)#910 |
| 60. | Indianola | 16.4% | 5.7%(+10.6)#60 | 4.3%(+12.1)#922 |
| 61. | Bootjack | 16.0% | 5.7%(+10.3)#61 | 4.3%(+11.7)#953 |
| 62. | New Cuyama | 15.9% | 5.7%(+10.2)#62 | 4.3%(+11.7)#956 |
| 63. | Mi Wuk Village | 15.5% | 5.7%(+9.77)#63 | 4.3%(+11.3)#1,012 |
| 64. | Moss Beach | 15.5% | 5.7%(+9.72)#64 | 4.3%(+11.2)#1,016 |
| 65. | Deer Park | 15.4% | 5.7%(+9.70)#65 | 4.3%(+11.2)#1,019 |
| 66. | Hidden Hills | 15.4% | 5.7%(+9.65)#66 | 4.3%(+11.1)#1,022 |
| 67. | Lake Almanor Peninsula | 15.4% | 5.7%(+9.65)#67 | 4.3%(+11.1)#1,025 |
| 68. | Pajaro | 15.2% | 5.7%(+9.41)#68 | 4.3%(+10.9)#1,042 |
| 69. | Lucerne Valley | 14.9% | 5.7%(+9.19)#69 | 4.3%(+10.7)#1,071 |
| 70. | Beckwourth | 14.9% | 5.7%(+9.17)#70 | 4.3%(+10.7)#1,076 |
| 71. | Nevada City | 14.8% | 5.7%(+9.10)#71 | 4.3%(+10.6)#1,081 |
| 72. | Hopland | 14.8% | 5.7%(+9.03)#72 | 4.3%(+10.5)#1,089 |
| 73. | Fort Jones | 14.3% | 5.7%(+8.55)#73 | 4.3%(+10.0)#1,146 |
| 74. | Bodega | 14.3% | 5.7%(+8.55)#74 | 4.3%(+10.0)#1,149 |
| 75. | Homestead Valley | 14.3% | 5.7%(+8.52)#75 | 4.3%(+10.0)#1,175 |
| 76. | Parksdale | 14.2% | 5.7%(+8.42)#76 | 4.3%(+9.91)#1,179 |
| 77. | Oildale | 14.1% | 5.7%(+8.38)#77 | 4.3%(+9.87)#1,183 |
| 78. | Lone Pine | 14.1% | 5.7%(+8.34)#78 | 4.3%(+9.83)#1,190 |
| 79. | Santa Venetia | 13.9% | 5.7%(+8.15)#79 | 4.3%(+9.63)#1,214 |
| 80. | Shandon | 13.8% | 5.7%(+8.11)#80 | 4.3%(+9.59)#1,218 |
| 81. | Inverness | 13.8% | 5.7%(+8.07)#81 | 4.3%(+9.56)#1,223 |
| 82. | Stinson Beach | 13.8% | 5.7%(+8.05)#82 | 4.3%(+9.54)#1,228 |
| 83. | Markleeville | 13.8% | 5.7%(+8.05)#83 | 4.3%(+9.54)#1,231 |
| 84. | North Fork | 13.5% | 5.7%(+7.81)#84 | 4.3%(+9.29)#1,258 |
| 85. | Fairfax | 13.5% | 5.7%(+7.79)#85 | 4.3%(+9.28)#1,260 |
| 86. | Fetters Hot Springs Agua Caliente | 13.5% | 5.7%(+7.76)#86 | 4.3%(+9.25)#1,267 |
| 87. | Three Rivers | 13.4% | 5.7%(+7.66)#87 | 4.3%(+9.15)#1,281 |
| 88. | Boyes Hot Springs | 13.4% | 5.7%(+7.66)#88 | 4.3%(+9.14)#1,282 |
| 89. | Cutler | 13.1% | 5.7%(+7.36)#89 | 4.3%(+8.85)#1,335 |
| 90. | Bell Canyon | 13.1% | 5.7%(+7.35)#90 | 4.3%(+8.84)#1,337 |
| 91. | Lagunitas Forest Knolls | 12.9% | 5.7%(+7.15)#91 | 4.3%(+8.64)#1,361 |
| 92. | West Hollywood | 12.8% | 5.7%(+7.11)#92 | 4.3%(+8.60)#1,366 |
| 93. | Whitewater | 12.8% | 5.7%(+7.08)#93 | 4.3%(+8.57)#1,370 |
| 94. | Pleasure Point | 12.8% | 5.7%(+7.01)#94 | 4.3%(+8.50)#1,380 |
| 95. | Thermalito | 12.7% | 5.7%(+6.95)#95 | 4.3%(+8.44)#1,390 |
| 96. | Pescadero | 12.7% | 5.7%(+6.94)#96 | 4.3%(+8.42)#1,392 |
| 97. | Los Olivos | 12.6% | 5.7%(+6.91)#97 | 4.3%(+8.40)#1,395 |
| 98. | Cazadero | 12.6% | 5.7%(+6.89)#98 | 4.3%(+8.38)#1,400 |
| 99. | Monte Rio | 12.5% | 5.7%(+6.76)#99 | 4.3%(+8.25)#1,411 |
| 100. | Amador City | 12.5% | 5.7%(+6.76)#100 | 4.3%(+8.25)#1,424 |
Common Questions
What are the Top 10 Cities with the Highest Percentage of Population with a Degree in Visual and Performing Arts in California?
Top 10 Cities with the Highest Percentage of Population with a Degree in Visual and Performing Arts in California are:
#1
100.0%
#2
100.0%
#3
100.0%
#4
100.0%
#5
100.0%
#6
90.9%
#7
81.6%
#8
74.2%
#9
70.8%
#10
61.1%
What city has the Highest Percentage of Population with a Degree in Visual and Performing Arts in California?
Manchester has the Highest Percentage of Population with a Degree in Visual and Performing Arts in California with 100.0%.
What is the Percentage of Population with a Degree in Visual and Performing Arts in the State of California?
Percentage of Population with a Degree in Visual and Performing Arts in California is 5.7%.
What is the Percentage of Population with a Degree in Visual and Performing Arts in the United States?
Percentage of Population with a Degree in Visual and Performing Arts in the United States is 4.3%.