Cities with the Lowest Child Poverty Level Among Boys Under the Age of 16 in California
RELATED REPORTS & OPTIONS
Lowest Poverty | Boys 0-16
California
Compare Cities
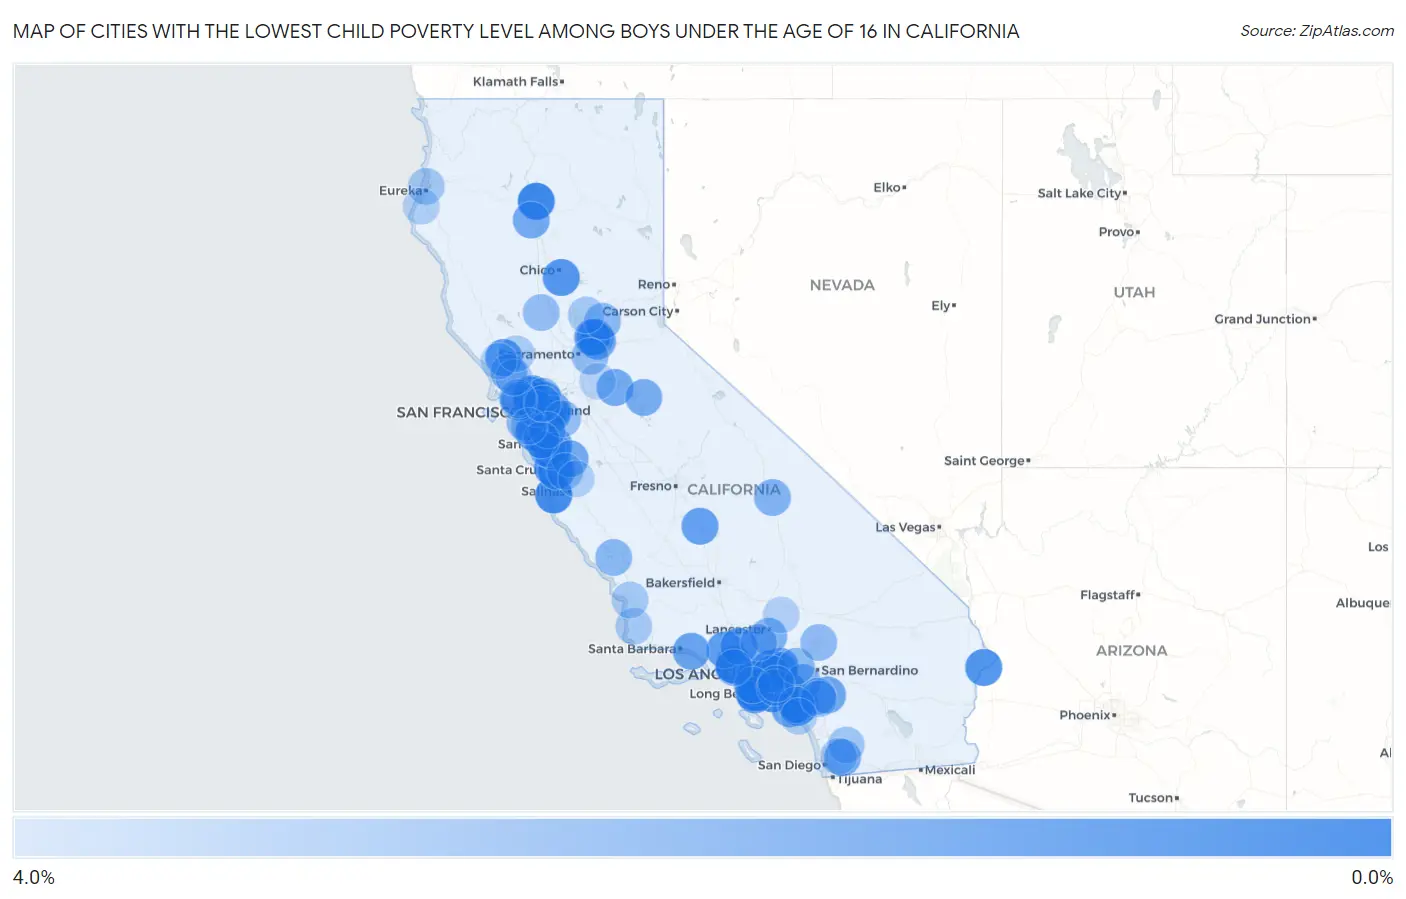
Map of Cities with the Lowest Child Poverty Level Among Boys Under the Age of 16 in California
4.0%
0.0%
Cities with the Lowest Child Poverty Level Among Boys Under the Age of 16 in California
| City | Child Poverty (Boys) | vs State | vs National | |
| 1. | Oak Park | 0.33% | 15.5%(-15.2)#1 | 16.9%(-16.6)#13 |
| 2. | Seal Beach | 0.45% | 15.5%(-15.1)#2 | 16.9%(-16.5)#30 |
| 3. | Bella Vista | 0.48% | 15.5%(-15.1)#3 | 16.9%(-16.4)#35 |
| 4. | La Canada Flintridge | 0.53% | 15.5%(-15.0)#4 | 16.9%(-16.4)#43 |
| 5. | Fairview | 0.67% | 15.5%(-14.9)#5 | 16.9%(-16.2)#71 |
| 6. | Pacific Grove | 0.70% | 15.5%(-14.8)#6 | 16.9%(-16.2)#78 |
| 7. | Rolling Hills Estates | 0.73% | 15.5%(-14.8)#7 | 16.9%(-16.2)#91 |
| 8. | Foster City | 0.76% | 15.5%(-14.8)#8 | 16.9%(-16.1)#99 |
| 9. | Hercules | 0.81% | 15.5%(-14.7)#9 | 16.9%(-16.1)#115 |
| 10. | San Marino | 0.83% | 15.5%(-14.7)#10 | 16.9%(-16.1)#119 |
| 11. | Culver City | 0.83% | 15.5%(-14.7)#11 | 16.9%(-16.1)#121 |
| 12. | Palos Verdes Estates | 0.90% | 15.5%(-14.6)#12 | 16.9%(-16.0)#138 |
| 13. | Soquel | 0.97% | 15.5%(-14.6)#13 | 16.9%(-15.9)#155 |
| 14. | Kensington | 1.0% | 15.5%(-14.5)#14 | 16.9%(-15.9)#181 |
| 15. | Big River | 1.1% | 15.5%(-14.5)#15 | 16.9%(-15.9)#189 |
| 16. | Loomis | 1.1% | 15.5%(-14.4)#16 | 16.9%(-15.8)#218 |
| 17. | Durham | 1.1% | 15.5%(-14.4)#17 | 16.9%(-15.8)#227 |
| 18. | Villa Park | 1.2% | 15.5%(-14.4)#18 | 16.9%(-15.7)#233 |
| 19. | Windsor | 1.3% | 15.5%(-14.3)#19 | 16.9%(-15.7)#273 |
| 20. | Rio Del Mar | 1.3% | 15.5%(-14.3)#20 | 16.9%(-15.6)#276 |
| 21. | Fillmore | 1.3% | 15.5%(-14.2)#21 | 16.9%(-15.6)#299 |
| 22. | Val Verde | 1.3% | 15.5%(-14.2)#22 | 16.9%(-15.6)#309 |
| 23. | Duarte | 1.6% | 15.5%(-14.0)#23 | 16.9%(-15.3)#395 |
| 24. | Matheny | 1.6% | 15.5%(-14.0)#24 | 16.9%(-15.3)#398 |
| 25. | San Carlos | 1.6% | 15.5%(-13.9)#25 | 16.9%(-15.3)#402 |
| 26. | Danville | 1.6% | 15.5%(-13.9)#26 | 16.9%(-15.3)#411 |
| 27. | Irwindale | 1.7% | 15.5%(-13.9)#27 | 16.9%(-15.2)#443 |
| 28. | Los Gatos | 1.7% | 15.5%(-13.9)#28 | 16.9%(-15.2)#447 |
| 29. | Coto De Caza | 1.7% | 15.5%(-13.8)#29 | 16.9%(-15.2)#450 |
| 30. | Reliez Valley | 1.7% | 15.5%(-13.8)#30 | 16.9%(-15.2)#482 |
| 31. | Carpinteria | 1.8% | 15.5%(-13.8)#31 | 16.9%(-15.1)#487 |
| 32. | Redondo Beach | 1.8% | 15.5%(-13.8)#32 | 16.9%(-15.1)#495 |
| 33. | Granite Bay | 1.8% | 15.5%(-13.7)#33 | 16.9%(-15.1)#528 |
| 34. | Rancho Palos Verdes | 1.8% | 15.5%(-13.7)#34 | 16.9%(-15.1)#537 |
| 35. | Orange Blossom | 1.9% | 15.5%(-13.7)#35 | 16.9%(-15.1)#547 |
| 36. | Homeland | 1.9% | 15.5%(-13.7)#36 | 16.9%(-15.0)#553 |
| 37. | Laguna Beach | 1.9% | 15.5%(-13.7)#37 | 16.9%(-15.0)#563 |
| 38. | Burbank | 1.9% | 15.5%(-13.7)#38 | 16.9%(-15.0)#566 |
| 39. | Menlo Park | 1.9% | 15.5%(-13.6)#39 | 16.9%(-15.0)#577 |
| 40. | Los Altos | 1.9% | 15.5%(-13.6)#40 | 16.9%(-15.0)#588 |
| 41. | Saratoga | 1.9% | 15.5%(-13.6)#41 | 16.9%(-15.0)#593 |
| 42. | Rancho Calaveras | 2.0% | 15.5%(-13.6)#42 | 16.9%(-14.9)#611 |
| 43. | Ladera Ranch | 2.0% | 15.5%(-13.6)#43 | 16.9%(-14.9)#613 |
| 44. | Cottonwood | 2.0% | 15.5%(-13.6)#44 | 16.9%(-14.9)#615 |
| 45. | Harbison Canyon | 2.0% | 15.5%(-13.6)#45 | 16.9%(-14.9)#618 |
| 46. | University Of California-Santa Barbara | 2.0% | 15.5%(-13.5)#46 | 16.9%(-14.9)#628 |
| 47. | Morgan Hill | 2.0% | 15.5%(-13.5)#47 | 16.9%(-14.9)#633 |
| 48. | South San Gabriel | 2.0% | 15.5%(-13.5)#48 | 16.9%(-14.9)#646 |
| 49. | Manhattan Beach | 2.1% | 15.5%(-13.5)#49 | 16.9%(-14.9)#661 |
| 50. | East Richmond Heights | 2.1% | 15.5%(-13.5)#50 | 16.9%(-14.9)#662 |
| 51. | Rocklin | 2.1% | 15.5%(-13.4)#51 | 16.9%(-14.8)#699 |
| 52. | East Sonora | 2.2% | 15.5%(-13.4)#52 | 16.9%(-14.7)#740 |
| 53. | Pinole | 2.3% | 15.5%(-13.3)#53 | 16.9%(-14.6)#795 |
| 54. | La Palma | 2.3% | 15.5%(-13.3)#54 | 16.9%(-14.6)#809 |
| 55. | Cotati | 2.3% | 15.5%(-13.2)#55 | 16.9%(-14.6)#828 |
| 56. | Desert View Highlands | 2.3% | 15.5%(-13.2)#56 | 16.9%(-14.6)#836 |
| 57. | Norco | 2.4% | 15.5%(-13.2)#57 | 16.9%(-14.5)#850 |
| 58. | Lone Pine | 2.5% | 15.5%(-13.1)#58 | 16.9%(-14.4)#901 |
| 59. | Meadowbrook | 2.5% | 15.5%(-13.0)#59 | 16.9%(-14.4)#942 |
| 60. | Agua Dulce | 2.6% | 15.5%(-13.0)#60 | 16.9%(-14.3)#967 |
| 61. | San Ramon | 2.6% | 15.5%(-12.9)#61 | 16.9%(-14.3)#1,001 |
| 62. | Lake Nacimiento | 2.6% | 15.5%(-12.9)#62 | 16.9%(-14.3)#1,010 |
| 63. | San Antonio Heights | 2.7% | 15.5%(-12.9)#63 | 16.9%(-14.2)#1,025 |
| 64. | Agoura Hills | 2.7% | 15.5%(-12.9)#64 | 16.9%(-14.2)#1,032 |
| 65. | San Bruno | 2.7% | 15.5%(-12.8)#65 | 16.9%(-14.2)#1,044 |
| 66. | Piedmont | 2.7% | 15.5%(-12.8)#66 | 16.9%(-14.2)#1,056 |
| 67. | Mill Valley | 2.7% | 15.5%(-12.8)#67 | 16.9%(-14.2)#1,060 |
| 68. | Lake Of The Pines | 2.8% | 15.5%(-12.8)#68 | 16.9%(-14.1)#1,081 |
| 69. | Martinez | 2.8% | 15.5%(-12.8)#69 | 16.9%(-14.1)#1,087 |
| 70. | Spring Valley Lake | 2.8% | 15.5%(-12.7)#70 | 16.9%(-14.1)#1,117 |
| 71. | Mather | 2.9% | 15.5%(-12.7)#71 | 16.9%(-14.0)#1,156 |
| 72. | Livermore | 2.9% | 15.5%(-12.6)#72 | 16.9%(-14.0)#1,170 |
| 73. | Mission Viejo | 2.9% | 15.5%(-12.6)#73 | 16.9%(-14.0)#1,182 |
| 74. | Williams | 3.0% | 15.5%(-12.6)#74 | 16.9%(-13.9)#1,195 |
| 75. | Kentfield | 3.0% | 15.5%(-12.5)#75 | 16.9%(-13.9)#1,230 |
| 76. | San Anselmo | 3.0% | 15.5%(-12.5)#76 | 16.9%(-13.9)#1,259 |
| 77. | Strawberry Cdp Marin County | 3.2% | 15.5%(-12.4)#77 | 16.9%(-13.7)#1,348 |
| 78. | Canyon Lake | 3.2% | 15.5%(-12.3)#78 | 16.9%(-13.7)#1,387 |
| 79. | Interlaken | 3.3% | 15.5%(-12.3)#79 | 16.9%(-13.6)#1,406 |
| 80. | San Diego Country Estates | 3.3% | 15.5%(-12.2)#80 | 16.9%(-13.6)#1,418 |
| 81. | Manila | 3.3% | 15.5%(-12.2)#81 | 16.9%(-13.6)#1,446 |
| 82. | Petaluma | 3.4% | 15.5%(-12.1)#82 | 16.9%(-13.5)#1,485 |
| 83. | Vandenberg Afb | 3.4% | 15.5%(-12.1)#83 | 16.9%(-13.5)#1,506 |
| 84. | Arroyo Grande | 3.4% | 15.5%(-12.1)#84 | 16.9%(-13.5)#1,509 |
| 85. | Beale Afb | 3.4% | 15.5%(-12.1)#85 | 16.9%(-13.5)#1,514 |
| 86. | Newark | 3.5% | 15.5%(-12.1)#86 | 16.9%(-13.4)#1,530 |
| 87. | Lakeside | 3.5% | 15.5%(-12.1)#87 | 16.9%(-13.4)#1,533 |
| 88. | Palo Alto | 3.5% | 15.5%(-12.1)#88 | 16.9%(-13.4)#1,536 |
| 89. | Burlingame | 3.5% | 15.5%(-12.0)#89 | 16.9%(-13.4)#1,560 |
| 90. | Calistoga | 3.6% | 15.5%(-12.0)#90 | 16.9%(-13.3)#1,575 |
| 91. | Eastern Goleta Valley | 3.6% | 15.5%(-12.0)#91 | 16.9%(-13.3)#1,596 |
| 92. | Petaluma Center | 3.6% | 15.5%(-11.9)#92 | 16.9%(-13.3)#1,618 |
| 93. | San Clemente | 3.6% | 15.5%(-11.9)#93 | 16.9%(-13.3)#1,627 |
| 94. | Ferndale | 3.7% | 15.5%(-11.9)#94 | 16.9%(-13.2)#1,640 |
| 95. | Forestville | 3.7% | 15.5%(-11.9)#95 | 16.9%(-13.2)#1,643 |
| 96. | San Juan Bautista | 3.7% | 15.5%(-11.8)#96 | 16.9%(-13.2)#1,672 |
| 97. | La Mirada | 3.7% | 15.5%(-11.8)#97 | 16.9%(-13.2)#1,681 |
| 98. | Edwards Afb | 3.8% | 15.5%(-11.8)#98 | 16.9%(-13.1)#1,687 |
| 99. | Lafayette | 3.8% | 15.5%(-11.7)#99 | 16.9%(-13.1)#1,709 |
| 100. | Dogtown | 3.9% | 15.5%(-11.7)#100 | 16.9%(-13.0)#1,754 |
Common Questions
What are the Top 10 Cities with the Lowest Child Poverty Level Among Boys Under the Age of 16 in California?
Top 10 Cities with the Lowest Child Poverty Level Among Boys Under the Age of 16 in California are:
#1
0.33%
#2
0.45%
#3
0.48%
#4
0.67%
#5
0.70%
#6
0.73%
#7
0.76%
#8
0.81%
#9
0.83%
#10
0.83%
What city has the Lowest Child Poverty Level Among Boys Under the Age of 16 in California?
Oak Park has the Lowest Child Poverty Level Among Boys Under the Age of 16 in California with 0.33%.
What is the Poverty Level Among Boys Under the Age of 16 in the State of California?
Poverty Level Among Boys Under the Age of 16 in California is 15.5%.
What is the Poverty Level Among Boys Under the Age of 16 in the United States?
Poverty Level Among Boys Under the Age of 16 in the United States is 16.9%.