Cities with the Most Immigrants from Syria in California
RELATED REPORTS & OPTIONS
Syria
California
Compare Cities
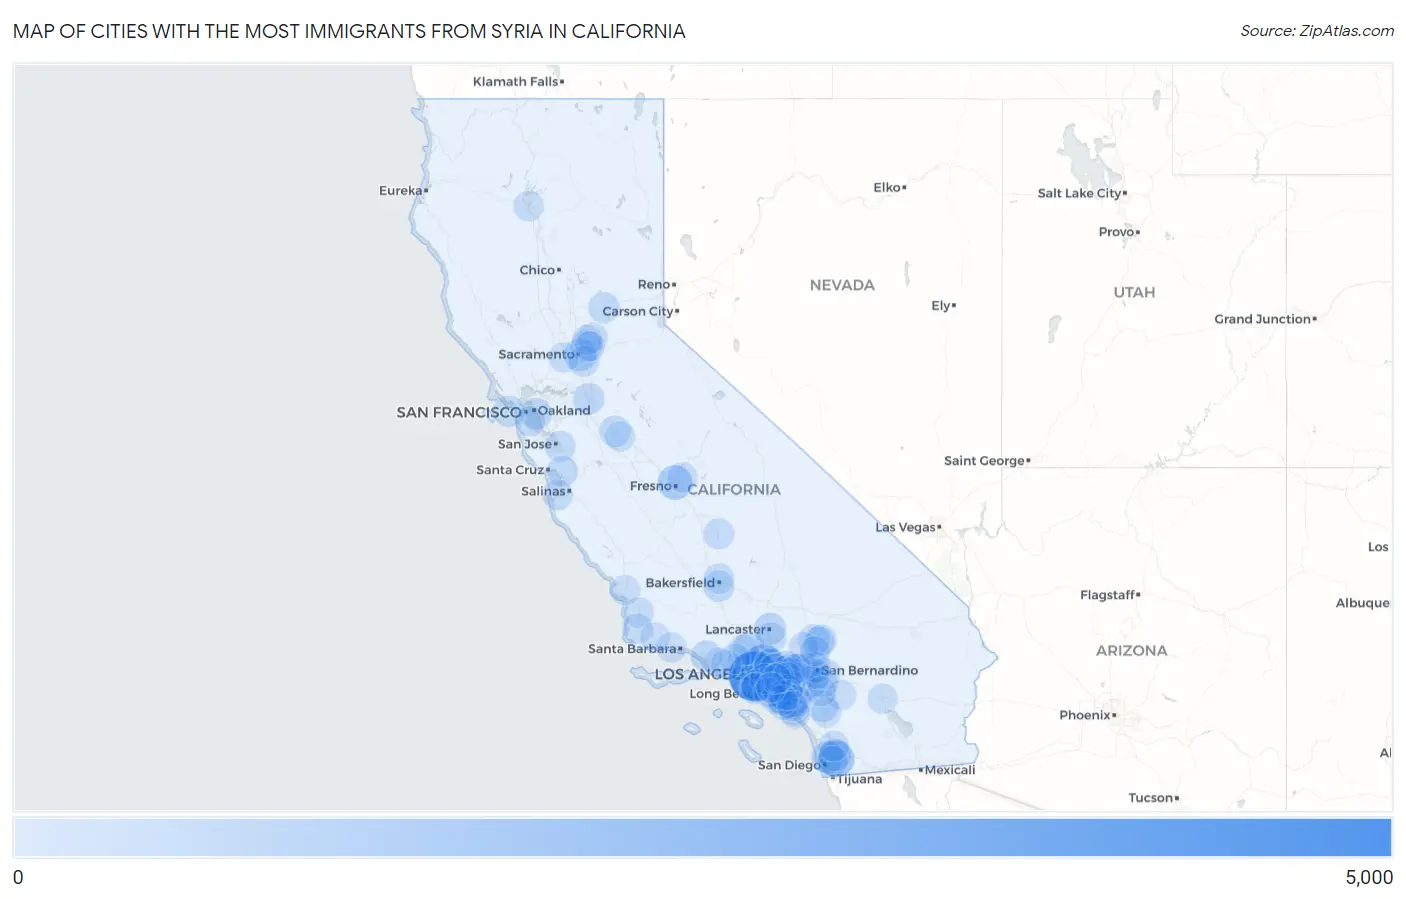
Map of Cities with the Most Immigrants from Syria in California
0
5,000
Cities with the Most Immigrants from Syria in California
| City | Syria | vs State | vs National | |
| 1. | Los Angeles | 4,016 | 30,949(12.98%)#1 | 108,470(3.70%)#2 |
| 2. | Glendale | 1,796 | 30,949(5.80%)#2 | 108,470(1.66%)#4 |
| 3. | Irvine | 1,511 | 30,949(4.88%)#3 | 108,470(1.39%)#5 |
| 4. | El Cajon | 1,284 | 30,949(4.15%)#4 | 108,470(1.18%)#7 |
| 5. | Fresno | 920 | 30,949(2.97%)#5 | 108,470(0.85%)#10 |
| 6. | Glendora | 581 | 30,949(1.88%)#6 | 108,470(0.54%)#19 |
| 7. | Fontana | 536 | 30,949(1.73%)#7 | 108,470(0.49%)#22 |
| 8. | Anaheim | 484 | 30,949(1.56%)#8 | 108,470(0.45%)#23 |
| 9. | San Diego | 480 | 30,949(1.55%)#9 | 108,470(0.44%)#24 |
| 10. | Sacramento | 476 | 30,949(1.54%)#10 | 108,470(0.44%)#25 |
| 11. | Rancho Cucamonga | 467 | 30,949(1.51%)#11 | 108,470(0.43%)#26 |
| 12. | Santa Clarita | 465 | 30,949(1.50%)#12 | 108,470(0.43%)#27 |
| 13. | Santee | 443 | 30,949(1.43%)#13 | 108,470(0.41%)#32 |
| 14. | Lancaster | 431 | 30,949(1.39%)#14 | 108,470(0.40%)#34 |
| 15. | Altadena | 421 | 30,949(1.36%)#15 | 108,470(0.39%)#35 |
| 16. | Pasadena | 411 | 30,949(1.33%)#16 | 108,470(0.38%)#36 |
| 17. | Corona | 406 | 30,949(1.31%)#17 | 108,470(0.37%)#37 |
| 18. | Riverside | 356 | 30,949(1.15%)#18 | 108,470(0.33%)#43 |
| 19. | Murrieta | 346 | 30,949(1.12%)#19 | 108,470(0.32%)#48 |
| 20. | Foothill Farms | 345 | 30,949(1.11%)#20 | 108,470(0.32%)#50 |
| 21. | Stockton | 344 | 30,949(1.11%)#21 | 108,470(0.32%)#51 |
| 22. | Oakland | 331 | 30,949(1.07%)#22 | 108,470(0.31%)#52 |
| 23. | San Buenaventura Ventura | 312 | 30,949(1.01%)#23 | 108,470(0.29%)#57 |
| 24. | Turlock | 297 | 30,949(0.96%)#24 | 108,470(0.27%)#62 |
| 25. | Victorville | 284 | 30,949(0.92%)#25 | 108,470(0.26%)#65 |
| 26. | Spring Valley Lake | 273 | 30,949(0.88%)#26 | 108,470(0.25%)#73 |
| 27. | San Francisco | 272 | 30,949(0.88%)#27 | 108,470(0.25%)#74 |
| 28. | Grass Valley | 264 | 30,949(0.85%)#28 | 108,470(0.24%)#75 |
| 29. | Bakersfield | 255 | 30,949(0.82%)#29 | 108,470(0.24%)#77 |
| 30. | Lawndale | 245 | 30,949(0.79%)#30 | 108,470(0.23%)#78 |
| 31. | Downey | 228 | 30,949(0.74%)#31 | 108,470(0.21%)#86 |
| 32. | Porterville | 227 | 30,949(0.73%)#32 | 108,470(0.21%)#87 |
| 33. | San Jose | 220 | 30,949(0.71%)#33 | 108,470(0.20%)#89 |
| 34. | La Verne | 217 | 30,949(0.70%)#34 | 108,470(0.20%)#91 |
| 35. | Redlands | 209 | 30,949(0.68%)#35 | 108,470(0.19%)#96 |
| 36. | Watsonville | 209 | 30,949(0.68%)#36 | 108,470(0.19%)#97 |
| 37. | Stanton | 207 | 30,949(0.67%)#37 | 108,470(0.19%)#99 |
| 38. | Florin | 200 | 30,949(0.65%)#38 | 108,470(0.18%)#103 |
| 39. | Stevenson Ranch | 186 | 30,949(0.60%)#39 | 108,470(0.17%)#110 |
| 40. | Lake Forest | 185 | 30,949(0.60%)#40 | 108,470(0.17%)#112 |
| 41. | Torrance | 177 | 30,949(0.57%)#41 | 108,470(0.16%)#117 |
| 42. | Apple Valley | 175 | 30,949(0.57%)#42 | 108,470(0.16%)#119 |
| 43. | La Mesa | 172 | 30,949(0.56%)#43 | 108,470(0.16%)#122 |
| 44. | Placentia | 171 | 30,949(0.55%)#44 | 108,470(0.16%)#124 |
| 45. | Moreno Valley | 168 | 30,949(0.54%)#45 | 108,470(0.15%)#126 |
| 46. | Fullerton | 158 | 30,949(0.51%)#46 | 108,470(0.15%)#138 |
| 47. | Laguna Niguel | 152 | 30,949(0.49%)#47 | 108,470(0.14%)#147 |
| 48. | Fountain Valley | 148 | 30,949(0.48%)#48 | 108,470(0.14%)#151 |
| 49. | Oildale | 148 | 30,949(0.48%)#49 | 108,470(0.14%)#152 |
| 50. | Poway | 146 | 30,949(0.47%)#50 | 108,470(0.13%)#156 |
| 51. | Monterey | 145 | 30,949(0.47%)#51 | 108,470(0.13%)#158 |
| 52. | Redding | 139 | 30,949(0.45%)#52 | 108,470(0.13%)#161 |
| 53. | Westminster | 138 | 30,949(0.45%)#53 | 108,470(0.13%)#162 |
| 54. | San Bernardino | 133 | 30,949(0.43%)#54 | 108,470(0.12%)#166 |
| 55. | Huntington Beach | 128 | 30,949(0.41%)#55 | 108,470(0.12%)#169 |
| 56. | Santa Maria | 126 | 30,949(0.41%)#56 | 108,470(0.12%)#176 |
| 57. | Vandenberg Village | 126 | 30,949(0.41%)#57 | 108,470(0.12%)#177 |
| 58. | Covina | 115 | 30,949(0.37%)#58 | 108,470(0.11%)#185 |
| 59. | Garden Grove | 112 | 30,949(0.36%)#59 | 108,470(0.10%)#190 |
| 60. | Simi Valley | 111 | 30,949(0.36%)#60 | 108,470(0.10%)#193 |
| 61. | Yorba Linda | 109 | 30,949(0.35%)#61 | 108,470(0.10%)#197 |
| 62. | Thousand Oaks | 107 | 30,949(0.35%)#62 | 108,470(0.10%)#200 |
| 63. | Delhi | 103 | 30,949(0.33%)#63 | 108,470(0.09%)#207 |
| 64. | Palmdale | 101 | 30,949(0.33%)#64 | 108,470(0.09%)#208 |
| 65. | San Dimas | 101 | 30,949(0.33%)#65 | 108,470(0.09%)#210 |
| 66. | Solvang | 98 | 30,949(0.32%)#66 | 108,470(0.09%)#217 |
| 67. | University Of California Davis | 96 | 30,949(0.31%)#67 | 108,470(0.09%)#219 |
| 68. | Clovis | 94 | 30,949(0.30%)#68 | 108,470(0.09%)#221 |
| 69. | Arcadia | 94 | 30,949(0.30%)#69 | 108,470(0.09%)#222 |
| 70. | Phelan | 94 | 30,949(0.30%)#70 | 108,470(0.09%)#224 |
| 71. | Colton | 93 | 30,949(0.30%)#71 | 108,470(0.09%)#225 |
| 72. | Buena Park | 86 | 30,949(0.28%)#72 | 108,470(0.08%)#237 |
| 73. | Orange | 85 | 30,949(0.27%)#73 | 108,470(0.08%)#239 |
| 74. | South San Francisco | 84 | 30,949(0.27%)#74 | 108,470(0.08%)#244 |
| 75. | Valle Vista | 84 | 30,949(0.27%)#75 | 108,470(0.08%)#247 |
| 76. | Rocklin | 81 | 30,949(0.26%)#76 | 108,470(0.07%)#255 |
| 77. | Huntington Park | 81 | 30,949(0.26%)#77 | 108,470(0.07%)#256 |
| 78. | Goleta | 79 | 30,949(0.26%)#78 | 108,470(0.07%)#263 |
| 79. | Temecula | 77 | 30,949(0.25%)#79 | 108,470(0.07%)#272 |
| 80. | Diamond Bar | 74 | 30,949(0.24%)#80 | 108,470(0.07%)#284 |
| 81. | Dana Point | 74 | 30,949(0.24%)#81 | 108,470(0.07%)#287 |
| 82. | Long Beach | 73 | 30,949(0.24%)#82 | 108,470(0.07%)#289 |
| 83. | Newport Beach | 72 | 30,949(0.23%)#83 | 108,470(0.07%)#293 |
| 84. | Santa Ana | 69 | 30,949(0.22%)#84 | 108,470(0.06%)#299 |
| 85. | San Luis Obispo | 69 | 30,949(0.22%)#85 | 108,470(0.06%)#302 |
| 86. | Perris | 66 | 30,949(0.21%)#86 | 108,470(0.06%)#312 |
| 87. | Redondo Beach | 66 | 30,949(0.21%)#87 | 108,470(0.06%)#313 |
| 88. | Pomona | 65 | 30,949(0.21%)#88 | 108,470(0.06%)#316 |
| 89. | Tustin | 63 | 30,949(0.20%)#89 | 108,470(0.06%)#324 |
| 90. | Costa Mesa | 61 | 30,949(0.20%)#90 | 108,470(0.06%)#334 |
| 91. | Upland | 59 | 30,949(0.19%)#91 | 108,470(0.05%)#340 |
| 92. | Roseville | 58 | 30,949(0.19%)#92 | 108,470(0.05%)#342 |
| 93. | Camarillo | 58 | 30,949(0.19%)#93 | 108,470(0.05%)#343 |
| 94. | Hacienda Heights | 56 | 30,949(0.18%)#94 | 108,470(0.05%)#350 |
| 95. | Coachella | 56 | 30,949(0.18%)#95 | 108,470(0.05%)#351 |
| 96. | Citrus Heights | 55 | 30,949(0.18%)#96 | 108,470(0.05%)#355 |
| 97. | Whittier | 52 | 30,949(0.17%)#97 | 108,470(0.05%)#361 |
| 98. | Aliso Viejo | 52 | 30,949(0.17%)#98 | 108,470(0.05%)#363 |
| 99. | Hesperia | 50 | 30,949(0.16%)#99 | 108,470(0.05%)#369 |
| 100. | Lakewood | 48 | 30,949(0.16%)#100 | 108,470(0.04%)#379 |
Common Questions
What are the Top 10 Cities with the Most Immigrants from Syria in California?
Top 10 Cities with the Most Immigrants from Syria in California are:
#1
4,016
#2
1,796
#3
1,511
#4
1,284
#5
920
#6
581
#7
536
#8
484
#9
480
#10
476
What city has the Most Immigrants from Syria in California?
Los Angeles has the Most Immigrants from Syria in California with 4,016.
What is the Total Immigrants from Syria in the State of California?
Total Immigrants from Syria in California is 30,949.
What is the Total Immigrants from Syria in the United States?
Total Immigrants from Syria in the United States is 108,470.