North Dakota Map & Demographics
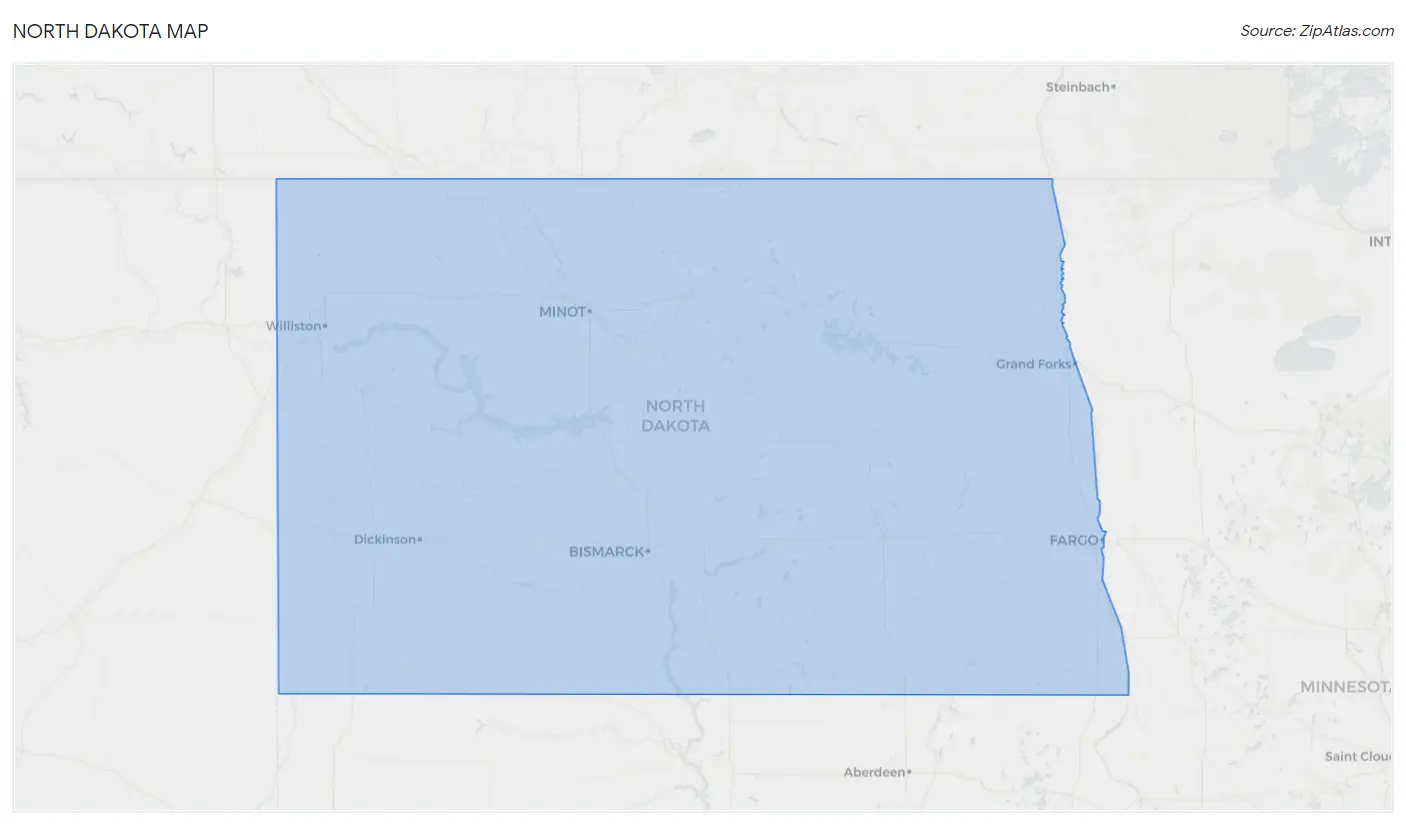
North Dakota Map
North Dakota Overview
Nov 2, 1889
INCORPORATED
70,698
TOTAL AREA [ SQ MI ]
69,001
LAND AREA [ SQ MI ]
1,697
WATER AREA [ SQ MI ]
1,900
ELEVATION AVG [ FT ]
3,506
ELEVATION HIGH [ FT ]
750
ELEVATION LOW [ FT ]
11.3
POP DENSITY [ PPL / SQ MI ]
$40,748
PER CAPITA INCOME
$100,188
AVG FAMILY INCOME
$73,959
AVG HOUSEHOLD INCOME
30.5%
WAGE / INCOME GAP [ % ]
69.5¢/ $1
WAGE / INCOME GAP [ $ ]
$11,587
FAMILY INCOME DEFICIT
0.45
INEQUALITY / GINI INDEX
58103
LARGEST ZIP CODE
Fargo
LARGEST CITY
Cass County
LARGEST COUNTY
776,874
TOTAL POPULATION
399,345
MALE POPULATION
377,529
FEMALE POPULATION
105.78
MALES / 100 FEMALES
94.54
FEMALES / 100 MALES
35.4
MEDIAN AGE
3.0
AVG FAMILY SIZE
2.3
AVG HOUSEHOLD SIZE
423,527
LABOR FORCE [ PEOPLE ]
69.1%
PERCENT IN LABOR FORCE
2.9%
UNEMPLOYMENT RATE
North Dakota Area Codes
Income in North Dakota
Income Overview in North Dakota
Per Capita Income in North Dakota is $40,748, while median incomes of families and households are $100,188 and $73,959 respectively.
| Characteristic | Number | Measure |
| Per Capita Income | 776,874 | $40,748 |
| Median Family Income | 188,317 | $100,188 |
| Mean Family Income | 188,317 | $122,601 |
| Median Household Income | 320,038 | $73,959 |
| Mean Household Income | 320,038 | $97,221 |
| Income Deficit | 188,317 | $11,587 |
| Wage / Income Gap (%) | 776,874 | 30.51% |
| Wage / Income Gap ($) | 776,874 | 69.49¢ per $1 |
| Gini / Inequality Index | 776,874 | 0.45 |
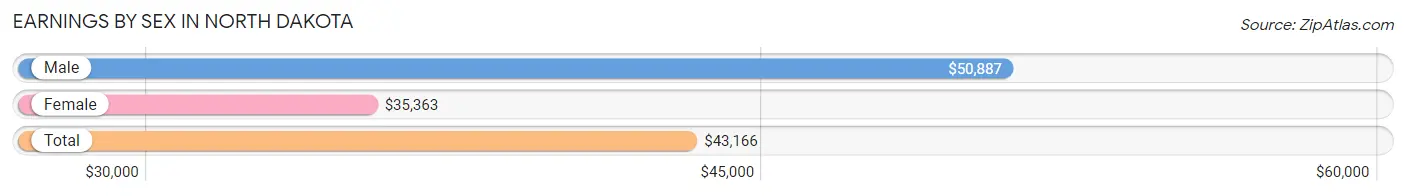
Earnings by Sex in North Dakota
Average Earnings in North Dakota are $43,166, $50,887 for men and $35,363 for women, a difference of 30.5%.
| Sex | Number | Average Earnings |
| Male | 248,240 (54.7%) | $50,887 |
| Female | 205,920 (45.3%) | $35,363 |
| Total | 454,160 (100.0%) | $43,166 |
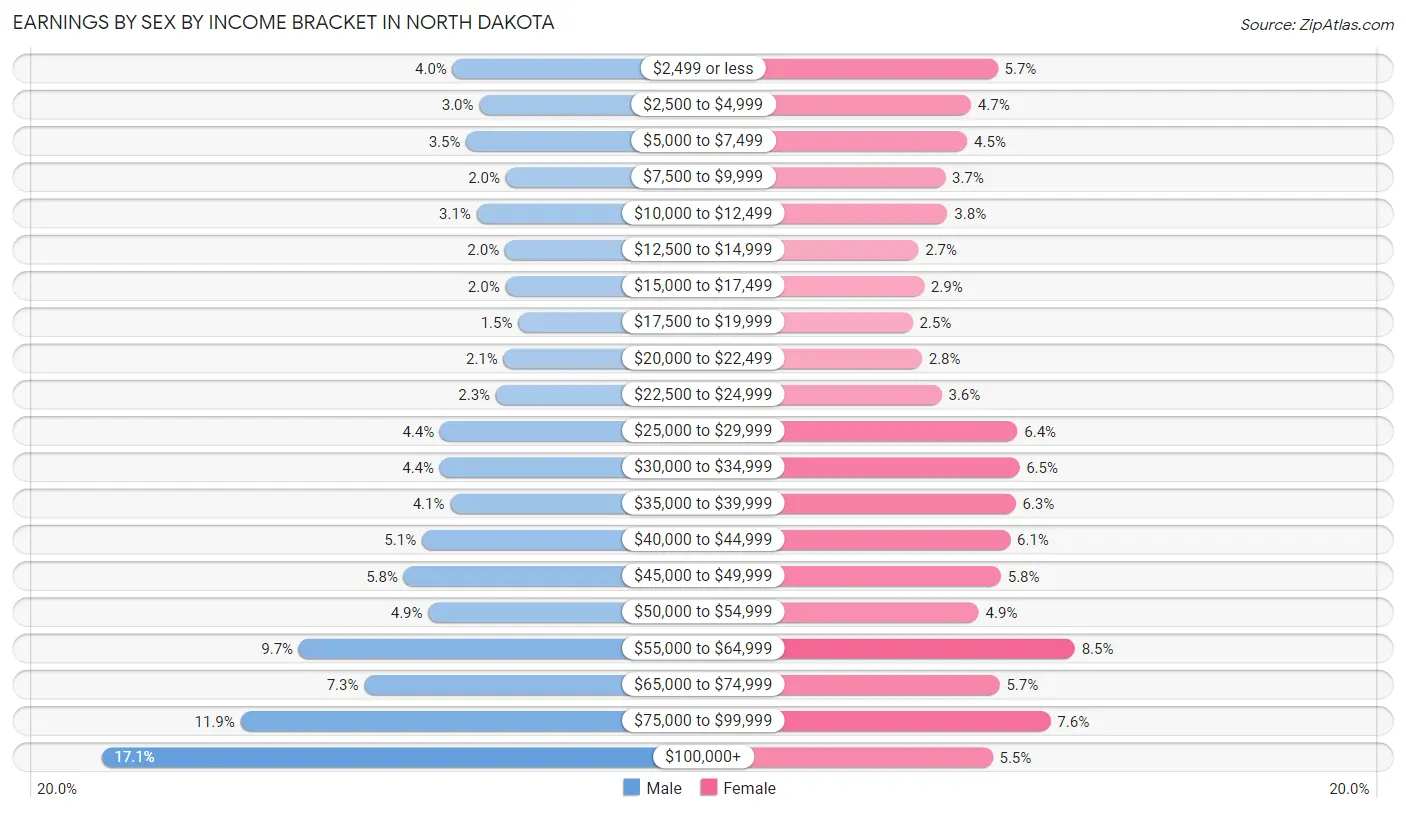
Earnings by Sex by Income Bracket in North Dakota
The most common earnings brackets in North Dakota are $100,000+ for men (42,502 | 17.1%) and $55,000 to $64,999 for women (17,576 | 8.5%).
| Income | Male | Female |
| $2,499 or less | 9,831 (4.0%) | 11,638 (5.7%) |
| $2,500 to $4,999 | 7,350 (3.0%) | 9,576 (4.6%) |
| $5,000 to $7,499 | 8,557 (3.5%) | 9,279 (4.5%) |
| $7,500 to $9,999 | 4,902 (2.0%) | 7,568 (3.7%) |
| $10,000 to $12,499 | 7,602 (3.1%) | 7,764 (3.8%) |
| $12,500 to $14,999 | 4,977 (2.0%) | 5,509 (2.7%) |
| $15,000 to $17,499 | 4,919 (2.0%) | 5,955 (2.9%) |
| $17,500 to $19,999 | 3,731 (1.5%) | 5,066 (2.5%) |
| $20,000 to $22,499 | 5,090 (2.1%) | 5,783 (2.8%) |
| $22,500 to $24,999 | 5,808 (2.3%) | 7,313 (3.5%) |
| $25,000 to $29,999 | 10,991 (4.4%) | 13,156 (6.4%) |
| $30,000 to $34,999 | 11,026 (4.4%) | 13,312 (6.5%) |
| $35,000 to $39,999 | 10,050 (4.1%) | 13,024 (6.3%) |
| $40,000 to $44,999 | 12,695 (5.1%) | 12,611 (6.1%) |
| $45,000 to $49,999 | 14,362 (5.8%) | 11,877 (5.8%) |
| $50,000 to $54,999 | 12,094 (4.9%) | 10,172 (4.9%) |
| $55,000 to $64,999 | 24,122 (9.7%) | 17,576 (8.5%) |
| $65,000 to $74,999 | 18,058 (7.3%) | 11,784 (5.7%) |
| $75,000 to $99,999 | 29,573 (11.9%) | 15,709 (7.6%) |
| $100,000+ | 42,502 (17.1%) | 11,248 (5.5%) |
| Total | 248,240 (100.0%) | 205,920 (100.0%) |
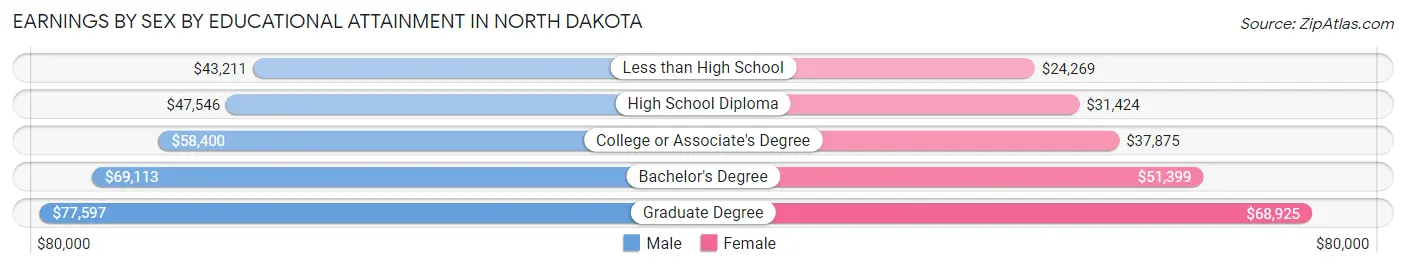
Earnings by Sex by Educational Attainment in North Dakota
Average earnings in North Dakota are $58,319 for men and $42,088 for women, a difference of 27.8%. Men with an educational attainment of graduate degree enjoy the highest average annual earnings of $77,597, while those with less than high school education earn the least with $43,211. Women with an educational attainment of graduate degree earn the most with the average annual earnings of $68,925, while those with less than high school education have the smallest earnings of $24,269.
| Educational Attainment | Male Income | Female Income |
| Less than High School | $43,211 | $24,269 |
| High School Diploma | $47,546 | $31,424 |
| College or Associate's Degree | $58,400 | $37,875 |
| Bachelor's Degree | $69,113 | $51,399 |
| Graduate Degree | $77,597 | $68,925 |
| Total | $58,319 | $42,088 |
Family Income in North Dakota
Family Income Brackets in North Dakota
According to the North Dakota family income data, there are 47,644 families falling into the $100,000 to $149,999 income range, which is the most common income bracket and makes up 25.3% of all families. Conversely, the $10,000 to $14,999 income bracket is the least frequent group with only 2,636 families (1.4%) belonging to this category.
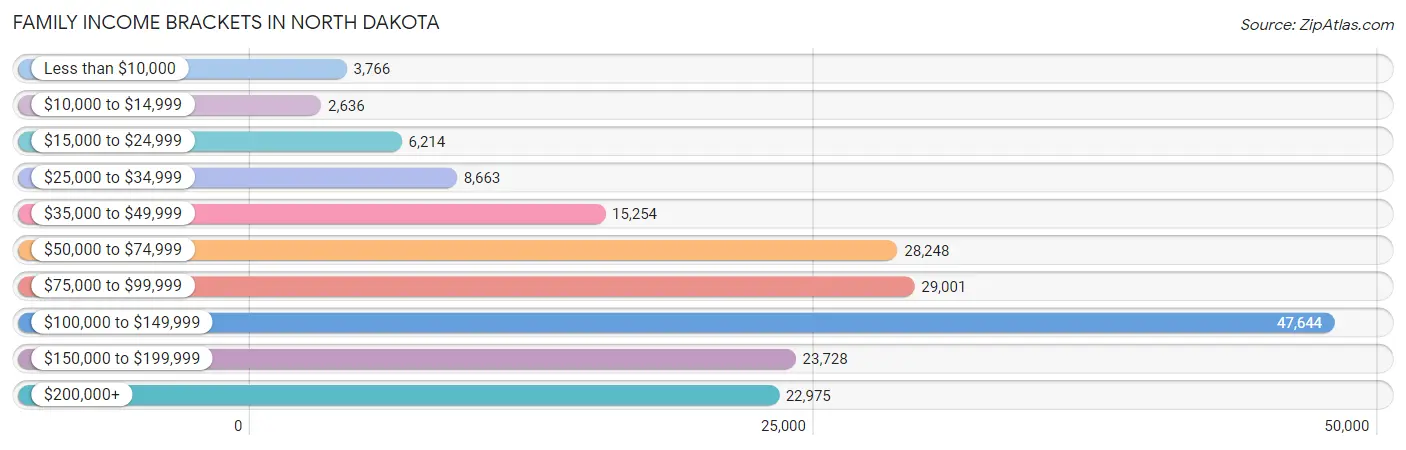
| Income Bracket | # Families | % Families |
| Less than $10,000 | 3,766 | 2.0% |
| $10,000 to $14,999 | 2,636 | 1.4% |
| $15,000 to $24,999 | 6,214 | 3.3% |
| $25,000 to $34,999 | 8,663 | 4.6% |
| $35,000 to $49,999 | 15,254 | 8.1% |
| $50,000 to $74,999 | 28,248 | 15.0% |
| $75,000 to $99,999 | 29,001 | 15.4% |
| $100,000 to $149,999 | 47,644 | 25.3% |
| $150,000 to $199,999 | 23,728 | 12.6% |
| $200,000+ | 22,975 | 12.2% |
Family Income by Famaliy Size in North Dakota
4-person families (30,092 | 16.0%) account for the highest median family income in North Dakota with $123,092 per family, while 2-person families (98,304 | 52.2%) have the highest median income of $44,826 per family member.
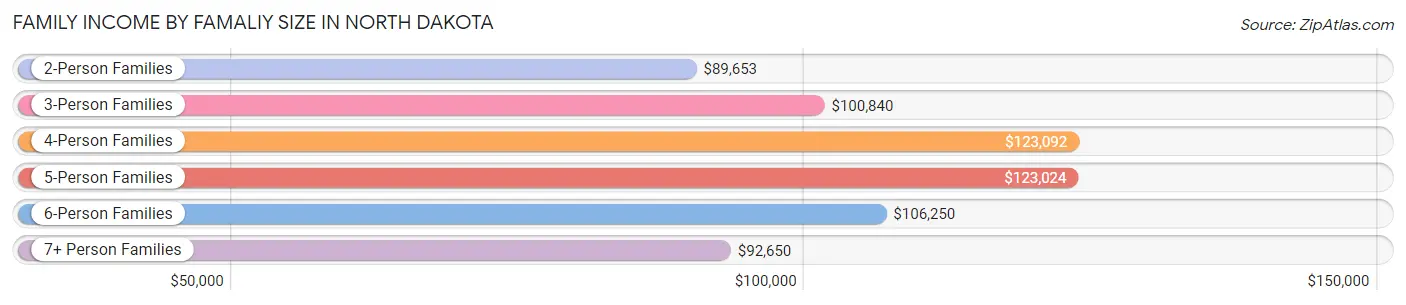
| Income Bracket | # Families | Median Income |
| 2-Person Families | 98,304 (52.2%) | $89,653 |
| 3-Person Families | 35,613 (18.9%) | $100,840 |
| 4-Person Families | 30,092 (16.0%) | $123,092 |
| 5-Person Families | 16,007 (8.5%) | $123,024 |
| 6-Person Families | 5,838 (3.1%) | $106,250 |
| 7+ Person Families | 2,463 (1.3%) | $92,650 |
| Total | 188,317 (100.0%) | $100,188 |
Family Income by Number of Earners in North Dakota
The median family income in North Dakota is $100,188, with families comprising 3+ earners (18,141) having the highest median family income of $150,553, while families with no earners (23,466) have the lowest median family income of $55,033, accounting for 9.6% and 12.5% of families, respectively.
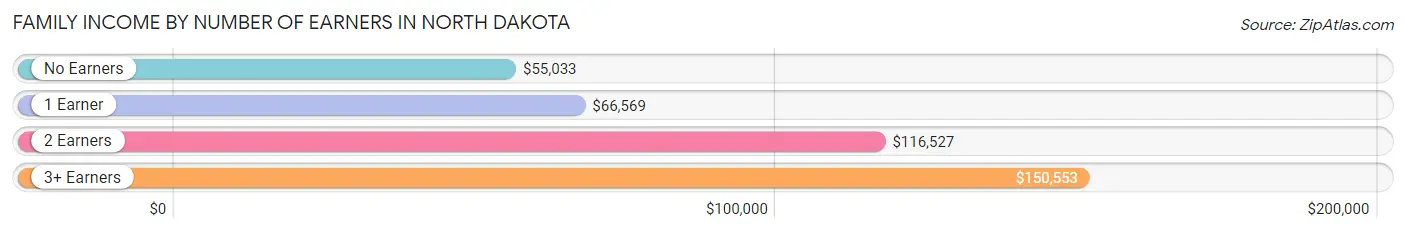
| Number of Earners | # Families | Median Income |
| No Earners | 23,466 (12.5%) | $55,033 |
| 1 Earner | 51,253 (27.2%) | $66,569 |
| 2 Earners | 95,457 (50.7%) | $116,527 |
| 3+ Earners | 18,141 (9.6%) | $150,553 |
| Total | 188,317 (100.0%) | $100,188 |
Household Income in North Dakota
Household Income Brackets in North Dakota
With 60,167 households falling in the category, the $100,000 to $149,999 income range is the most frequent in North Dakota, accounting for 18.8% of all households. In contrast, only 11,521 households (3.6%) fall into the $10,000 to $14,999 income bracket, making it the least populous group.
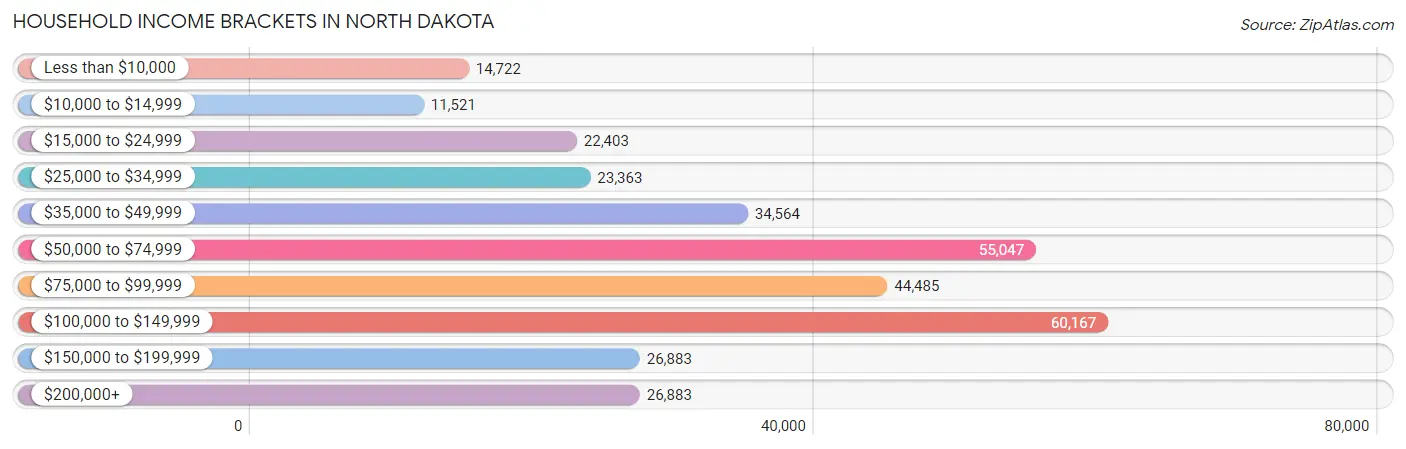
| Income Bracket | # Households | % Households |
| Less than $10,000 | 14,722 | 4.6% |
| $10,000 to $14,999 | 11,521 | 3.6% |
| $15,000 to $24,999 | 22,403 | 7.0% |
| $25,000 to $34,999 | 23,363 | 7.3% |
| $35,000 to $49,999 | 34,564 | 10.8% |
| $50,000 to $74,999 | 55,047 | 17.2% |
| $75,000 to $99,999 | 44,485 | 13.9% |
| $100,000 to $149,999 | 60,167 | 18.8% |
| $150,000 to $199,999 | 26,883 | 8.4% |
| $200,000+ | 26,883 | 8.4% |
Household Income by Householder Age in North Dakota
The median household income in North Dakota is $73,959, with the highest median household income of $93,205 found in the 45 to 64 years age bracket for the primary householder. A total of 101,232 households (31.6%) fall into this category. Meanwhile, the 15 to 24 years age bracket for the primary householder has the lowest median household income of $41,000, with 26,011 households (8.1%) in this group.
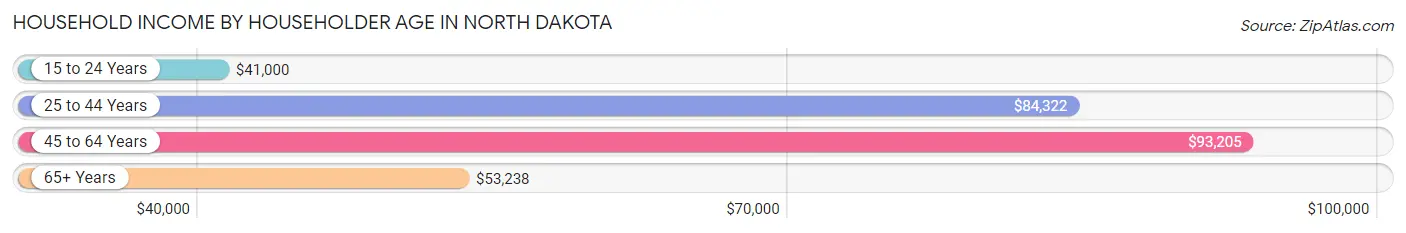
| Income Bracket | # Households | Median Income |
| 15 to 24 Years | 26,011 (8.1%) | $41,000 |
| 25 to 44 Years | 114,748 (35.8%) | $84,322 |
| 45 to 64 Years | 101,232 (31.6%) | $93,205 |
| 65+ Years | 78,047 (24.4%) | $53,238 |
| Total | 320,038 (100.0%) | $73,959 |
Poverty in North Dakota
Income Below Poverty by Sex and Age in North Dakota
With 9.8% poverty level for males and 11.8% for females among the residents of North Dakota, 18 to 24 year old males and 18 to 24 year old females are the most vulnerable to poverty, with 9,214 males (23.6%) and 9,803 females (27.4%) in their respective age groups living below the poverty level.
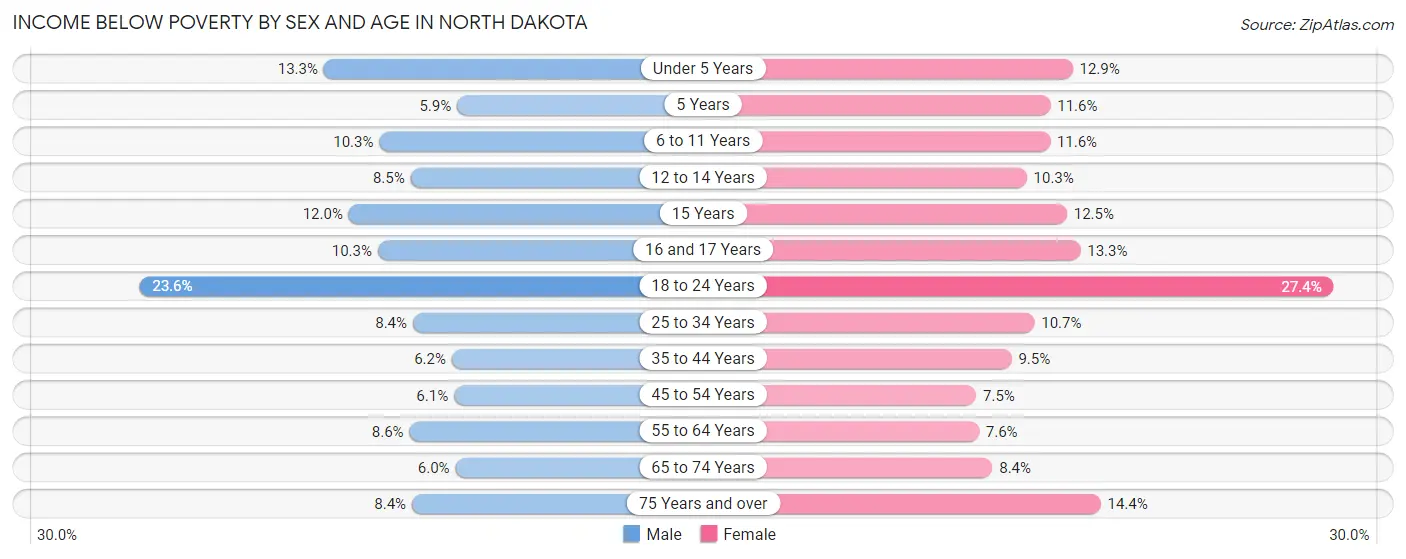
| Age Bracket | Male | Female |
| Under 5 Years | 3,509 (13.3%) | 3,135 (12.9%) |
| 5 Years | 305 (5.9%) | 584 (11.6%) |
| 6 to 11 Years | 3,206 (10.2%) | 3,369 (11.6%) |
| 12 to 14 Years | 1,348 (8.5%) | 1,568 (10.3%) |
| 15 Years | 539 (11.9%) | 580 (12.5%) |
| 16 and 17 Years | 995 (10.3%) | 1,195 (13.3%) |
| 18 to 24 Years | 9,214 (23.6%) | 9,803 (27.4%) |
| 25 to 34 Years | 4,987 (8.4%) | 5,566 (10.7%) |
| 35 to 44 Years | 3,199 (6.2%) | 4,269 (9.5%) |
| 45 to 54 Years | 2,491 (6.1%) | 2,822 (7.5%) |
| 55 to 64 Years | 4,041 (8.6%) | 3,474 (7.6%) |
| 65 to 74 Years | 2,077 (6.0%) | 2,879 (8.4%) |
| 75 Years and over | 1,670 (8.4%) | 3,985 (14.4%) |
| Total | 37,581 (9.8%) | 43,229 (11.8%) |
Income Above Poverty by Sex and Age in North Dakota
According to the poverty statistics in North Dakota, males aged 5 years and females aged 45 to 54 years are the age groups that are most secure financially, with 94.1% of males and 92.5% of females in these age groups living above the poverty line.
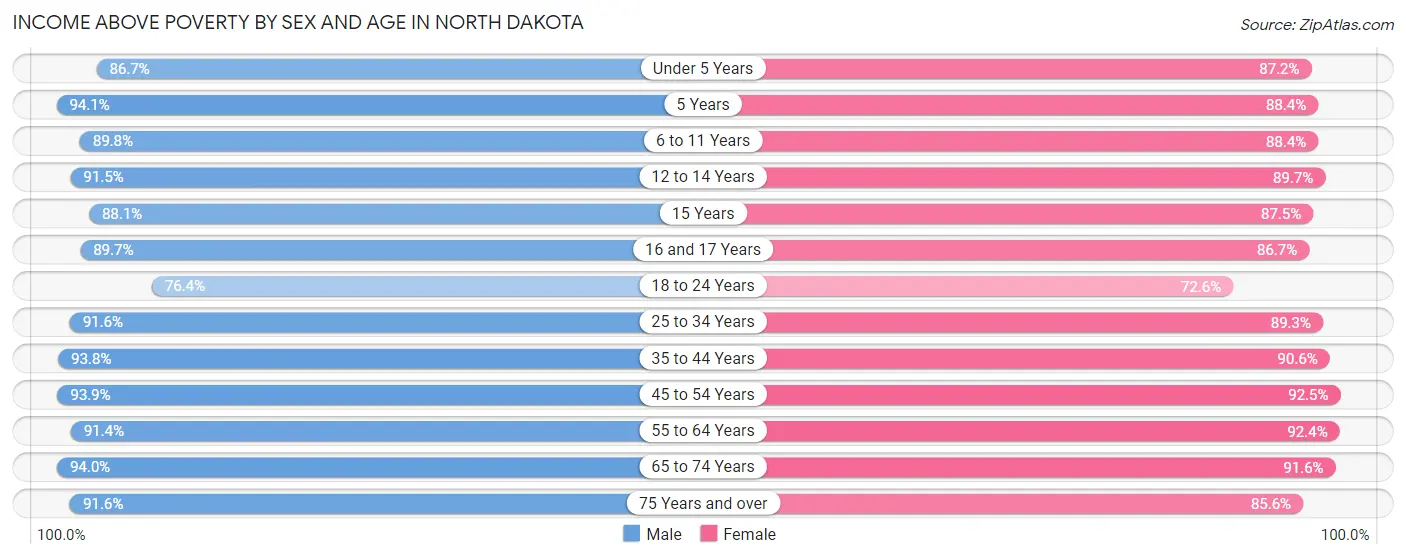
| Age Bracket | Male | Female |
| Under 5 Years | 22,797 (86.7%) | 21,271 (87.2%) |
| 5 Years | 4,844 (94.1%) | 4,447 (88.4%) |
| 6 to 11 Years | 28,078 (89.7%) | 25,688 (88.4%) |
| 12 to 14 Years | 14,496 (91.5%) | 13,666 (89.7%) |
| 15 Years | 3,972 (88.0%) | 4,050 (87.5%) |
| 16 and 17 Years | 8,633 (89.7%) | 7,806 (86.7%) |
| 18 to 24 Years | 29,807 (76.4%) | 25,995 (72.6%) |
| 25 to 34 Years | 54,517 (91.6%) | 46,348 (89.3%) |
| 35 to 44 Years | 48,334 (93.8%) | 40,916 (90.5%) |
| 45 to 54 Years | 38,431 (93.9%) | 34,914 (92.5%) |
| 55 to 64 Years | 43,107 (91.4%) | 42,067 (92.4%) |
| 65 to 74 Years | 32,504 (94.0%) | 31,474 (91.6%) |
| 75 Years and over | 18,129 (91.6%) | 23,675 (85.6%) |
| Total | 347,649 (90.2%) | 322,317 (88.2%) |
Income Below Poverty Among Married-Couple Families in North Dakota
The poverty statistics for married-couple families in North Dakota show that 3.2% or 4,890 of the total 151,567 families live below the poverty line. Families with 5 or more children have the highest poverty rate of 18.2%, comprising of 287 families. On the other hand, families with no children have the lowest poverty rate of 2.5%, which includes 2,199 families.
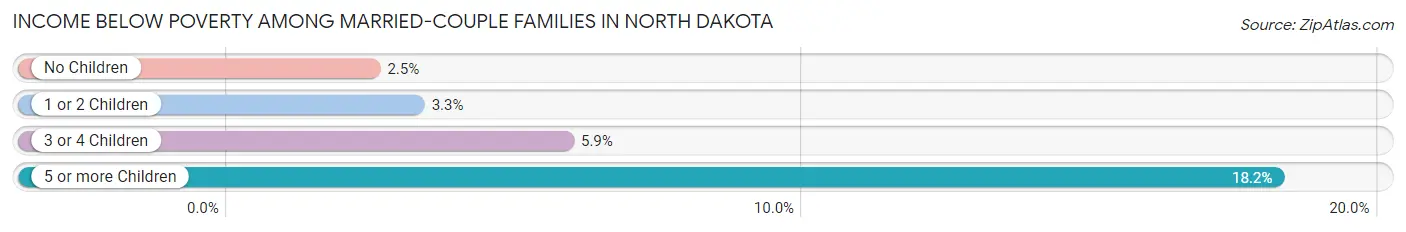
| Children | Above Poverty | Below Poverty |
| No Children | 86,540 (97.5%) | 2,199 (2.5%) |
| 1 or 2 Children | 43,873 (96.8%) | 1,474 (3.3%) |
| 3 or 4 Children | 14,975 (94.2%) | 930 (5.9%) |
| 5 or more Children | 1,289 (81.8%) | 287 (18.2%) |
| Total | 146,677 (96.8%) | 4,890 (3.2%) |
Income Below Poverty Among Single-Parent Households in North Dakota
According to the poverty data in North Dakota, 8.3% or 1,052 single-father households and 23.4% or 5,625 single-mother households are living below the poverty line. Among single-father households, those with 5 or more children have the highest poverty rate, with 72 households (30.1%) experiencing poverty. Likewise, among single-mother households, those with 5 or more children have the highest poverty rate, with 213 households (67.8%) falling below the poverty line.
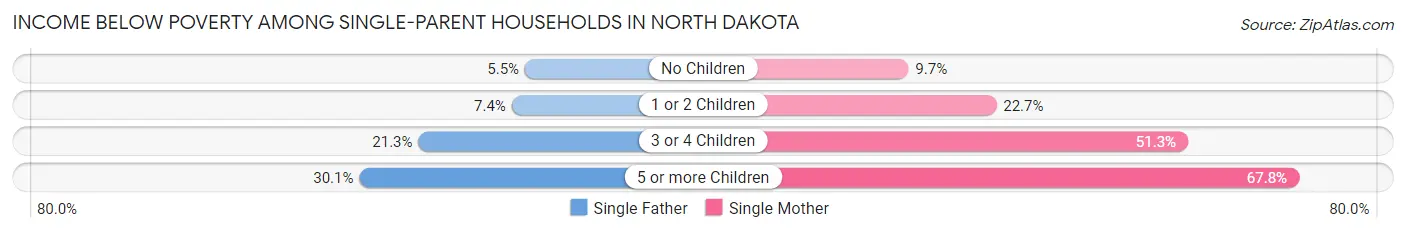
| Children | Single Father | Single Mother |
| No Children | 267 (5.4%) | 640 (9.7%) |
| 1 or 2 Children | 482 (7.4%) | 3,180 (22.7%) |
| 3 or 4 Children | 231 (21.3%) | 1,592 (51.3%) |
| 5 or more Children | 72 (30.1%) | 213 (67.8%) |
| Total | 1,052 (8.3%) | 5,625 (23.4%) |
Income Below Poverty Among Married-Couple vs Single-Parent Households in North Dakota
The poverty data for North Dakota shows that 4,890 of the married-couple family households (3.2%) and 6,677 of the single-parent households (18.2%) are living below the poverty level. Within the married-couple family households, those with 5 or more children have the highest poverty rate, with 287 households (18.2%) falling below the poverty line. Among the single-parent households, those with 5 or more children have the highest poverty rate, with 285 household (51.5%) living below poverty.
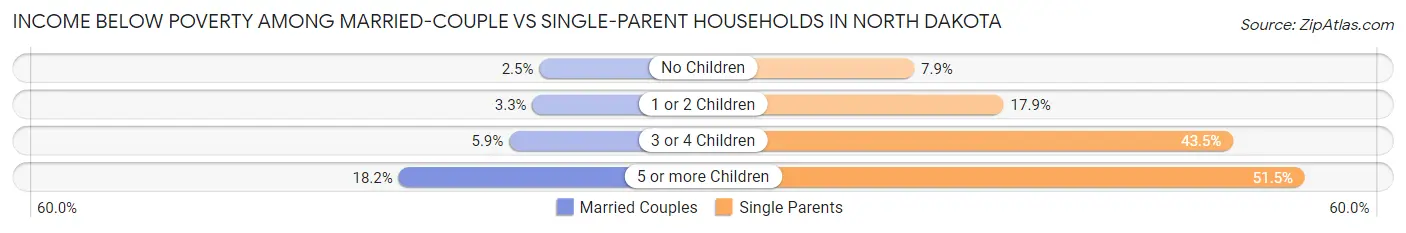
| Children | Married-Couple Families | Single-Parent Households |
| No Children | 2,199 (2.5%) | 907 (7.9%) |
| 1 or 2 Children | 1,474 (3.3%) | 3,662 (17.9%) |
| 3 or 4 Children | 930 (5.9%) | 1,823 (43.5%) |
| 5 or more Children | 287 (18.2%) | 285 (51.5%) |
| Total | 4,890 (3.2%) | 6,677 (18.2%) |
Largest Zip Codes by Population in North Dakota
The largest zip codes in North Dakota by population are 58103 (48,577), 58104 (46,165), 58201 (42,353), 58078 (39,243), and 58503 (36,944).
1.58103
48,577 (6.25%)
2.58104
46,165 (5.94%)
3.58201
42,353 (5.45%)
4.58078
39,243 (5.05%)
5.58503
36,944 (4.76%)
6.58801
33,579 (4.32%)
7.58701
32,855 (4.23%)
8.58102
32,256 (4.15%)
9.58504
29,545 (3.80%)
10.58601
29,309 (3.77%)
11.58554
28,814 (3.71%)
12.58501
28,579 (3.68%)
13.58703
22,780 (2.93%)
14.58401
17,410 (2.24%)
15.58203
16,280 (2.10%)
16.58301
10,190 (1.31%)
17.58854
9,173 (1.18%)
18.58075
8,955 (1.15%)
19.58072
7,928 (1.02%)
20.58316
5,920 (0.76%)
21.58237
5,156 (0.66%)
22.58704
4,658 (0.60%)
23.58047
4,427 (0.57%)
24.58763
3,982 (0.51%)
25.58318
3,874 (0.50%)
26.58368
3,408 (0.44%)
27.58523
3,272 (0.42%)
28.58545
3,247 (0.42%)
29.58054
3,183 (0.41%)
30.58540
3,154 (0.41%)
Largest Cities by Population in North Dakota
The largest cities in North Dakota by population are Fargo (127,319), Bismarck (73,694), Grand Forks (58,935), Minot (48,038), and West Fargo (38,653).
1.Fargo
127,319 (16.39%)
2.Bismarck
73,694 (9.49%)
58,935 (7.59%)
4.Minot
48,038 (6.18%)
38,653 (4.98%)
27,783 (3.58%)
25,116 (3.23%)
8.Mandan
24,049 (3.10%)
15,850 (2.04%)
10.Wahpeton
7,983 (1.03%)
11.Devils Lake
7,192 (0.93%)
12.Valley City
6,558 (0.84%)
13.Watford City
5,900 (0.76%)
14.Minot AFB
4,943 (0.64%)
15.Lincoln
4,209 (0.54%)
16.Grafton
4,161 (0.54%)
17.Horace
3,464 (0.45%)
18.Beulah
3,063 (0.39%)
19.New Town
2,714 (0.35%)
20.Rugby
2,654 (0.34%)
21.Hazen
2,569 (0.33%)
22.Casselton
2,496 (0.32%)
23.Stanley
2,189 (0.28%)
24.Carrington
2,161 (0.28%)
25.Lisbon
2,159 (0.28%)
26.Oakes
2,125 (0.27%)
2,113 (0.27%)
28.Bottineau
2,104 (0.27%)
29.Mayville
2,102 (0.27%)
30.Belcourt
1,772 (0.23%)
Largest Counties by Population in North Dakota
The largest counties in North Dakota by population are Cass County (186,328), Burleigh County (98,443), Grand Forks County (72,927), Ward County (69,532), and Williams County (39,076).
186,328 (23.98%)
98,443 (12.67%)
72,927 (9.39%)
69,532 (8.95%)
39,076 (5.03%)
33,192 (4.27%)
32,989 (4.25%)
21,609 (2.78%)
16,548 (2.13%)
14,081 (1.81%)
12,292 (1.58%)
11,613 (1.49%)
10,826 (1.39%)
14.Walsh County
10,553 (1.36%)
9,781 (1.26%)
9,648 (1.24%)
8,366 (1.08%)
8,004 (1.03%)
6,853 (0.88%)
6,411 (0.83%)
5,960 (0.77%)
5,663 (0.73%)
5,326 (0.69%)
5,003 (0.64%)
4,135 (0.53%)
26.Dunn County
4,049 (0.52%)
3,999 (0.51%)
28.Wells County
3,990 (0.51%)
29.Sioux County
3,896 (0.50%)
3,828 (0.49%)
Race in North Dakota
The most populous races in North Dakota are White / Caucasian (656,425 | 84.5%), Native / Alaskan (36,284 | 4.7%), and Two or more Races (34,294 | 4.4%).
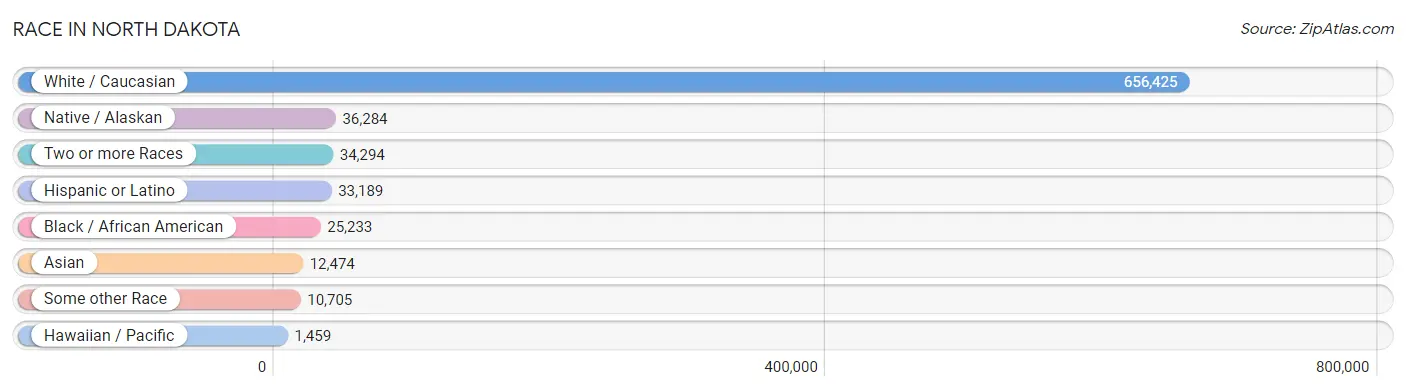
| Race | # Population | % Population |
| Asian | 12,474 | 1.6% |
| Black / African American | 25,233 | 3.3% |
| Hawaiian / Pacific | 1,459 | 0.2% |
| Hispanic or Latino | 33,189 | 4.3% |
| Native / Alaskan | 36,284 | 4.7% |
| White / Caucasian | 656,425 | 84.5% |
| Two or more Races | 34,294 | 4.4% |
| Some other Race | 10,705 | 1.4% |
| Total | 776,874 | 100.0% |
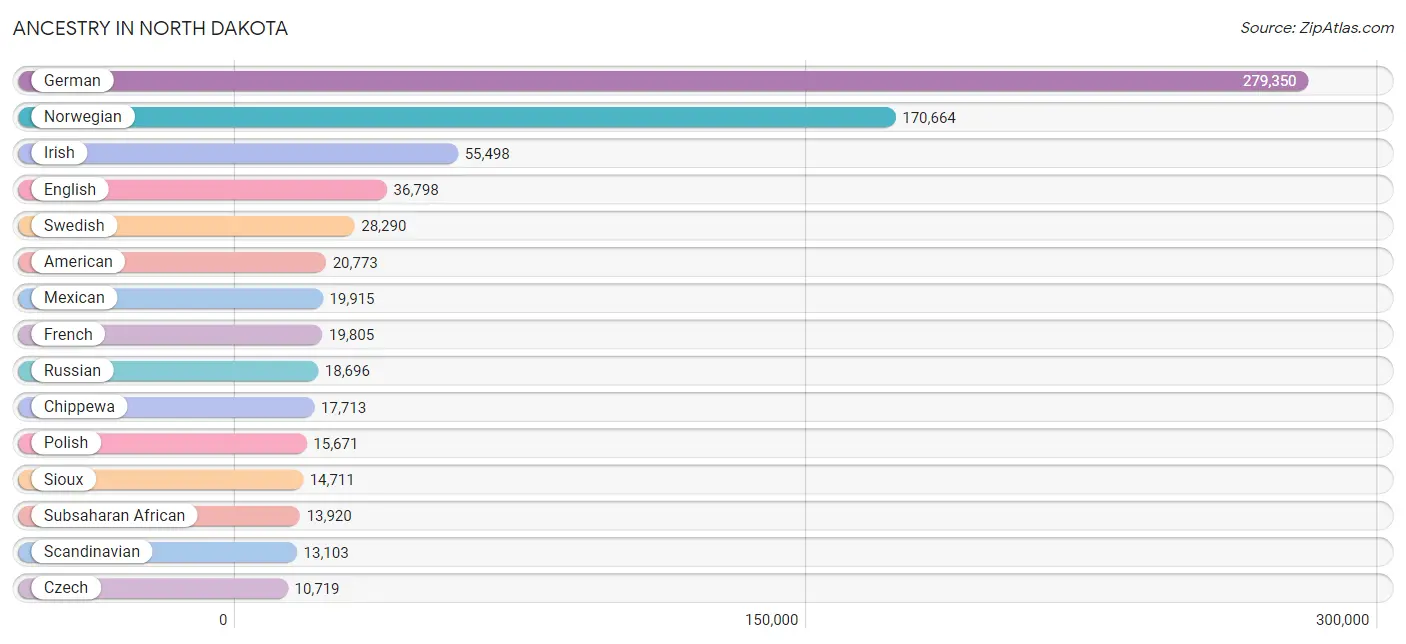
Ancestry in North Dakota
The most populous ancestries reported in North Dakota are German (279,350 | 36.0%), Norwegian (170,664 | 22.0%), Irish (55,498 | 7.1%), English (36,798 | 4.7%), and Swedish (28,290 | 3.6%), together accounting for 73.4% of all North Dakota residents.
| Ancestry | # Population | % Population |
| Afghan | 441 | 0.1% |
| African | 3,891 | 0.5% |
| Alaska Native | 54 | 0.0% |
| Alaskan Athabascan | 4 | 0.0% |
| Albanian | 191 | 0.0% |
| Aleut | 13 | 0.0% |
| American | 20,773 | 2.7% |
| Apache | 138 | 0.0% |
| Arab | 3,064 | 0.4% |
| Arapaho | 5 | 0.0% |
| Argentinean | 60 | 0.0% |
| Armenian | 76 | 0.0% |
| Assyrian / Chaldean / Syriac | 14 | 0.0% |
| Australian | 127 | 0.0% |
| Austrian | 1,041 | 0.1% |
| Bahamian | 26 | 0.0% |
| Bangladeshi | 42 | 0.0% |
| Barbadian | 11 | 0.0% |
| Basque | 105 | 0.0% |
| Belgian | 703 | 0.1% |
| Belizean | 4 | 0.0% |
| Bermudan | 6 | 0.0% |
| Bhutanese | 1,434 | 0.2% |
| Blackfeet | 299 | 0.0% |
| Brazilian | 169 | 0.0% |
| British | 2,425 | 0.3% |
| British West Indian | 66 | 0.0% |
| Bulgarian | 160 | 0.0% |
| Burmese | 2,324 | 0.3% |
| Cambodian | 80 | 0.0% |
| Canadian | 797 | 0.1% |
| Cape Verdean | 18 | 0.0% |
| Celtic | 82 | 0.0% |
| Central American | 2,210 | 0.3% |
| Central American Indian | 242 | 0.0% |
| Cherokee | 832 | 0.1% |
| Cheyenne | 143 | 0.0% |
| Chickasaw | 33 | 0.0% |
| Chilean | 275 | 0.0% |
| Chinese | 6 | 0.0% |
| Chippewa | 17,713 | 2.3% |
| Choctaw | 157 | 0.0% |
| Colombian | 840 | 0.1% |
| Colville | 6 | 0.0% |
| Comanche | 118 | 0.0% |
| Costa Rican | 22 | 0.0% |
| Cree | 162 | 0.0% |
| Creek | 142 | 0.0% |
| Croatian | 429 | 0.1% |
| Crow | 225 | 0.0% |
| Cuban | 353 | 0.1% |
| Czech | 10,719 | 1.4% |
| Czechoslovakian | 1,095 | 0.1% |
| Danish | 6,890 | 0.9% |
| Delaware | 18 | 0.0% |
| Dominican | 356 | 0.1% |
| Dutch | 8,046 | 1.0% |
| Eastern European | 862 | 0.1% |
| Ecuadorian | 161 | 0.0% |
| Egyptian | 235 | 0.0% |
| English | 36,798 | 4.7% |
| Estonian | 21 | 0.0% |
| Ethiopian | 100 | 0.0% |
| European | 6,988 | 0.9% |
| Fijian | 275 | 0.0% |
| Filipino | 88 | 0.0% |
| Finnish | 4,372 | 0.6% |
| French | 19,805 | 2.5% |
| French American Indian | 383 | 0.1% |
| French Canadian | 5,691 | 0.7% |
| German | 279,350 | 36.0% |
| German Russian | 2,958 | 0.4% |
| Ghanaian | 223 | 0.0% |
| Greek | 684 | 0.1% |
| Guamanian / Chamorro | 178 | 0.0% |
| Guatemalan | 257 | 0.0% |
| Haitian | 546 | 0.1% |
| Honduran | 176 | 0.0% |
| Hopi | 22 | 0.0% |
| Houma | 199 | 0.0% |
| Hungarian | 1,901 | 0.2% |
| Icelander | 2,958 | 0.4% |
| Indian (Asian) | 2,190 | 0.3% |
| Inupiat | 135 | 0.0% |
| Iranian | 263 | 0.0% |
| Iraqi | 119 | 0.0% |
| Irish | 55,498 | 7.1% |
| Iroquois | 160 | 0.0% |
| Israeli | 5 | 0.0% |
| Italian | 9,305 | 1.2% |
| Jamaican | 627 | 0.1% |
| Japanese | 196 | 0.0% |
| Jordanian | 20 | 0.0% |
| Kenyan | 847 | 0.1% |
| Kiowa | 6 | 0.0% |
| Korean | 4,412 | 0.6% |
| Laotian | 126 | 0.0% |
| Latvian | 48 | 0.0% |
| Lebanese | 817 | 0.1% |
| Liberian | 3,156 | 0.4% |
| Lithuanian | 263 | 0.0% |
| Lumbee | 18 | 0.0% |
| Luxembourger | 447 | 0.1% |
| Macedonian | 2 | 0.0% |
| Malaysian | 80 | 0.0% |
| Menominee | 16 | 0.0% |
| Mexican | 19,915 | 2.6% |
| Mexican American Indian | 208 | 0.0% |
| Mongolian | 33 | 0.0% |
| Moroccan | 21 | 0.0% |
| Native Hawaiian | 749 | 0.1% |
| Navajo | 629 | 0.1% |
| New Zealander | 8 | 0.0% |
| Nicaraguan | 245 | 0.0% |
| Nigerian | 1,322 | 0.2% |
| Northern European | 1,053 | 0.1% |
| Norwegian | 170,664 | 22.0% |
| Ottawa | 2 | 0.0% |
| Paiute | 6 | 0.0% |
| Pakistani | 395 | 0.1% |
| Palestinian | 147 | 0.0% |
| Panamanian | 558 | 0.1% |
| Pennsylvania German | 247 | 0.0% |
| Peruvian | 268 | 0.0% |
| Polish | 15,671 | 2.0% |
| Portuguese | 467 | 0.1% |
| Potawatomi | 61 | 0.0% |
| Pueblo | 37 | 0.0% |
| Puerto Rican | 4,439 | 0.6% |
| Puget Sound Salish | 11 | 0.0% |
| Romanian | 817 | 0.1% |
| Russian | 18,696 | 2.4% |
| Salvadoran | 858 | 0.1% |
| Samoan | 212 | 0.0% |
| Scandinavian | 13,103 | 1.7% |
| Scotch-Irish | 4,276 | 0.5% |
| Scottish | 8,711 | 1.1% |
| Seminole | 29 | 0.0% |
| Senegalese | 136 | 0.0% |
| Serbian | 141 | 0.0% |
| Shoshone | 139 | 0.0% |
| Sierra Leonean | 4 | 0.0% |
| Sioux | 14,711 | 1.9% |
| Slavic | 66 | 0.0% |
| Slovak | 475 | 0.1% |
| Slovene | 325 | 0.0% |
| Somali | 1,906 | 0.3% |
| South African | 467 | 0.1% |
| South American | 1,639 | 0.2% |
| South American Indian | 93 | 0.0% |
| Spaniard | 1,494 | 0.2% |
| Spanish | 655 | 0.1% |
| Spanish American | 25 | 0.0% |
| Sri Lankan | 997 | 0.1% |
| Subsaharan African | 13,920 | 1.8% |
| Sudanese | 152 | 0.0% |
| Swedish | 28,290 | 3.6% |
| Swiss | 2,090 | 0.3% |
| Syrian | 466 | 0.1% |
| Thai | 2,187 | 0.3% |
| Tlingit-Haida | 51 | 0.0% |
| Tongan | 31 | 0.0% |
| Trinidadian and Tobagonian | 8 | 0.0% |
| Tsimshian | 43 | 0.0% |
| Turkish | 131 | 0.0% |
| Ukrainian | 4,059 | 0.5% |
| Ute | 1 | 0.0% |
| Venezuelan | 11 | 0.0% |
| Vietnamese | 303 | 0.0% |
| Welsh | 2,391 | 0.3% |
| West Indian | 36 | 0.0% |
| Yaqui | 3 | 0.0% |
| Yugoslavian | 745 | 0.1% |
| Yuman | 4 | 0.0% |
| Yup'ik | 29 | 0.0% |
| Zimbabwean | 117 | 0.0% | View All 176 Rows |
Immigrants in North Dakota
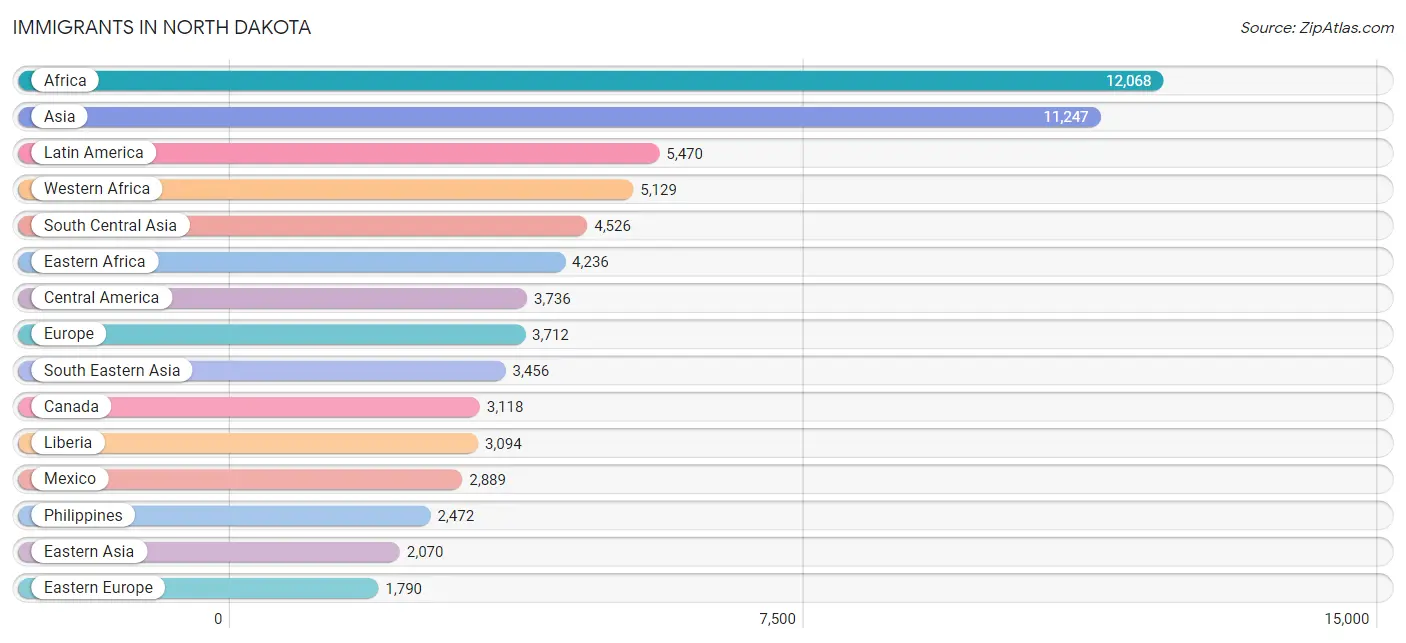
The most numerous immigrant groups reported in North Dakota came from Africa (12,068 | 1.5%), Asia (11,247 | 1.5%), Latin America (5,470 | 0.7%), Western Africa (5,129 | 0.7%), and South Central Asia (4,526 | 0.6%), together accounting for 4.9% of all North Dakota residents.
| Immigration Origin | # Population | % Population |
| Afghanistan | 325 | 0.0% |
| Africa | 12,068 | 1.5% |
| Argentina | 17 | 0.0% |
| Asia | 11,247 | 1.5% |
| Australia | 117 | 0.0% |
| Austria | 51 | 0.0% |
| Bangladesh | 259 | 0.0% |
| Barbados | 11 | 0.0% |
| Belarus | 12 | 0.0% |
| Belgium | 10 | 0.0% |
| Belize | 49 | 0.0% |
| Bolivia | 1 | 0.0% |
| Bosnia and Herzegovina | 445 | 0.1% |
| Brazil | 217 | 0.0% |
| Bulgaria | 158 | 0.0% |
| Cameroon | 240 | 0.0% |
| Canada | 3,118 | 0.4% |
| Caribbean | 860 | 0.1% |
| Central America | 3,736 | 0.5% |
| Chile | 88 | 0.0% |
| China | 865 | 0.1% |
| Colombia | 234 | 0.0% |
| Congo | 172 | 0.0% |
| Costa Rica | 8 | 0.0% |
| Croatia | 136 | 0.0% |
| Cuba | 60 | 0.0% |
| Czechoslovakia | 19 | 0.0% |
| Denmark | 70 | 0.0% |
| Dominican Republic | 164 | 0.0% |
| Eastern Africa | 4,236 | 0.5% |
| Eastern Asia | 2,070 | 0.3% |
| Eastern Europe | 1,790 | 0.2% |
| Ecuador | 54 | 0.0% |
| Egypt | 206 | 0.0% |
| El Salvador | 118 | 0.0% |
| England | 217 | 0.0% |
| Eritrea | 74 | 0.0% |
| Ethiopia | 115 | 0.0% |
| Europe | 3,712 | 0.5% |
| France | 239 | 0.0% |
| Germany | 740 | 0.1% |
| Ghana | 351 | 0.1% |
| Greece | 51 | 0.0% |
| Grenada | 12 | 0.0% |
| Guatemala | 158 | 0.0% |
| Haiti | 235 | 0.0% |
| Honduras | 112 | 0.0% |
| Hungary | 3 | 0.0% |
| India | 1,374 | 0.2% |
| Indonesia | 66 | 0.0% |
| Iran | 267 | 0.0% |
| Iraq | 351 | 0.1% |
| Ireland | 8 | 0.0% |
| Israel | 24 | 0.0% |
| Italy | 31 | 0.0% |
| Jamaica | 376 | 0.1% |
| Japan | 464 | 0.1% |
| Jordan | 49 | 0.0% |
| Kazakhstan | 8 | 0.0% |
| Kenya | 1,546 | 0.2% |
| Korea | 720 | 0.1% |
| Laos | 53 | 0.0% |
| Latin America | 5,470 | 0.7% |
| Latvia | 7 | 0.0% |
| Lebanon | 38 | 0.0% |
| Liberia | 3,094 | 0.4% |
| Lithuania | 59 | 0.0% |
| Malaysia | 52 | 0.0% |
| Mexico | 2,889 | 0.4% |
| Middle Africa | 1,007 | 0.1% |
| Moldova | 111 | 0.0% |
| Morocco | 15 | 0.0% |
| Nepal | 1,073 | 0.1% |
| Netherlands | 42 | 0.0% |
| Nicaragua | 67 | 0.0% |
| Nigeria | 1,068 | 0.1% |
| Northern Africa | 696 | 0.1% |
| Northern Europe | 589 | 0.1% |
| Norway | 47 | 0.0% |
| Oceania | 408 | 0.1% |
| Pakistan | 353 | 0.1% |
| Panama | 241 | 0.0% |
| Peru | 245 | 0.0% |
| Philippines | 2,472 | 0.3% |
| Poland | 67 | 0.0% |
| Romania | 193 | 0.0% |
| Russia | 282 | 0.0% |
| Saudi Arabia | 122 | 0.0% |
| Scotland | 48 | 0.0% |
| Senegal | 68 | 0.0% |
| Serbia | 93 | 0.0% |
| Sierra Leone | 53 | 0.0% |
| Somalia | 1,514 | 0.2% |
| South Africa | 525 | 0.1% |
| South America | 874 | 0.1% |
| South Central Asia | 4,526 | 0.6% |
| South Eastern Asia | 3,456 | 0.4% |
| Southern Europe | 227 | 0.0% |
| Spain | 145 | 0.0% |
| Sri Lanka | 84 | 0.0% |
| Sudan | 431 | 0.1% |
| Sweden | 4 | 0.0% |
| Syria | 225 | 0.0% |
| Taiwan | 87 | 0.0% |
| Thailand | 271 | 0.0% |
| Trinidad and Tobago | 2 | 0.0% |
| Turkey | 112 | 0.0% |
| Uganda | 85 | 0.0% |
| Ukraine | 106 | 0.0% |
| Uzbekistan | 9 | 0.0% |
| Venezuela | 5 | 0.0% |
| Vietnam | 542 | 0.1% |
| Western Africa | 5,129 | 0.7% |
| Western Asia | 1,107 | 0.1% |
| Western Europe | 1,082 | 0.1% |
| Yemen | 65 | 0.0% |
| Zaire | 595 | 0.1% |
| Zimbabwe | 144 | 0.0% | View All 118 Rows |
Sex and Age in North Dakota
Sex and Age in North Dakota
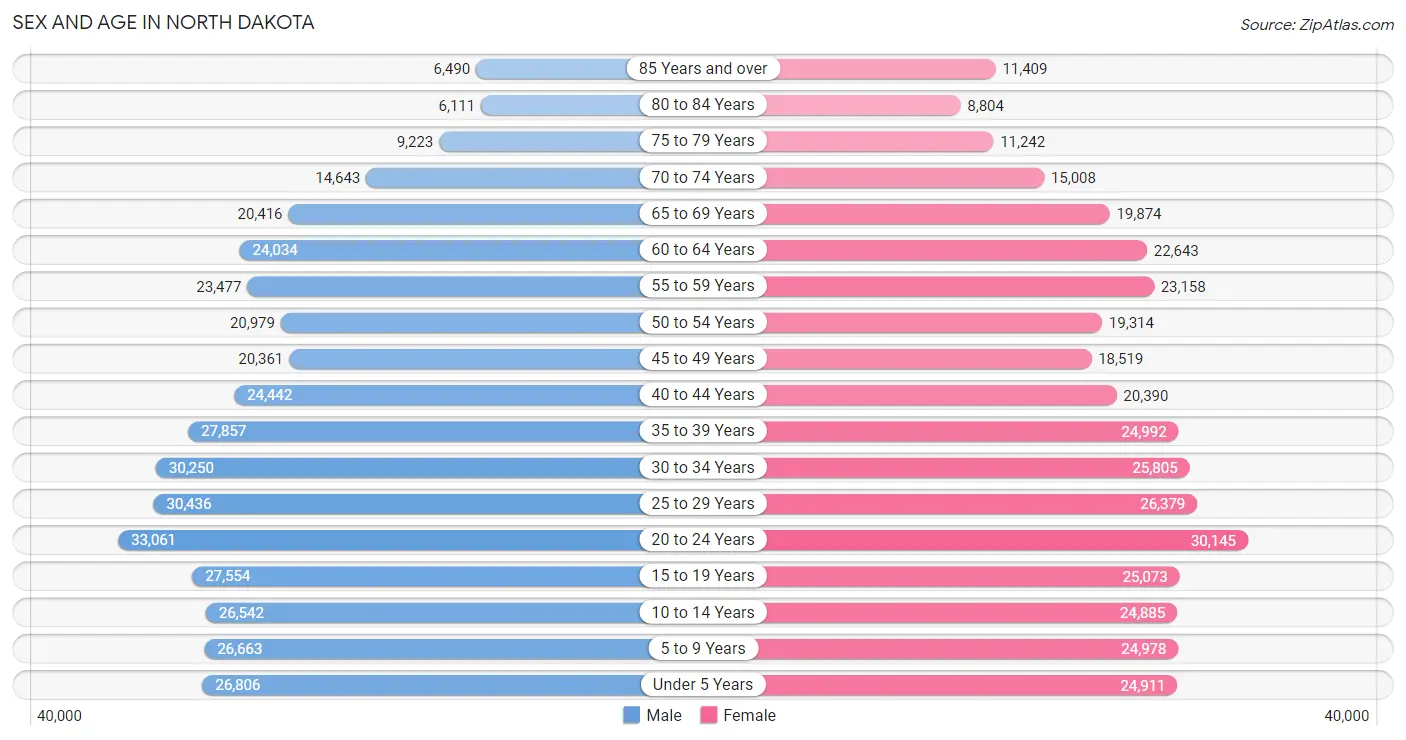
The most populous age groups in North Dakota are 20 to 24 Years (33,061 | 8.3%) for men and 20 to 24 Years (30,145 | 8.0%) for women.
| Age Bracket | Male | Female |
| Under 5 Years | 26,806 (6.7%) | 24,911 (6.6%) |
| 5 to 9 Years | 26,663 (6.7%) | 24,978 (6.6%) |
| 10 to 14 Years | 26,542 (6.7%) | 24,885 (6.6%) |
| 15 to 19 Years | 27,554 (6.9%) | 25,073 (6.6%) |
| 20 to 24 Years | 33,061 (8.3%) | 30,145 (8.0%) |
| 25 to 29 Years | 30,436 (7.6%) | 26,379 (7.0%) |
| 30 to 34 Years | 30,250 (7.6%) | 25,805 (6.8%) |
| 35 to 39 Years | 27,857 (7.0%) | 24,992 (6.6%) |
| 40 to 44 Years | 24,442 (6.1%) | 20,390 (5.4%) |
| 45 to 49 Years | 20,361 (5.1%) | 18,519 (4.9%) |
| 50 to 54 Years | 20,979 (5.2%) | 19,314 (5.1%) |
| 55 to 59 Years | 23,477 (5.9%) | 23,158 (6.1%) |
| 60 to 64 Years | 24,034 (6.0%) | 22,643 (6.0%) |
| 65 to 69 Years | 20,416 (5.1%) | 19,874 (5.3%) |
| 70 to 74 Years | 14,643 (3.7%) | 15,008 (4.0%) |
| 75 to 79 Years | 9,223 (2.3%) | 11,242 (3.0%) |
| 80 to 84 Years | 6,111 (1.5%) | 8,804 (2.3%) |
| 85 Years and over | 6,490 (1.6%) | 11,409 (3.0%) |
| Total | 399,345 (100.0%) | 377,529 (100.0%) |
Families and Households in North Dakota
Median Family Size in North Dakota
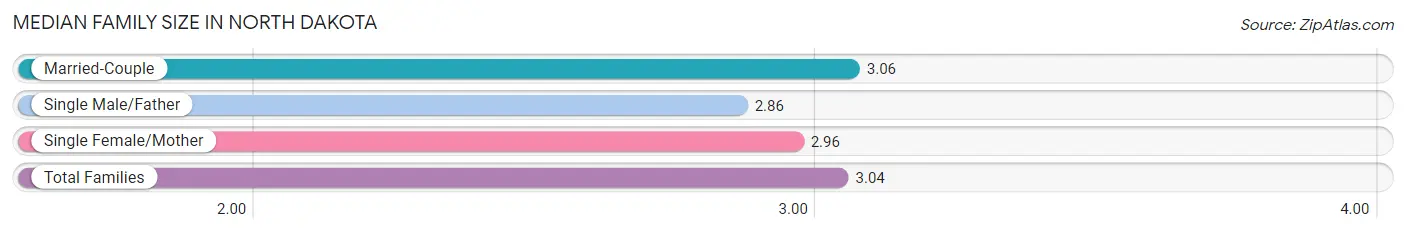
The median family size in North Dakota is 3.04 persons per family, with married-couple families (151,567 | 80.5%) accounting for the largest median family size of 3.06 persons per family. On the other hand, single male/father families (12,714 | 6.8%) represent the smallest median family size with 2.86 persons per family.
| Family Type | # Families | Family Size |
| Married-Couple | 151,567 (80.5%) | 3.06 |
| Single Male/Father | 12,714 (6.8%) | 2.86 |
| Single Female/Mother | 24,036 (12.8%) | 2.96 |
| Total Families | 188,317 (100.0%) | 3.04 |
Median Household Size in North Dakota
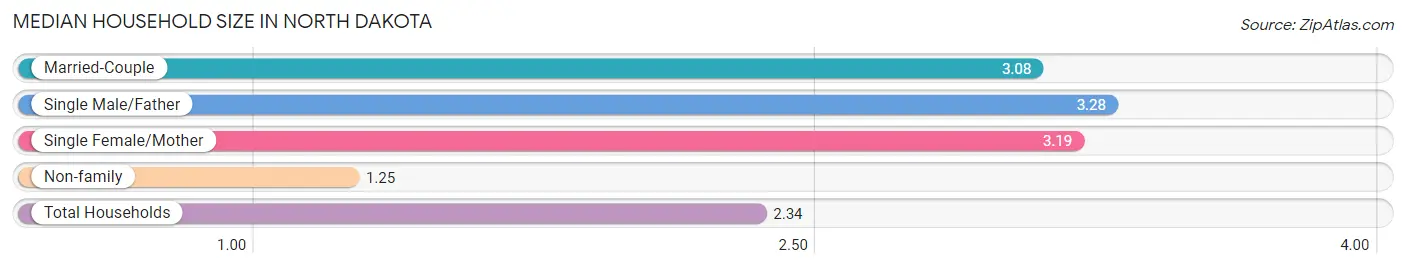
The median household size in North Dakota is 2.34 persons per household, with single male/father households (12,714 | 4.0%) accounting for the largest median household size of 3.28 persons per household. non-family households (131,721 | 41.2%) represent the smallest median household size with 1.25 persons per household.
| Household Type | # Households | Household Size |
| Married-Couple | 151,567 (47.4%) | 3.08 |
| Single Male/Father | 12,714 (4.0%) | 3.28 |
| Single Female/Mother | 24,036 (7.5%) | 3.19 |
| Non-family | 131,721 (41.2%) | 1.25 |
| Total Households | 320,038 (100.0%) | 2.34 |
Household Size by Marriage Status in North Dakota
Out of a total of 320,038 households in North Dakota, 188,317 (58.8%) are family households, while 131,721 (41.2%) are nonfamily households. The most numerous type of family households are 2-person households, comprising 92,755, and the most common type of nonfamily households are 1-person households, comprising 106,352.
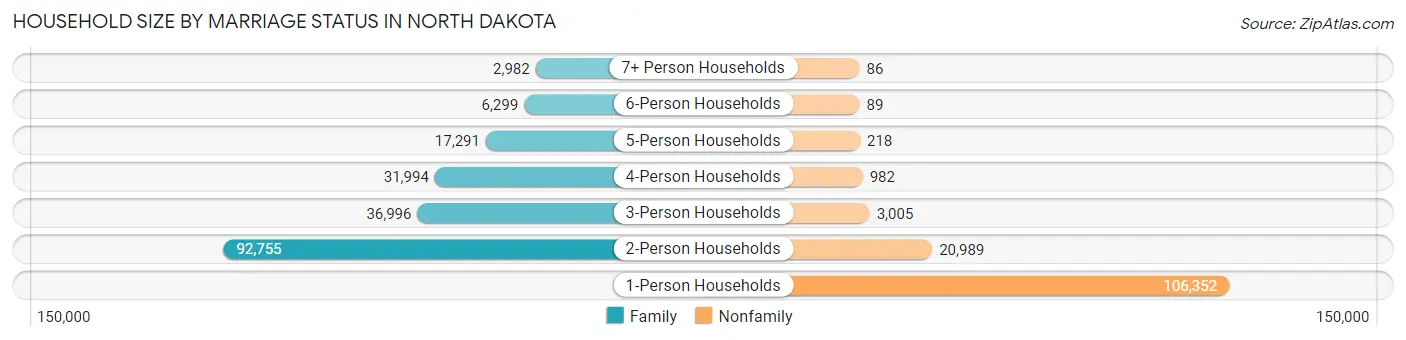
| Household Size | Family Households | Nonfamily Households |
| 1-Person Households | - | 106,352 (33.2%) |
| 2-Person Households | 92,755 (29.0%) | 20,989 (6.6%) |
| 3-Person Households | 36,996 (11.6%) | 3,005 (0.9%) |
| 4-Person Households | 31,994 (10.0%) | 982 (0.3%) |
| 5-Person Households | 17,291 (5.4%) | 218 (0.1%) |
| 6-Person Households | 6,299 (2.0%) | 89 (0.0%) |
| 7+ Person Households | 2,982 (0.9%) | 86 (0.0%) |
| Total | 188,317 (58.8%) | 131,721 (41.2%) |
Female Fertility in North Dakota
Fertility by Age in North Dakota
Average fertility rate in North Dakota is 65.0 births per 1,000 women. Women in the age bracket of 20 to 34 years have the highest fertility rate with 110.0 births per 1,000 women. Women in the age bracket of 20 to 34 years acount for 79.2% of all women with births.
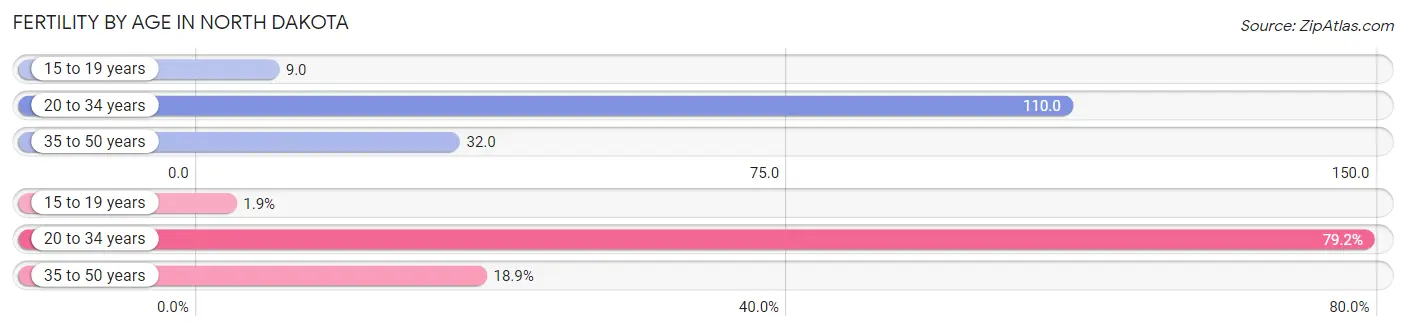
| Age Bracket | Women with Births | Births / 1,000 Women |
| 15 to 19 years | 219 (1.9%) | 9.0 |
| 20 to 34 years | 9,049 (79.2%) | 110.0 |
| 35 to 50 years | 2,160 (18.9%) | 32.0 |
| Total | 11,428 (100.0%) | 65.0 |
Fertility by Age by Marriage Status in North Dakota
75.9% of women with births (11,428) in North Dakota are married. The highest percentage of unmarried women with births falls into 15 to 19 years age bracket with 100.0% of them unmarried at the time of birth, while the lowest percentage of unmarried women with births belong to 35 to 50 years age bracket with 18.6% of them unmarried.
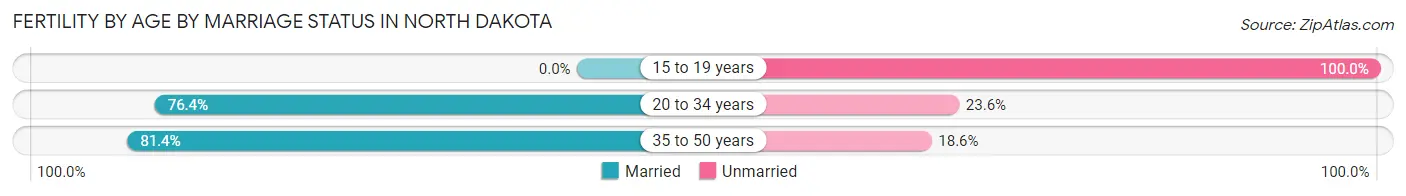
| Age Bracket | Married | Unmarried |
| 15 to 19 years | 0 (0.0%) | 219 (100.0%) |
| 20 to 34 years | 6,913 (76.4%) | 2,136 (23.6%) |
| 35 to 50 years | 1,758 (81.4%) | 402 (18.6%) |
| Total | 8,674 (75.9%) | 2,754 (24.1%) |
Fertility by Education in North Dakota
Average fertility rate in North Dakota is 65.0 births per 1,000 women. Women with the education attainment of high school diploma have the highest fertility rate of 77.0 births per 1,000 women, while women with the education attainment of less than high school have the lowest fertility at 40.0 births per 1,000 women. Women with the education attainment of college or associate's degree represent 33.4% of all women with births.
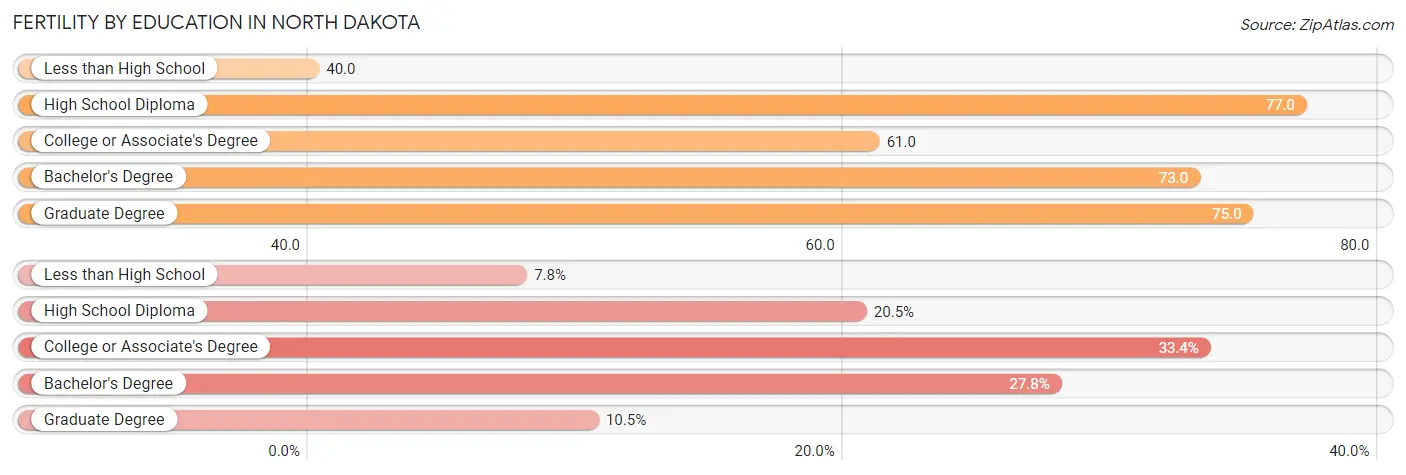
| Educational Attainment | Women with Births | Births / 1,000 Women |
| Less than High School | 890 (7.8%) | 40.0 |
| High School Diploma | 2,345 (20.5%) | 77.0 |
| College or Associate's Degree | 3,817 (33.4%) | 61.0 |
| Bachelor's Degree | 3,178 (27.8%) | 73.0 |
| Graduate Degree | 1,198 (10.5%) | 75.0 |
| Total | 11,428 (100.0%) | 65.0 |
Fertility by Education by Marriage Status in North Dakota
24.1% of women with births in North Dakota are unmarried. Women with the educational attainment of bachelor's degree are most likely to be married with 93.9% of them married at childbirth, while women with the educational attainment of high school diploma are least likely to be married with 49.8% of them unmarried at childbirth.
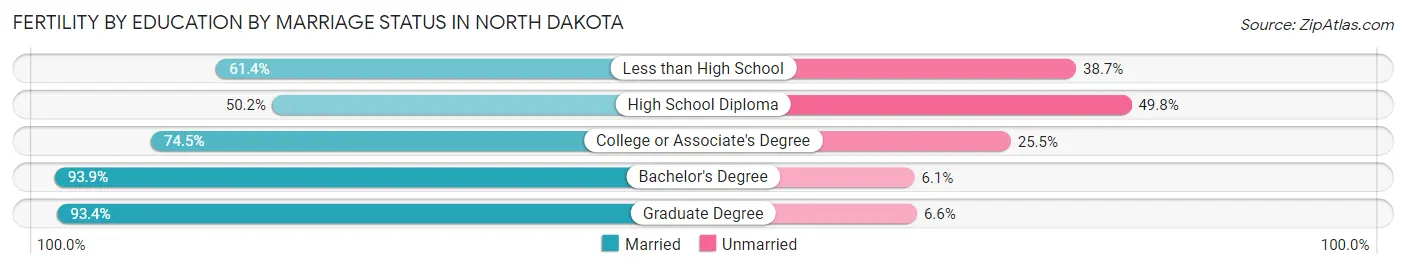
| Educational Attainment | Married | Unmarried |
| Less than High School | 546 (61.4%) | 344 (38.7%) |
| High School Diploma | 1,177 (50.2%) | 1,168 (49.8%) |
| College or Associate's Degree | 2,844 (74.5%) | 973 (25.5%) |
| Bachelor's Degree | 2,984 (93.9%) | 194 (6.1%) |
| Graduate Degree | 1,119 (93.4%) | 79 (6.6%) |
| Total | 8,674 (75.9%) | 2,754 (24.1%) |
Employment Characteristics in North Dakota
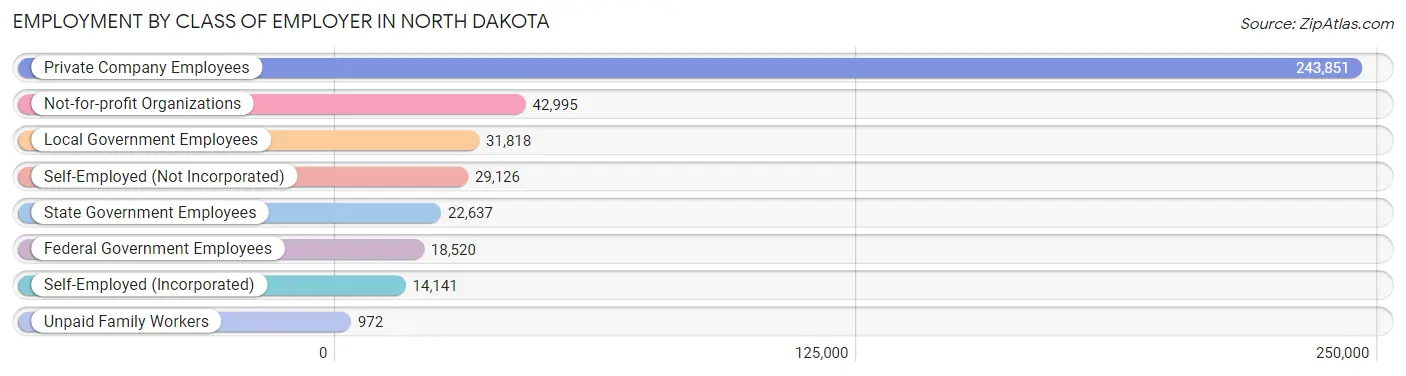
Employment by Class of Employer in North Dakota
Among the 404,060 employed individuals in North Dakota, private company employees (243,851 | 60.4%), not-for-profit organizations (42,995 | 10.6%), and local government employees (31,818 | 7.9%) make up the most common classes of employment.
| Employer Class | # Employees | % Employees |
| Private Company Employees | 243,851 | 60.4% |
| Self-Employed (Incorporated) | 14,141 | 3.5% |
| Self-Employed (Not Incorporated) | 29,126 | 7.2% |
| Not-for-profit Organizations | 42,995 | 10.6% |
| Local Government Employees | 31,818 | 7.9% |
| State Government Employees | 22,637 | 5.6% |
| Federal Government Employees | 18,520 | 4.6% |
| Unpaid Family Workers | 972 | 0.2% |
| Total | 404,060 | 100.0% |
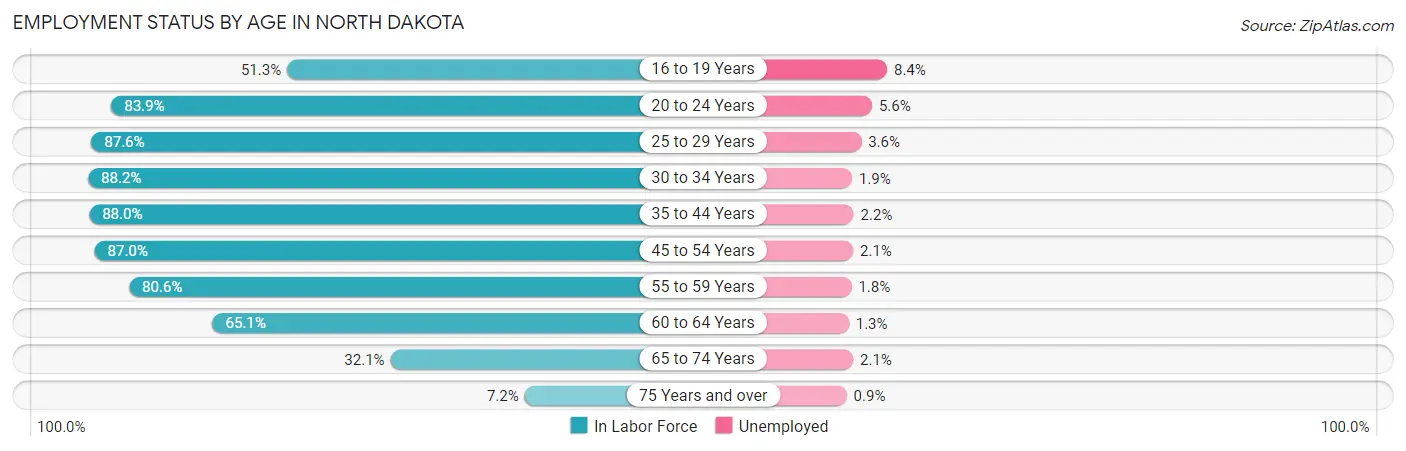
Employment Status by Age in North Dakota
According to the labor force statistics for North Dakota, out of the total population over 16 years of age (612,919), 69.1% or 423,527 individuals are in the labor force, with 2.9% or 12,282 of them unemployed. The age group with the highest labor force participation rate is 30 to 34 years, with 88.2% or 49,441 individuals in the labor force. Within the labor force, the 16 to 19 years age range has the highest percentage of unemployed individuals, with 8.4% or 1,873 of them being unemployed.
| Age Bracket | In Labor Force | Unemployed |
| 16 to 19 Years | 22,293 (51.3%) | 1,873 (8.4%) |
| 20 to 24 Years | 53,030 (83.9%) | 2,970 (5.6%) |
| 25 to 29 Years | 49,770 (87.6%) | 1,792 (3.6%) |
| 30 to 34 Years | 49,441 (88.2%) | 939 (1.9%) |
| 35 to 44 Years | 85,959 (88.0%) | 1,891 (2.2%) |
| 45 to 54 Years | 68,881 (87.0%) | 1,447 (2.1%) |
| 55 to 59 Years | 37,588 (80.6%) | 677 (1.8%) |
| 60 to 64 Years | 30,387 (65.1%) | 395 (1.3%) |
| 65 to 74 Years | 22,451 (32.1%) | 471 (2.1%) |
| 75 Years and over | 3,836 (7.2%) | 35 (0.9%) |
| Total | 423,527 (69.1%) | 12,282 (2.9%) |
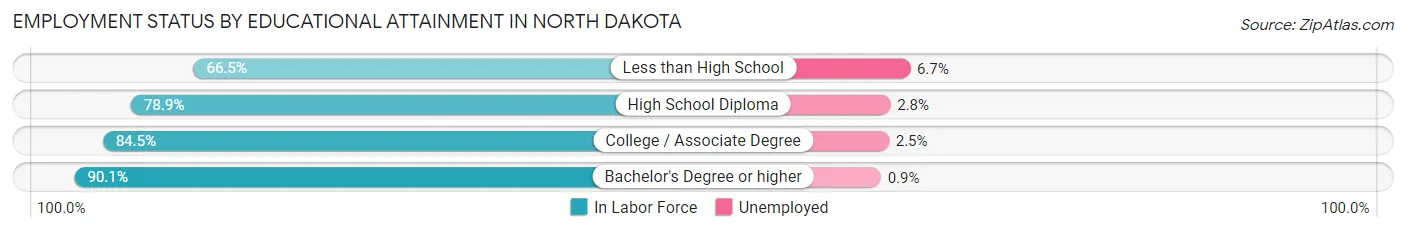
Employment Status by Educational Attainment in North Dakota
According to labor force statistics for North Dakota, 84.1% of individuals (322,133) out of the total population between 25 and 64 years of age (383,036) are in the labor force, with 2.2% or 7,087 of them being unemployed. The group with the highest labor force participation rate are those with the educational attainment of bachelor's degree or higher, with 90.1% or 116,171 individuals in the labor force. Within the labor force, individuals with less than high school education have the highest percentage of unemployment, with 6.7% or 922 of them being unemployed.
| Educational Attainment | In Labor Force | Unemployed |
| Less than High School | 13,759 (66.5%) | 1,386 (6.7%) |
| High School Diploma | 72,336 (78.9%) | 2,567 (2.8%) |
| College / Associate Degree | 119,761 (84.5%) | 3,543 (2.5%) |
| Bachelor's Degree or higher | 116,171 (90.1%) | 1,160 (0.9%) |
| Total | 322,133 (84.1%) | 8,427 (2.2%) |
Employment Occupations by Sex in North Dakota
Management, Business, Science and Arts Occupations
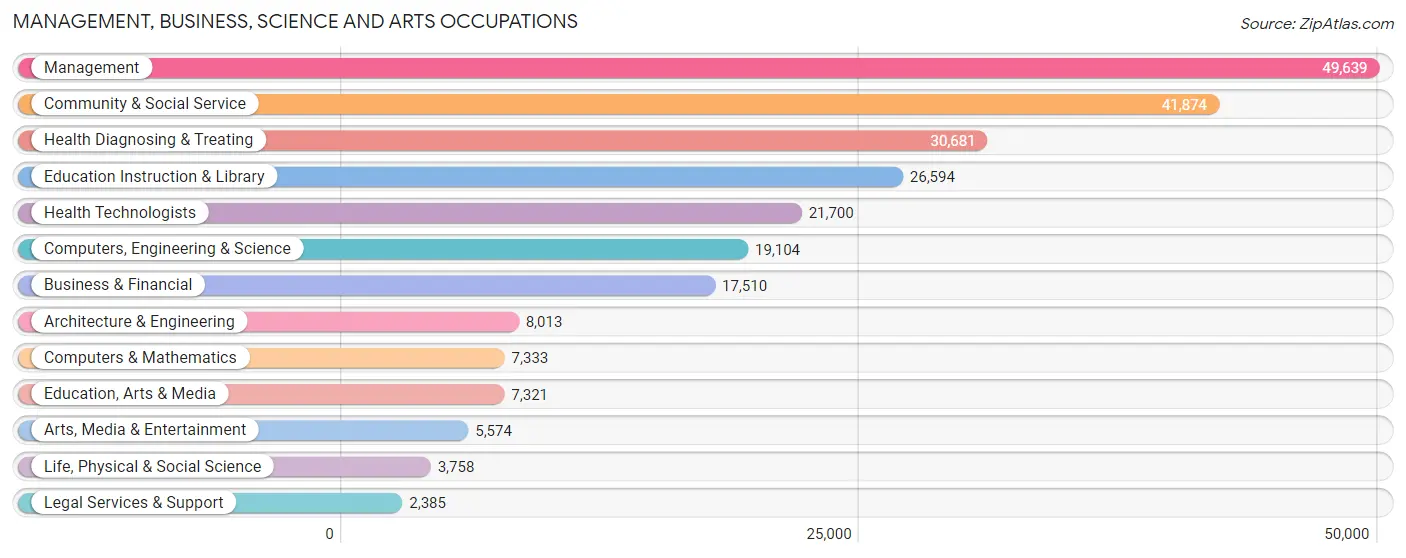
The most common Management, Business, Science and Arts occupations in North Dakota are Management (49,639 | 12.3%), Community & Social Service (41,874 | 10.3%), Health Diagnosing & Treating (30,681 | 7.6%), Education Instruction & Library (26,594 | 6.6%), and Health Technologists (21,700 | 5.4%).
Management, Business, Science and Arts Occupations by Sex
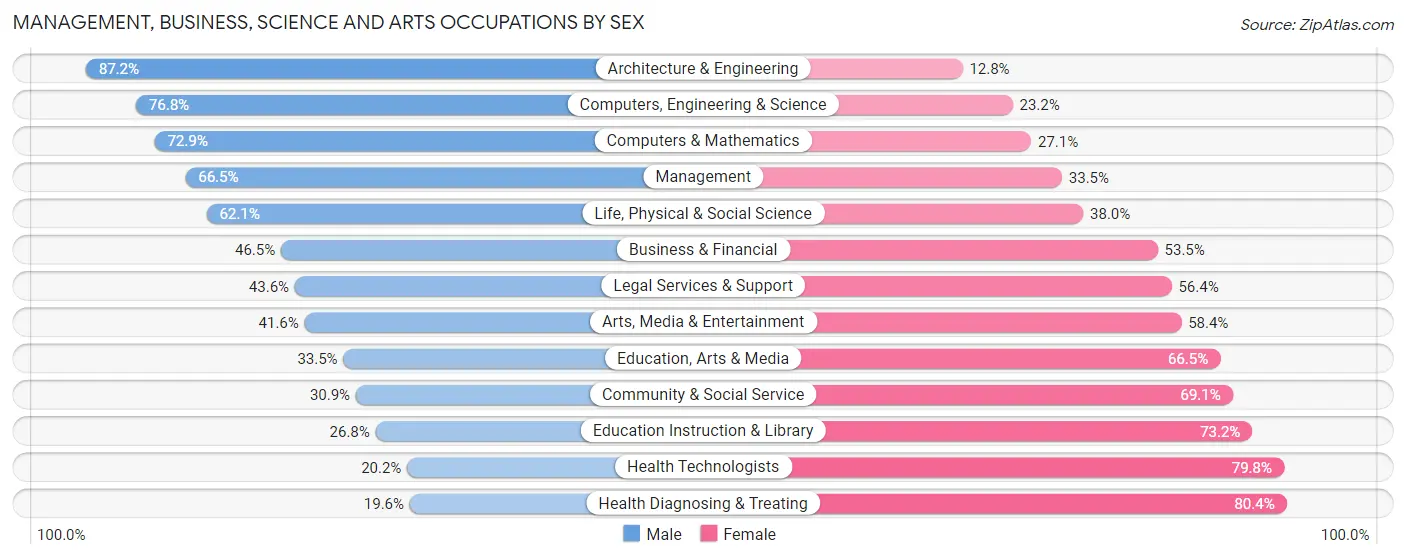
Within the Management, Business, Science and Arts occupations in North Dakota, the most male-oriented occupations are Architecture & Engineering (87.2%), Computers, Engineering & Science (76.8%), and Computers & Mathematics (72.9%), while the most female-oriented occupations are Health Diagnosing & Treating (80.4%), Health Technologists (79.8%), and Education Instruction & Library (73.2%).
| Occupation | Male | Female |
| Management | 33,001 (66.5%) | 16,638 (33.5%) |
| Business & Financial | 8,144 (46.5%) | 9,366 (53.5%) |
| Computers, Engineering & Science | 14,667 (76.8%) | 4,437 (23.2%) |
| Computers & Mathematics | 5,346 (72.9%) | 1,987 (27.1%) |
| Architecture & Engineering | 6,989 (87.2%) | 1,024 (12.8%) |
| Life, Physical & Social Science | 2,332 (62.1%) | 1,426 (38.0%) |
| Community & Social Service | 12,931 (30.9%) | 28,943 (69.1%) |
| Education, Arts & Media | 2,452 (33.5%) | 4,869 (66.5%) |
| Legal Services & Support | 1,040 (43.6%) | 1,345 (56.4%) |
| Education Instruction & Library | 7,121 (26.8%) | 19,473 (73.2%) |
| Arts, Media & Entertainment | 2,318 (41.6%) | 3,256 (58.4%) |
| Health Diagnosing & Treating | 6,023 (19.6%) | 24,658 (80.4%) |
| Health Technologists | 4,382 (20.2%) | 17,318 (79.8%) |
| Total (Category) | 74,766 (47.1%) | 84,042 (52.9%) |
| Total (Overall) | 218,921 (54.1%) | 185,851 (45.9%) |
Services Occupations
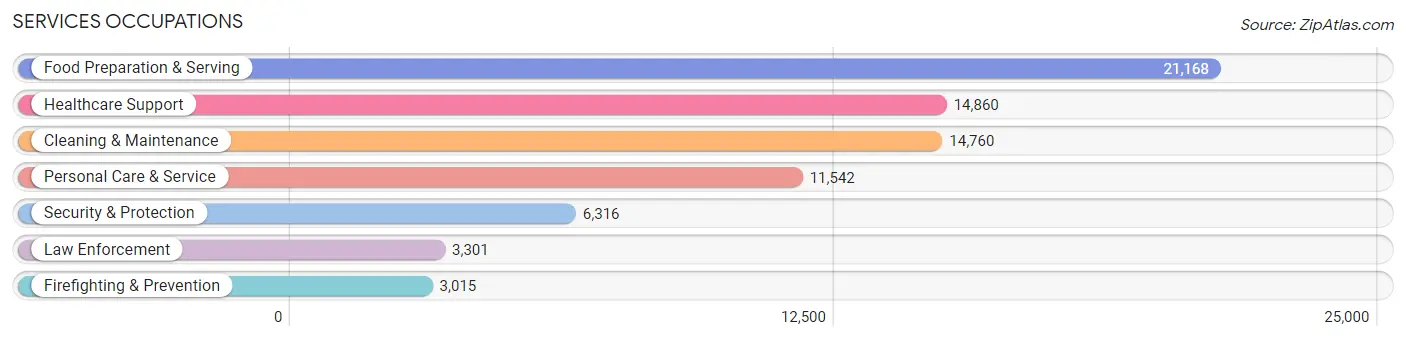
The most common Services occupations in North Dakota are Food Preparation & Serving (21,168 | 5.2%), Healthcare Support (14,860 | 3.7%), Cleaning & Maintenance (14,760 | 3.6%), Personal Care & Service (11,542 | 2.9%), and Security & Protection (6,316 | 1.6%).
Services Occupations by Sex
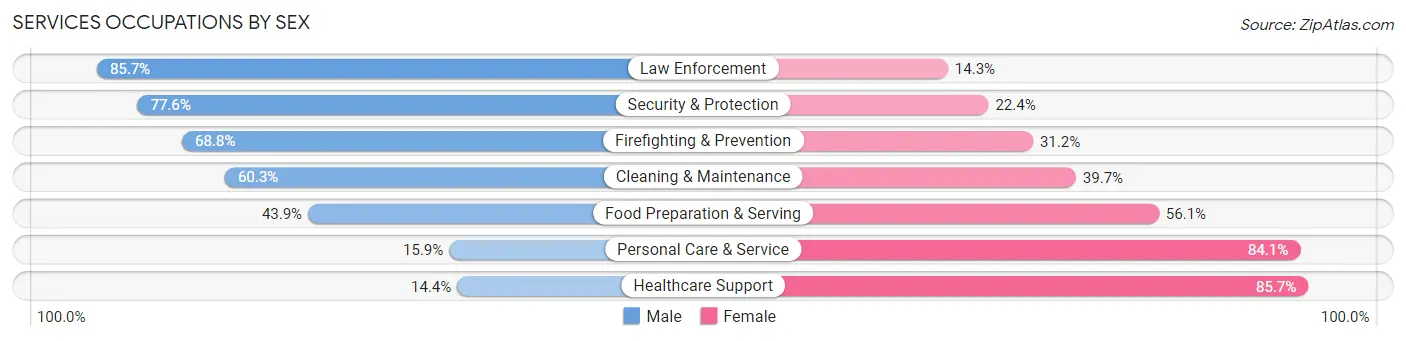
Within the Services occupations in North Dakota, the most male-oriented occupations are Law Enforcement (85.7%), Security & Protection (77.6%), and Firefighting & Prevention (68.8%), while the most female-oriented occupations are Healthcare Support (85.7%), Personal Care & Service (84.1%), and Food Preparation & Serving (56.1%).
| Occupation | Male | Female |
| Healthcare Support | 2,133 (14.3%) | 12,727 (85.7%) |
| Security & Protection | 4,903 (77.6%) | 1,413 (22.4%) |
| Firefighting & Prevention | 2,075 (68.8%) | 940 (31.2%) |
| Law Enforcement | 2,828 (85.7%) | 473 (14.3%) |
| Food Preparation & Serving | 9,291 (43.9%) | 11,877 (56.1%) |
| Cleaning & Maintenance | 8,903 (60.3%) | 5,857 (39.7%) |
| Personal Care & Service | 1,840 (15.9%) | 9,702 (84.1%) |
| Total (Category) | 27,070 (39.4%) | 41,576 (60.6%) |
| Total (Overall) | 218,921 (54.1%) | 185,851 (45.9%) |
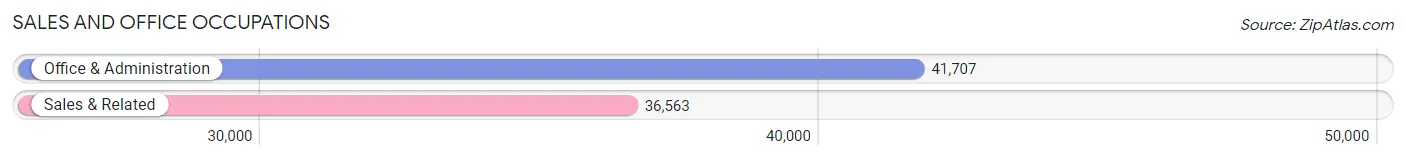
Sales and Office Occupations
The most common Sales and Office occupations in North Dakota are Office & Administration (41,707 | 10.3%), and Sales & Related (36,563 | 9.0%).
Sales and Office Occupations by Sex
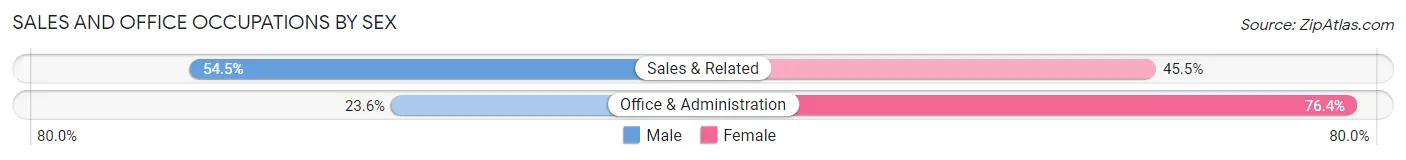
| Occupation | Male | Female |
| Sales & Related | 19,940 (54.5%) | 16,623 (45.5%) |
| Office & Administration | 9,860 (23.6%) | 31,847 (76.4%) |
| Total (Category) | 29,800 (38.1%) | 48,470 (61.9%) |
| Total (Overall) | 218,921 (54.1%) | 185,851 (45.9%) |
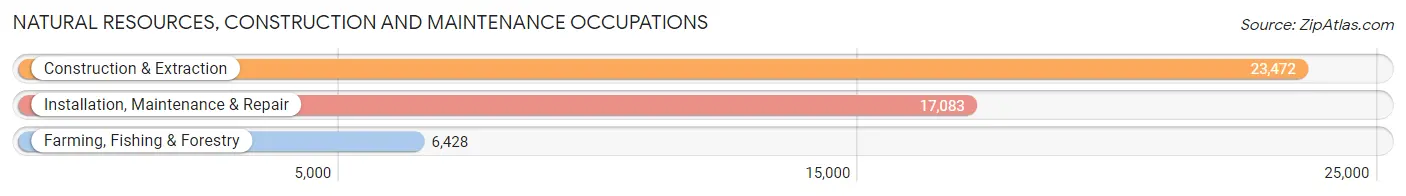
Natural Resources, Construction and Maintenance Occupations
The most common Natural Resources, Construction and Maintenance occupations in North Dakota are Construction & Extraction (23,472 | 5.8%), Installation, Maintenance & Repair (17,083 | 4.2%), and Farming, Fishing & Forestry (6,428 | 1.6%).
Natural Resources, Construction and Maintenance Occupations by Sex
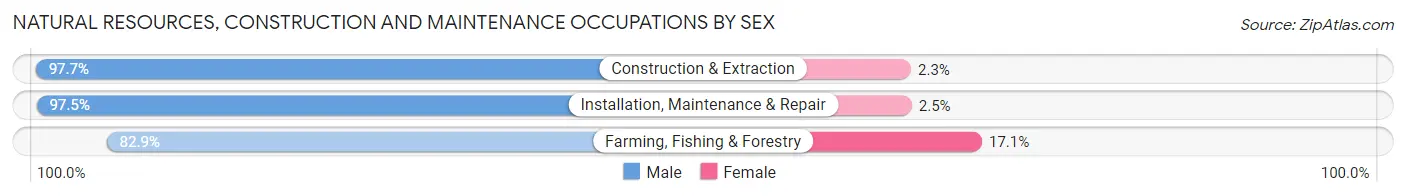
| Occupation | Male | Female |
| Farming, Fishing & Forestry | 5,330 (82.9%) | 1,098 (17.1%) |
| Construction & Extraction | 22,927 (97.7%) | 545 (2.3%) |
| Installation, Maintenance & Repair | 16,659 (97.5%) | 424 (2.5%) |
| Total (Category) | 44,916 (95.6%) | 2,067 (4.4%) |
| Total (Overall) | 218,921 (54.1%) | 185,851 (45.9%) |
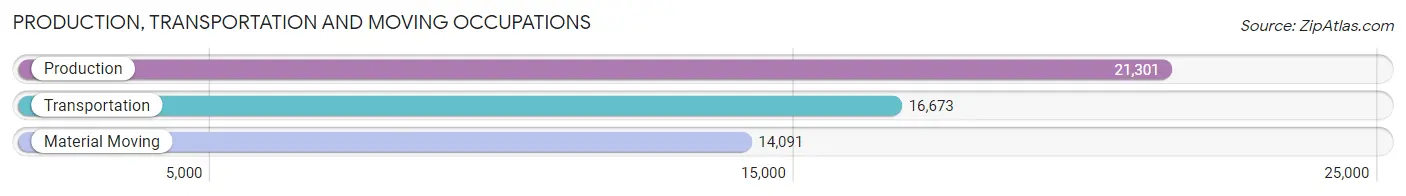
Production, Transportation and Moving Occupations
The most common Production, Transportation and Moving occupations in North Dakota are Production (21,301 | 5.3%), Transportation (16,673 | 4.1%), and Material Moving (14,091 | 3.5%).
Production, Transportation and Moving Occupations by Sex
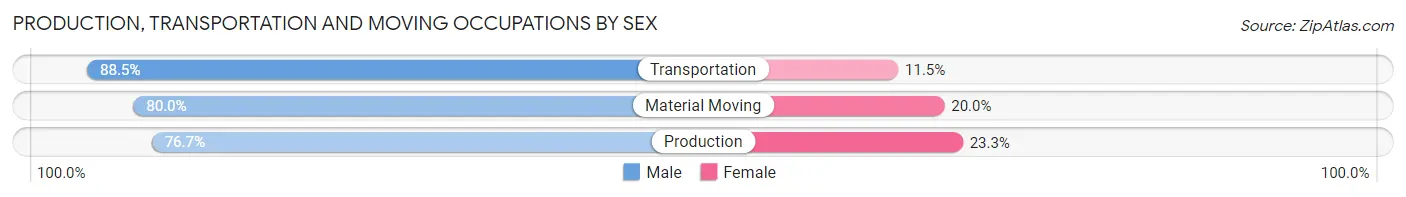
| Occupation | Male | Female |
| Production | 16,331 (76.7%) | 4,970 (23.3%) |
| Transportation | 14,759 (88.5%) | 1,914 (11.5%) |
| Material Moving | 11,279 (80.0%) | 2,812 (20.0%) |
| Total (Category) | 42,369 (81.4%) | 9,696 (18.6%) |
| Total (Overall) | 218,921 (54.1%) | 185,851 (45.9%) |
Employment Industries by Sex in North Dakota
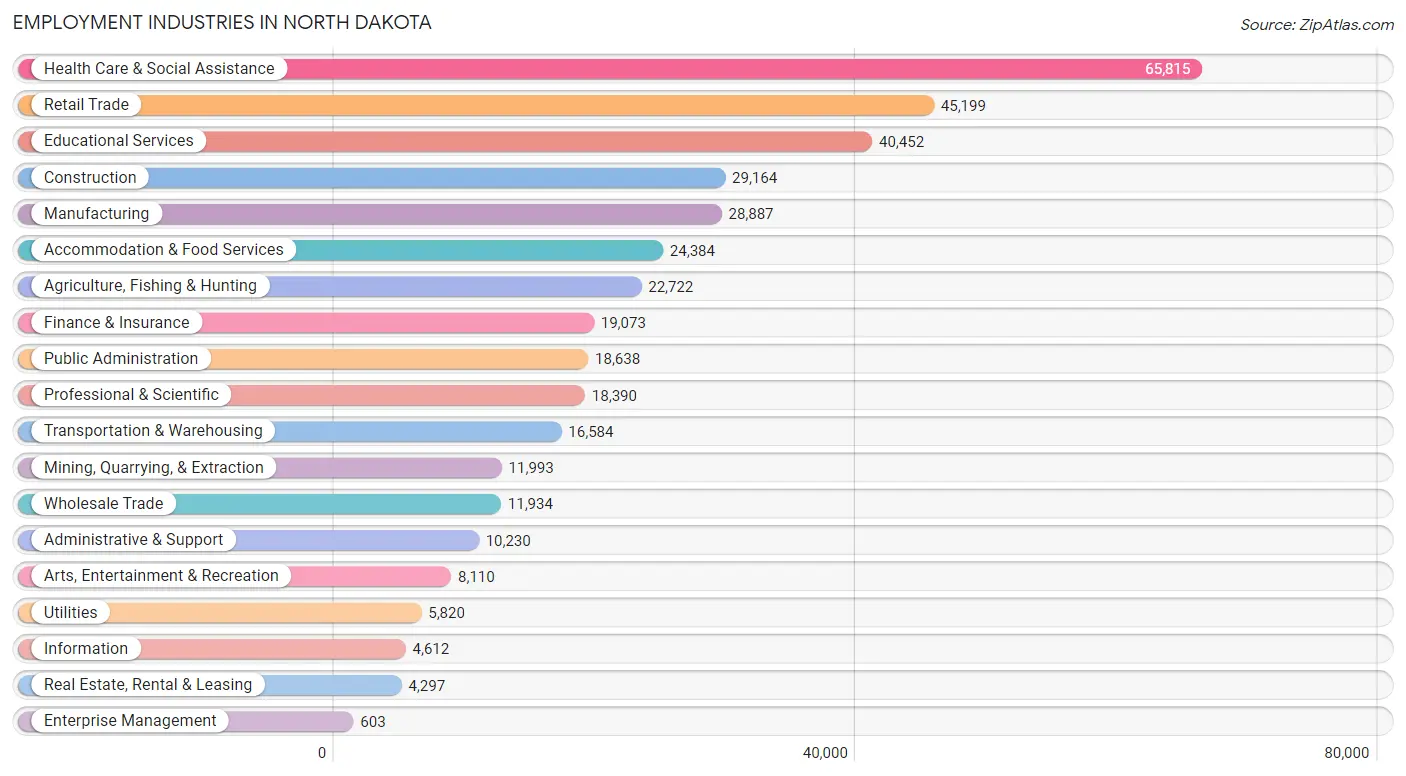
Employment Industries in North Dakota
The major employment industries in North Dakota include Health Care & Social Assistance (65,815 | 16.3%), Retail Trade (45,199 | 11.2%), Educational Services (40,452 | 10.0%), Construction (29,164 | 7.2%), and Manufacturing (28,887 | 7.1%).
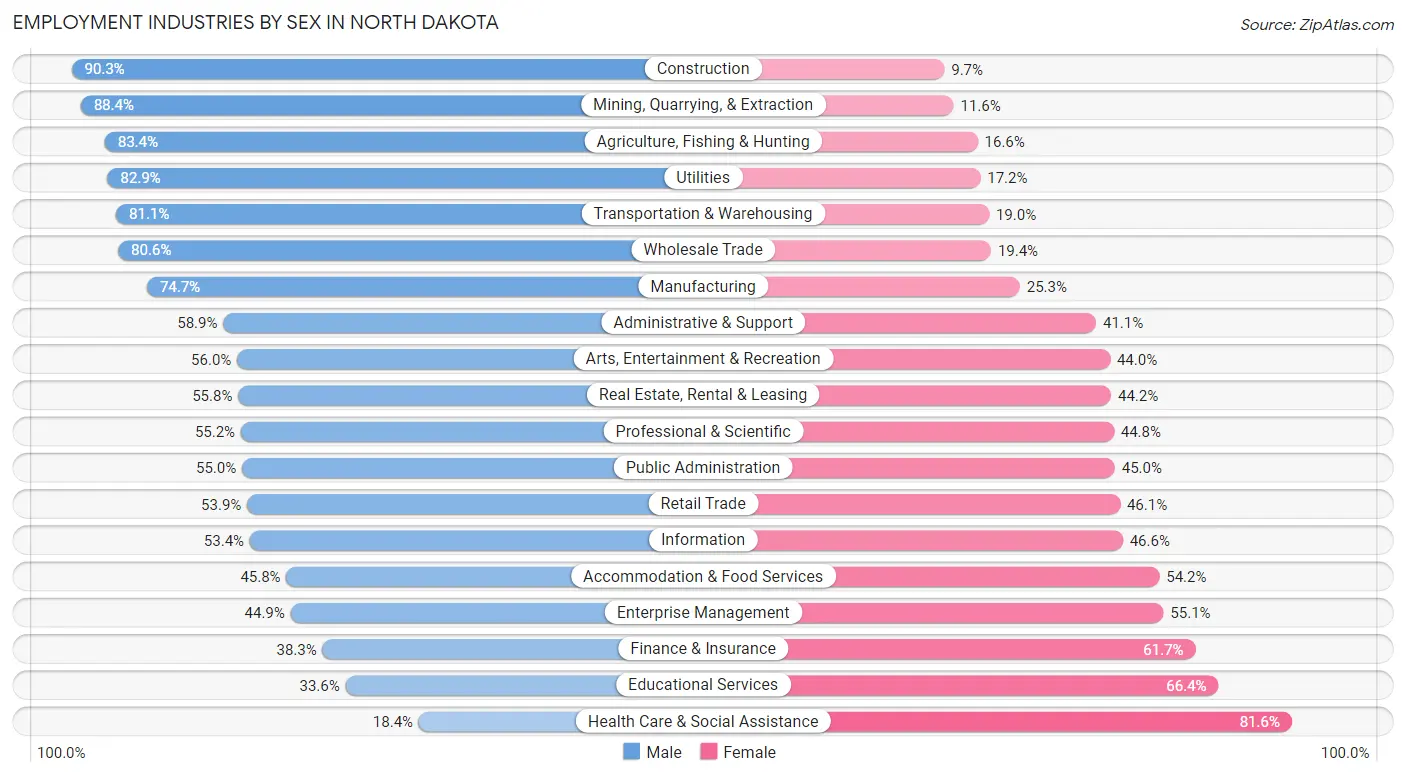
Employment Industries by Sex in North Dakota
The North Dakota industries that see more men than women are Construction (90.3%), Mining, Quarrying, & Extraction (88.4%), and Agriculture, Fishing & Hunting (83.4%), whereas the industries that tend to have a higher number of women are Health Care & Social Assistance (81.6%), Educational Services (66.4%), and Finance & Insurance (61.7%).
| Industry | Male | Female |
| Agriculture, Fishing & Hunting | 18,950 (83.4%) | 3,772 (16.6%) |
| Mining, Quarrying, & Extraction | 10,600 (88.4%) | 1,393 (11.6%) |
| Construction | 26,335 (90.3%) | 2,829 (9.7%) |
| Manufacturing | 21,571 (74.7%) | 7,316 (25.3%) |
| Wholesale Trade | 9,623 (80.6%) | 2,311 (19.4%) |
| Retail Trade | 24,376 (53.9%) | 20,823 (46.1%) |
| Transportation & Warehousing | 13,442 (81.0%) | 3,142 (19.0%) |
| Utilities | 4,822 (82.9%) | 998 (17.2%) |
| Information | 2,461 (53.4%) | 2,151 (46.6%) |
| Finance & Insurance | 7,311 (38.3%) | 11,762 (61.7%) |
| Real Estate, Rental & Leasing | 2,397 (55.8%) | 1,900 (44.2%) |
| Professional & Scientific | 10,155 (55.2%) | 8,235 (44.8%) |
| Enterprise Management | 271 (44.9%) | 332 (55.1%) |
| Administrative & Support | 6,023 (58.9%) | 4,207 (41.1%) |
| Educational Services | 13,579 (33.6%) | 26,873 (66.4%) |
| Health Care & Social Assistance | 12,101 (18.4%) | 53,714 (81.6%) |
| Arts, Entertainment & Recreation | 4,542 (56.0%) | 3,568 (44.0%) |
| Accommodation & Food Services | 11,169 (45.8%) | 13,215 (54.2%) |
| Public Administration | 10,250 (55.0%) | 8,388 (45.0%) |
| Total | 218,921 (54.1%) | 185,851 (45.9%) |
Education in North Dakota
School Enrollment in North Dakota
The most common levels of schooling among the 196,794 students in North Dakota are college / undergraduate (49,266 | 25.0%), middle school (40,846 | 20.8%), and elementary school (38,948 | 19.8%).
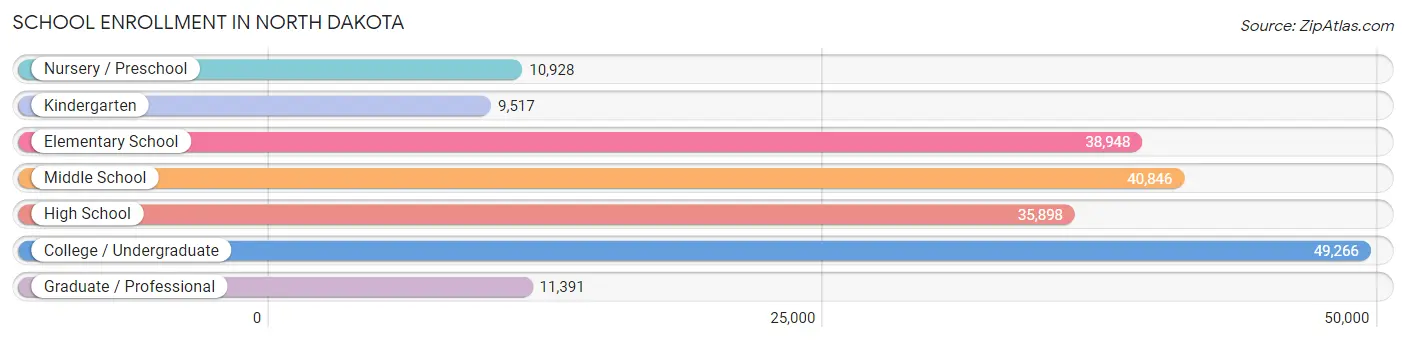
| School Level | # Students | % Students |
| Nursery / Preschool | 10,928 | 5.6% |
| Kindergarten | 9,517 | 4.8% |
| Elementary School | 38,948 | 19.8% |
| Middle School | 40,846 | 20.8% |
| High School | 35,898 | 18.2% |
| College / Undergraduate | 49,266 | 25.0% |
| Graduate / Professional | 11,391 | 5.8% |
| Total | 196,794 | 100.0% |
School Enrollment by Age by Funding Source in North Dakota
Out of a total of 196,794 students who are enrolled in schools in North Dakota, 23,025 (11.7%) attend a private institution, while the remaining 173,769 (88.3%) are enrolled in public schools. The age group of 3 to 4 year olds has the highest likelihood of being enrolled in private schools, with 2,042 (31.4% in the age bracket) enrolled. Conversely, the age group of 15 to 17 year olds has the lowest likelihood of being enrolled in a private school, with 24,476 (91.5% in the age bracket) attending a public institution.
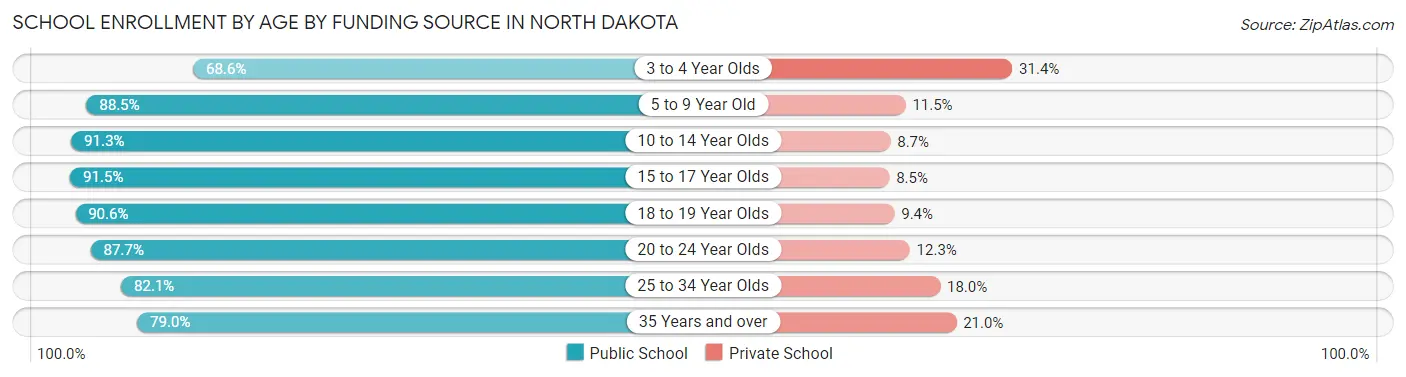
| Age Bracket | Public School | Private School |
| 3 to 4 Year Olds | 4,466 (68.6%) | 2,042 (31.4%) |
| 5 to 9 Year Old | 41,528 (88.5%) | 5,402 (11.5%) |
| 10 to 14 Year Olds | 45,442 (91.3%) | 4,320 (8.7%) |
| 15 to 17 Year Olds | 24,476 (91.5%) | 2,267 (8.5%) |
| 18 to 19 Year Olds | 17,834 (90.6%) | 1,856 (9.4%) |
| 20 to 24 Year Olds | 23,952 (87.7%) | 3,355 (12.3%) |
| 25 to 34 Year Olds | 9,047 (82.1%) | 1,979 (17.9%) |
| 35 Years and over | 6,978 (79.0%) | 1,850 (21.0%) |
| Total | 173,769 (88.3%) | 23,025 (11.7%) |
Educational Attainment by Field of Study in North Dakota
Business (32,594 | 18.8%), education (30,278 | 17.4%), science & technology (26,015 | 15.0%), arts & humanities (15,644 | 9.0%), and bio, nature & agricultural (14,246 | 8.2%) are the most common fields of study among 173,604 individuals in North Dakota who have obtained a bachelor's degree or higher.
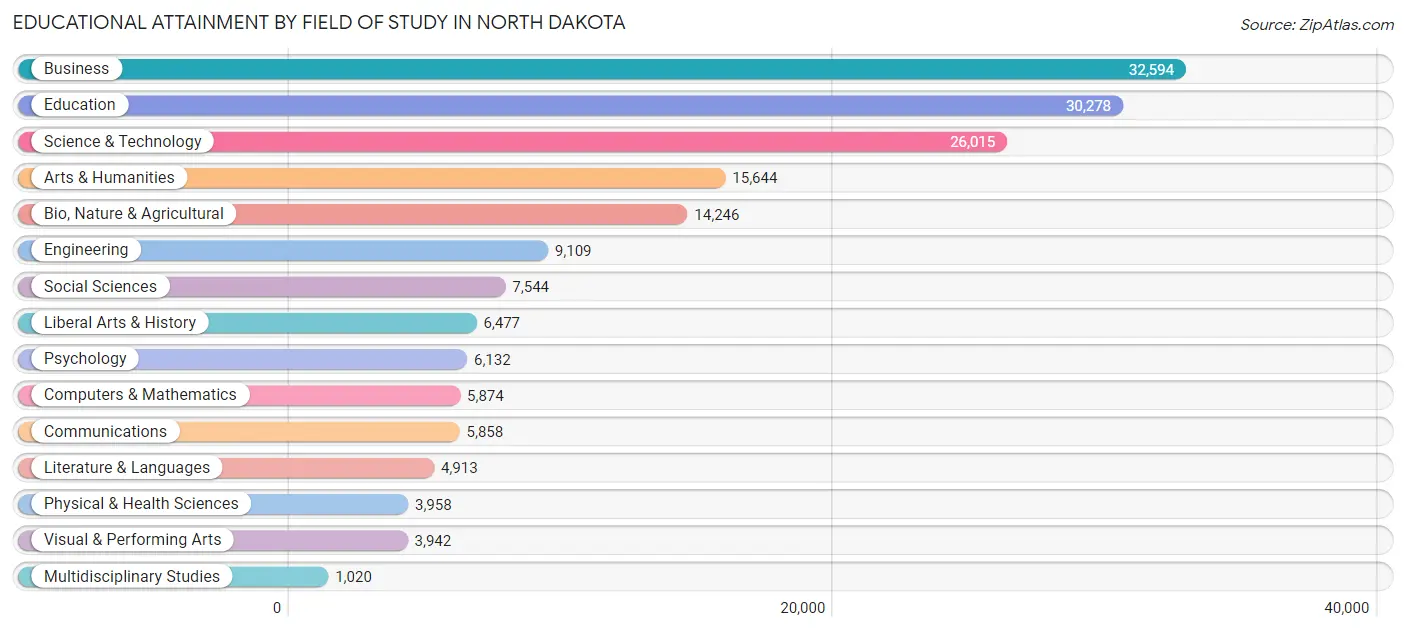
| Field of Study | # Graduates | % Graduates |
| Computers & Mathematics | 5,874 | 3.4% |
| Bio, Nature & Agricultural | 14,246 | 8.2% |
| Physical & Health Sciences | 3,958 | 2.3% |
| Psychology | 6,132 | 3.5% |
| Social Sciences | 7,544 | 4.3% |
| Engineering | 9,109 | 5.2% |
| Multidisciplinary Studies | 1,020 | 0.6% |
| Science & Technology | 26,015 | 15.0% |
| Business | 32,594 | 18.8% |
| Education | 30,278 | 17.4% |
| Literature & Languages | 4,913 | 2.8% |
| Liberal Arts & History | 6,477 | 3.7% |
| Visual & Performing Arts | 3,942 | 2.3% |
| Communications | 5,858 | 3.4% |
| Arts & Humanities | 15,644 | 9.0% |
| Total | 173,604 | 100.0% |
Transportation & Commute in North Dakota
Vehicle Availability by Sex in North Dakota
The most prevalent vehicle ownership categories in North Dakota are males with 2 vehicles (88,201, accounting for 40.7%) and females with 2 vehicles (73,234, making up 49.2%).
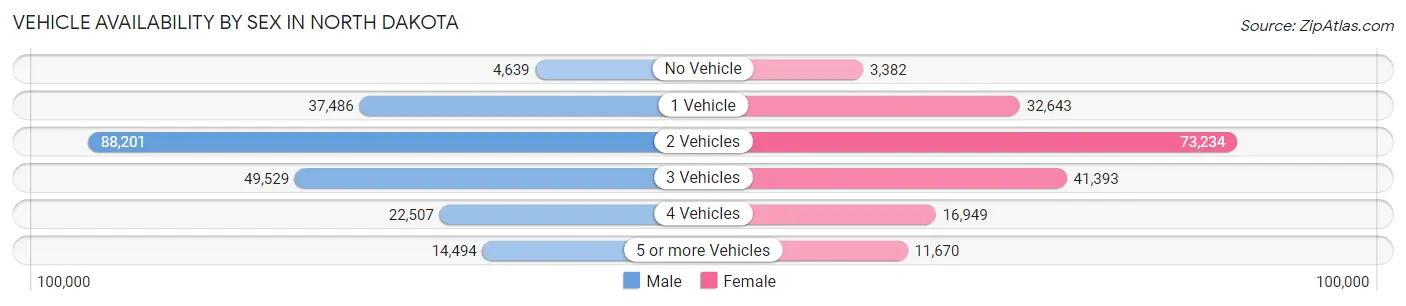
| Vehicles Available | Male | Female |
| No Vehicle | 4,639 (2.1%) | 3,382 (1.9%) |
| 1 Vehicle | 37,486 (17.3%) | 32,643 (18.2%) |
| 2 Vehicles | 88,201 (40.7%) | 73,234 (40.8%) |
| 3 Vehicles | 49,529 (22.8%) | 41,393 (23.1%) |
| 4 Vehicles | 22,507 (10.4%) | 16,949 (9.5%) |
| 5 or more Vehicles | 14,494 (6.7%) | 11,670 (6.5%) |
| Total | 216,856 (100.0%) | 179,271 (100.0%) |
Commute Time in North Dakota
The most frequently occuring commute durations in North Dakota are 10 to 14 minutes (88,675 commuters, 23.4%), 5 to 9 minutes (75,553 commuters, 20.0%), and 15 to 19 minutes (72,900 commuters, 19.3%).
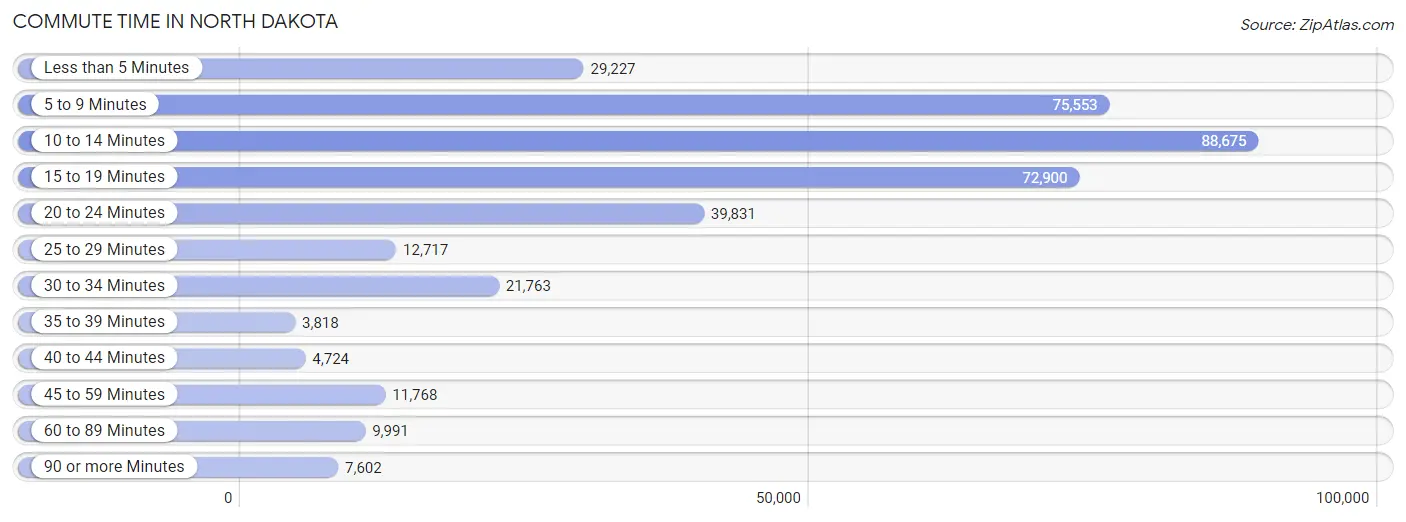
| Commute Time | # Commuters | % Commuters |
| Less than 5 Minutes | 29,227 | 7.7% |
| 5 to 9 Minutes | 75,553 | 20.0% |
| 10 to 14 Minutes | 88,675 | 23.4% |
| 15 to 19 Minutes | 72,900 | 19.3% |
| 20 to 24 Minutes | 39,831 | 10.5% |
| 25 to 29 Minutes | 12,717 | 3.4% |
| 30 to 34 Minutes | 21,763 | 5.8% |
| 35 to 39 Minutes | 3,818 | 1.0% |
| 40 to 44 Minutes | 4,724 | 1.3% |
| 45 to 59 Minutes | 11,768 | 3.1% |
| 60 to 89 Minutes | 9,991 | 2.6% |
| 90 or more Minutes | 7,602 | 2.0% |
Commute Time by Sex in North Dakota
The most common commute times in North Dakota are 10 to 14 minutes (47,773 commuters, 22.9%) for males and 10 to 14 minutes (40,902 commuters, 24.1%) for females.
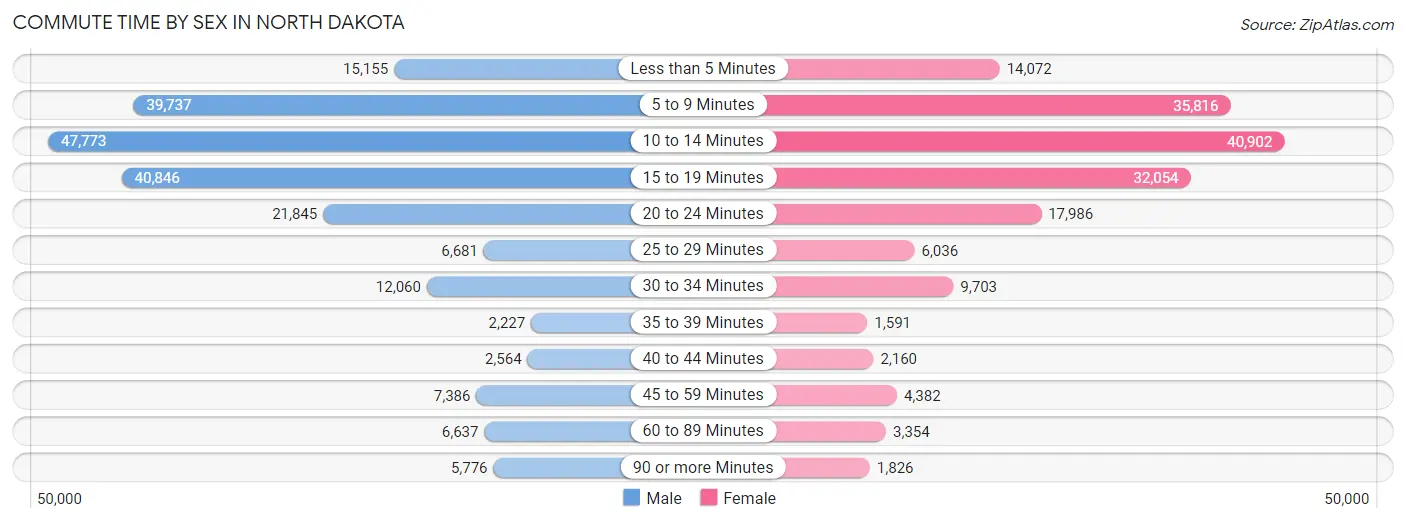
| Commute Time | Male | Female |
| Less than 5 Minutes | 15,155 (7.3%) | 14,072 (8.3%) |
| 5 to 9 Minutes | 39,737 (19.0%) | 35,816 (21.1%) |
| 10 to 14 Minutes | 47,773 (22.9%) | 40,902 (24.1%) |
| 15 to 19 Minutes | 40,846 (19.6%) | 32,054 (18.9%) |
| 20 to 24 Minutes | 21,845 (10.5%) | 17,986 (10.6%) |
| 25 to 29 Minutes | 6,681 (3.2%) | 6,036 (3.5%) |
| 30 to 34 Minutes | 12,060 (5.8%) | 9,703 (5.7%) |
| 35 to 39 Minutes | 2,227 (1.1%) | 1,591 (0.9%) |
| 40 to 44 Minutes | 2,564 (1.2%) | 2,160 (1.3%) |
| 45 to 59 Minutes | 7,386 (3.5%) | 4,382 (2.6%) |
| 60 to 89 Minutes | 6,637 (3.2%) | 3,354 (2.0%) |
| 90 or more Minutes | 5,776 (2.8%) | 1,826 (1.1%) |
Time of Departure to Work by Sex in North Dakota
The most frequent times of departure to work in North Dakota are 7:30 AM to 7:59 AM (37,503, 18.0%) for males and 7:30 AM to 7:59 AM (40,362, 23.8%) for females.
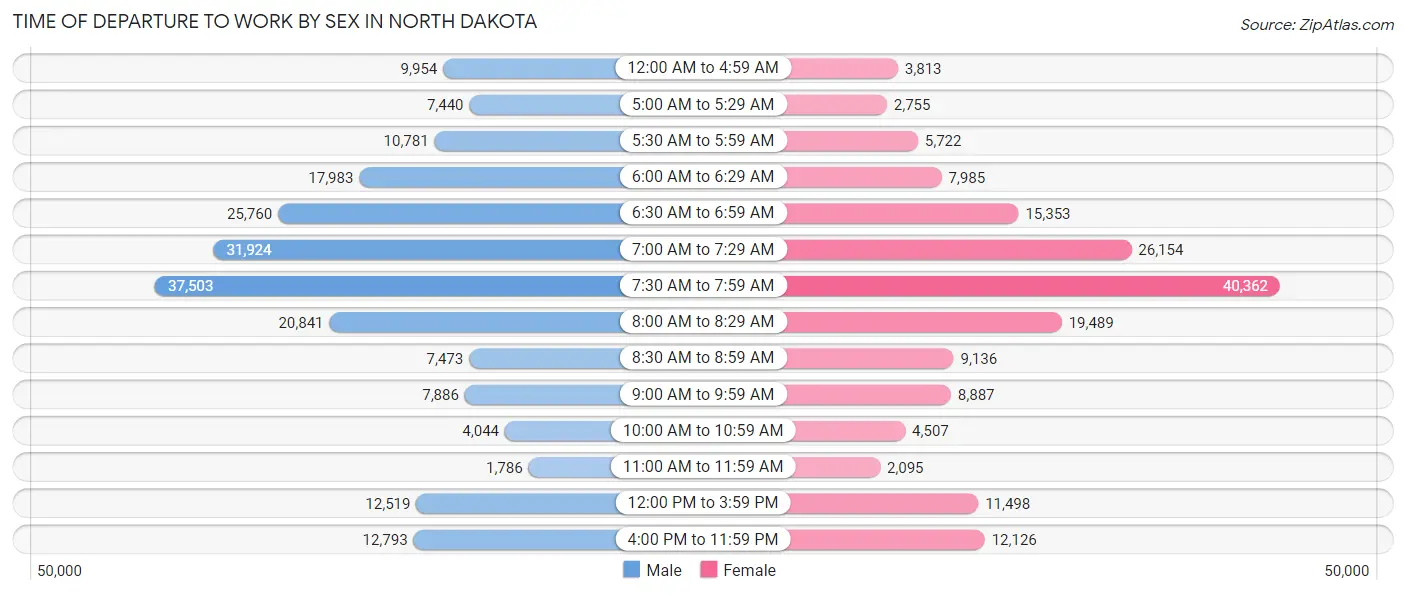
| Time of Departure | Male | Female |
| 12:00 AM to 4:59 AM | 9,954 (4.8%) | 3,813 (2.2%) |
| 5:00 AM to 5:29 AM | 7,440 (3.6%) | 2,755 (1.6%) |
| 5:30 AM to 5:59 AM | 10,781 (5.2%) | 5,722 (3.4%) |
| 6:00 AM to 6:29 AM | 17,983 (8.6%) | 7,985 (4.7%) |
| 6:30 AM to 6:59 AM | 25,760 (12.3%) | 15,353 (9.0%) |
| 7:00 AM to 7:29 AM | 31,924 (15.3%) | 26,154 (15.4%) |
| 7:30 AM to 7:59 AM | 37,503 (18.0%) | 40,362 (23.8%) |
| 8:00 AM to 8:29 AM | 20,841 (10.0%) | 19,489 (11.5%) |
| 8:30 AM to 8:59 AM | 7,473 (3.6%) | 9,136 (5.4%) |
| 9:00 AM to 9:59 AM | 7,886 (3.8%) | 8,887 (5.2%) |
| 10:00 AM to 10:59 AM | 4,044 (1.9%) | 4,507 (2.6%) |
| 11:00 AM to 11:59 AM | 1,786 (0.9%) | 2,095 (1.2%) |
| 12:00 PM to 3:59 PM | 12,519 (6.0%) | 11,498 (6.8%) |
| 4:00 PM to 11:59 PM | 12,793 (6.1%) | 12,126 (7.1%) |
| Total | 208,687 (100.0%) | 169,882 (100.0%) |
Housing Occupancy in North Dakota
Occupancy by Ownership in North Dakota
Of the total 320,038 dwellings in North Dakota, owner-occupied units account for 202,213 (63.2%), while renter-occupied units make up 117,825 (36.8%).
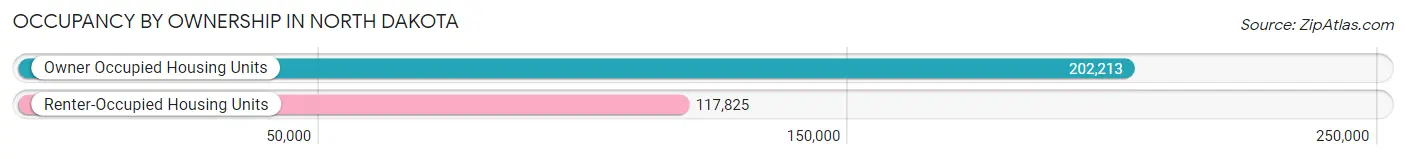
| Occupancy | # Housing Units | % Housing Units |
| Owner Occupied Housing Units | 202,213 | 63.2% |
| Renter-Occupied Housing Units | 117,825 | 36.8% |
| Total Occupied Housing Units | 320,038 | 100.0% |
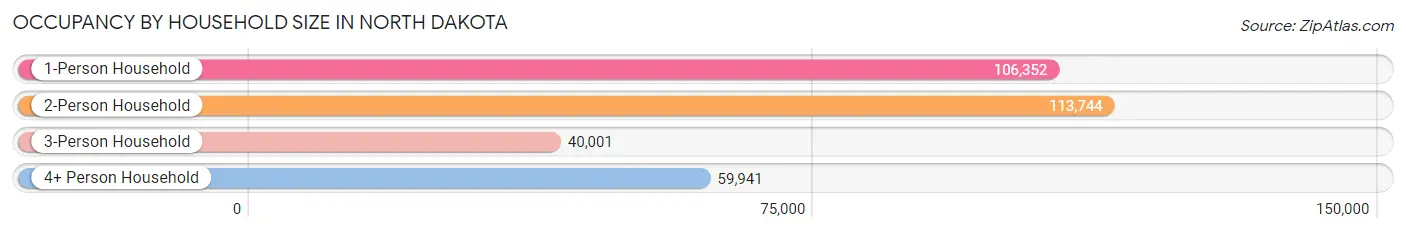
Occupancy by Household Size in North Dakota
| Household Size | # Housing Units | % Housing Units |
| 1-Person Household | 106,352 | 33.2% |
| 2-Person Household | 113,744 | 35.5% |
| 3-Person Household | 40,001 | 12.5% |
| 4+ Person Household | 59,941 | 18.7% |
| Total Housing Units | 320,038 | 100.0% |
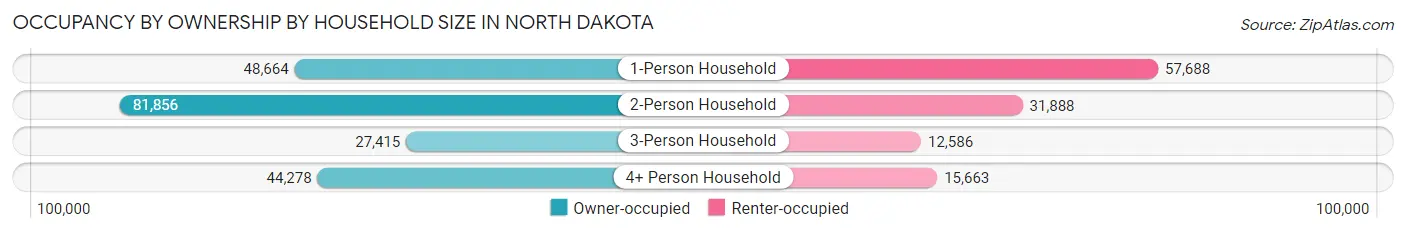
Occupancy by Ownership by Household Size in North Dakota
| Household Size | Owner-occupied | Renter-occupied |
| 1-Person Household | 48,664 (45.8%) | 57,688 (54.2%) |
| 2-Person Household | 81,856 (72.0%) | 31,888 (28.0%) |
| 3-Person Household | 27,415 (68.5%) | 12,586 (31.5%) |
| 4+ Person Household | 44,278 (73.9%) | 15,663 (26.1%) |
| Total Housing Units | 202,213 (63.2%) | 117,825 (36.8%) |
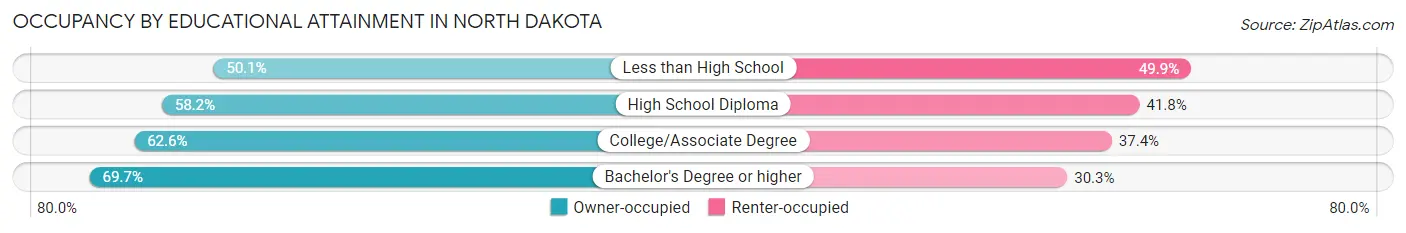
Occupancy by Educational Attainment in North Dakota
| Household Size | Owner-occupied | Renter-occupied |
| Less than High School | 8,729 (50.1%) | 8,706 (49.9%) |
| High School Diploma | 45,126 (58.2%) | 32,369 (41.8%) |
| College/Associate Degree | 75,319 (62.6%) | 44,976 (37.4%) |
| Bachelor's Degree or higher | 73,039 (69.7%) | 31,774 (30.3%) |
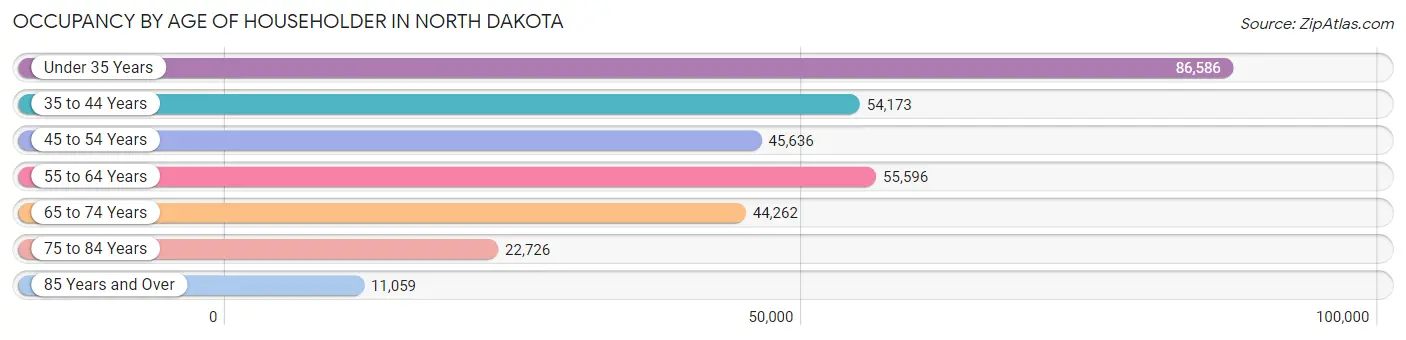
Occupancy by Age of Householder in North Dakota
| Age Bracket | # Households | % Households |
| Under 35 Years | 86,586 | 27.1% |
| 35 to 44 Years | 54,173 | 16.9% |
| 45 to 54 Years | 45,636 | 14.3% |
| 55 to 64 Years | 55,596 | 17.4% |
| 65 to 74 Years | 44,262 | 13.8% |
| 75 to 84 Years | 22,726 | 7.1% |
| 85 Years and Over | 11,059 | 3.5% |
| Total | 320,038 | 100.0% |
Housing Finances in North Dakota
Median Income by Occupancy in North Dakota
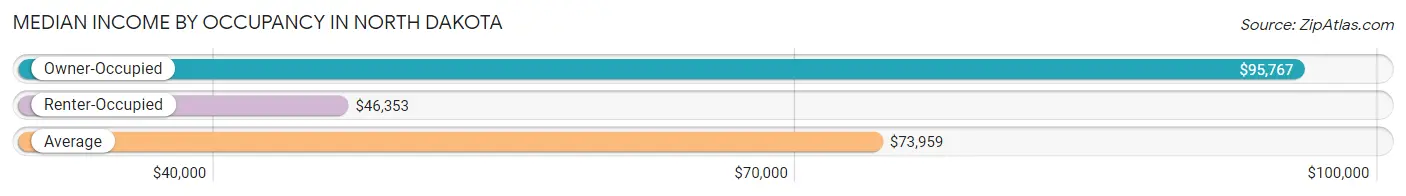
| Occupancy Type | # Households | Median Income |
| Owner-Occupied | 202,213 (63.2%) | $95,767 |
| Renter-Occupied | 117,825 (36.8%) | $46,353 |
| Average | 320,038 (100.0%) | $73,959 |
Occupancy by Householder Income Bracket in North Dakota
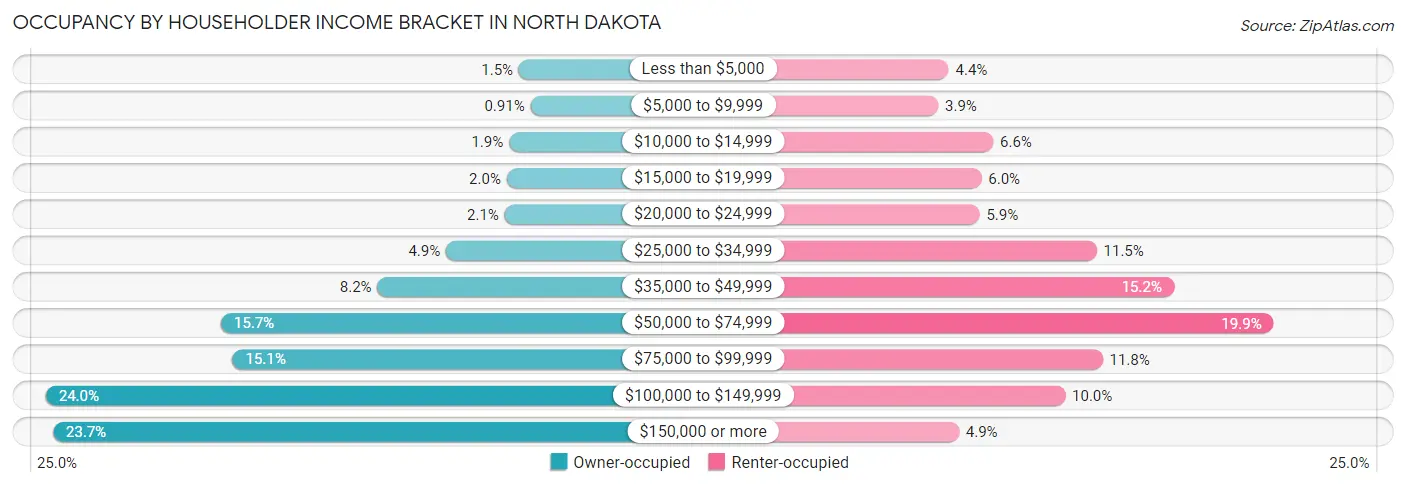
| Income Bracket | Owner-occupied | Renter-occupied |
| Less than $5,000 | 2,950 (1.5%) | 5,216 (4.4%) |
| $5,000 to $9,999 | 1,849 (0.9%) | 4,625 (3.9%) |
| $10,000 to $14,999 | 3,896 (1.9%) | 7,723 (6.6%) |
| $15,000 to $19,999 | 4,123 (2.0%) | 7,055 (6.0%) |
| $20,000 to $24,999 | 4,321 (2.1%) | 6,957 (5.9%) |
| $25,000 to $34,999 | 9,967 (4.9%) | 13,531 (11.5%) |
| $35,000 to $49,999 | 16,581 (8.2%) | 17,854 (15.1%) |
| $50,000 to $74,999 | 31,650 (15.7%) | 23,447 (19.9%) |
| $75,000 to $99,999 | 30,527 (15.1%) | 13,862 (11.8%) |
| $100,000 to $149,999 | 48,520 (24.0%) | 11,755 (10.0%) |
| $150,000 or more | 47,829 (23.6%) | 5,800 (4.9%) |
| Total | 202,213 (100.0%) | 117,825 (100.0%) |
Monthly Housing Cost Tiers in North Dakota
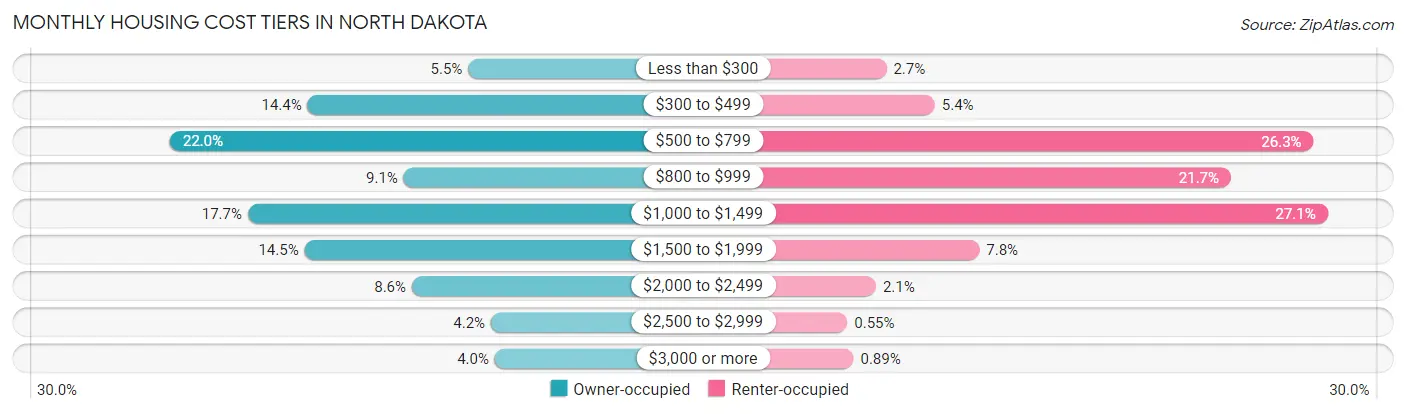
| Monthly Cost | Owner-occupied | Renter-occupied |
| Less than $300 | 11,127 (5.5%) | 3,193 (2.7%) |
| $300 to $499 | 29,067 (14.4%) | 6,340 (5.4%) |
| $500 to $799 | 44,453 (22.0%) | 30,980 (26.3%) |
| $800 to $999 | 18,317 (9.1%) | 25,598 (21.7%) |
| $1,000 to $1,499 | 35,721 (17.7%) | 31,896 (27.1%) |
| $1,500 to $1,999 | 29,405 (14.5%) | 9,238 (7.8%) |
| $2,000 to $2,499 | 17,414 (8.6%) | 2,508 (2.1%) |
| $2,500 to $2,999 | 8,566 (4.2%) | 648 (0.5%) |
| $3,000 or more | 8,143 (4.0%) | 1,046 (0.9%) |
| Total | 202,213 (100.0%) | 117,825 (100.0%) |
Physical Housing Characteristics in North Dakota
Housing Structures in North Dakota
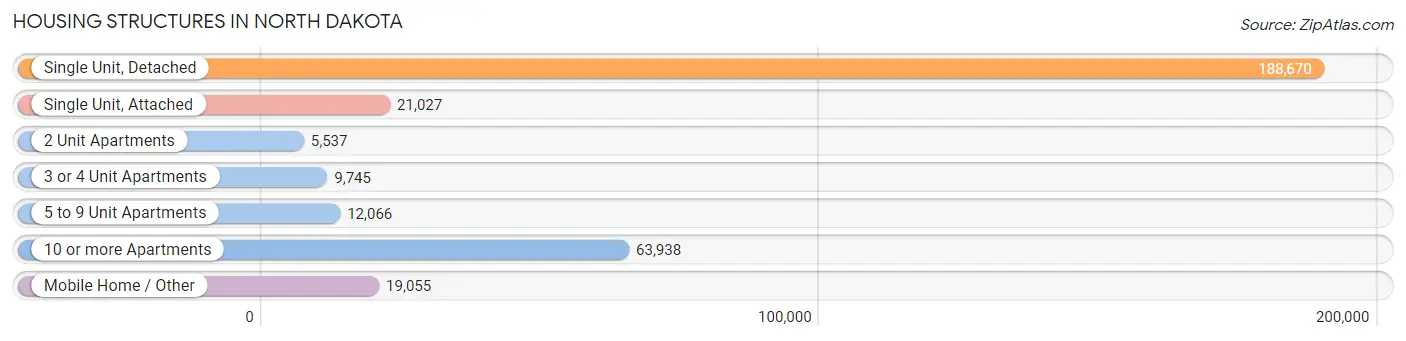
| Structure Type | # Housing Units | % Housing Units |
| Single Unit, Detached | 188,670 | 59.0% |
| Single Unit, Attached | 21,027 | 6.6% |
| 2 Unit Apartments | 5,537 | 1.7% |
| 3 or 4 Unit Apartments | 9,745 | 3.0% |
| 5 to 9 Unit Apartments | 12,066 | 3.8% |
| 10 or more Apartments | 63,938 | 20.0% |
| Mobile Home / Other | 19,055 | 5.9% |
| Total | 320,038 | 100.0% |
Housing Structures by Occupancy in North Dakota
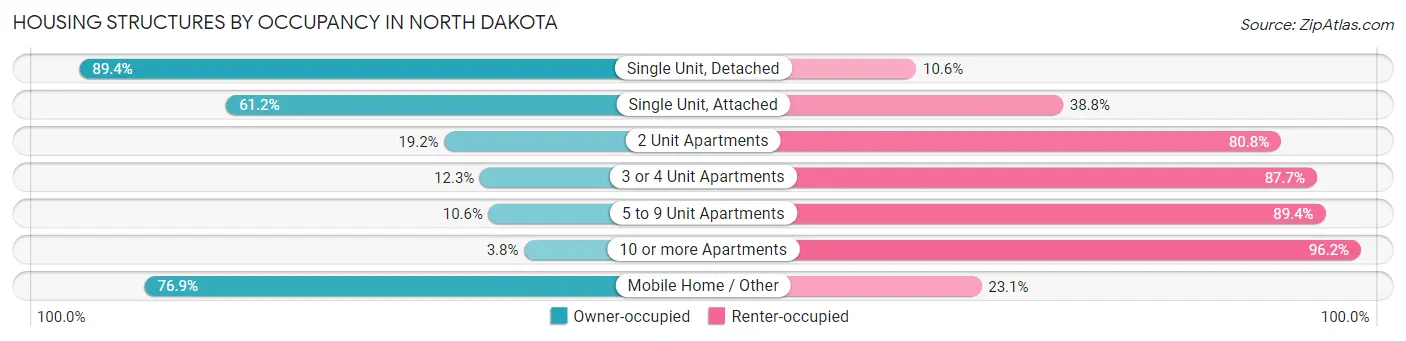
| Structure Type | Owner-occupied | Renter-occupied |
| Single Unit, Detached | 168,745 (89.4%) | 19,925 (10.6%) |
| Single Unit, Attached | 12,863 (61.2%) | 8,164 (38.8%) |
| 2 Unit Apartments | 1,061 (19.2%) | 4,476 (80.8%) |
| 3 or 4 Unit Apartments | 1,198 (12.3%) | 8,547 (87.7%) |
| 5 to 9 Unit Apartments | 1,281 (10.6%) | 10,785 (89.4%) |
| 10 or more Apartments | 2,415 (3.8%) | 61,523 (96.2%) |
| Mobile Home / Other | 14,650 (76.9%) | 4,405 (23.1%) |
| Total | 202,213 (63.2%) | 117,825 (36.8%) |
Housing Structures by Number of Rooms in North Dakota
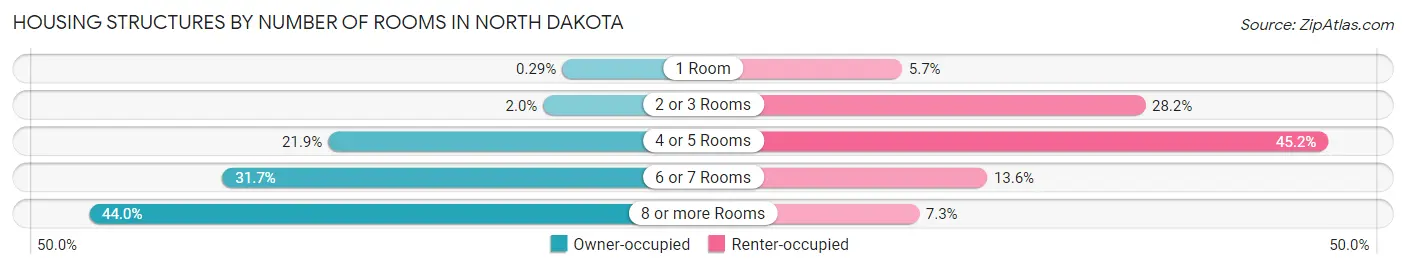
| Number of Rooms | Owner-occupied | Renter-occupied |
| 1 Room | 585 (0.3%) | 6,755 (5.7%) |
| 2 or 3 Rooms | 4,130 (2.0%) | 33,254 (28.2%) |
| 4 or 5 Rooms | 44,338 (21.9%) | 53,194 (45.2%) |
| 6 or 7 Rooms | 64,108 (31.7%) | 16,020 (13.6%) |
| 8 or more Rooms | 89,052 (44.0%) | 8,602 (7.3%) |
| Total | 202,213 (100.0%) | 117,825 (100.0%) |
Housing Structure by Heating Type in North Dakota
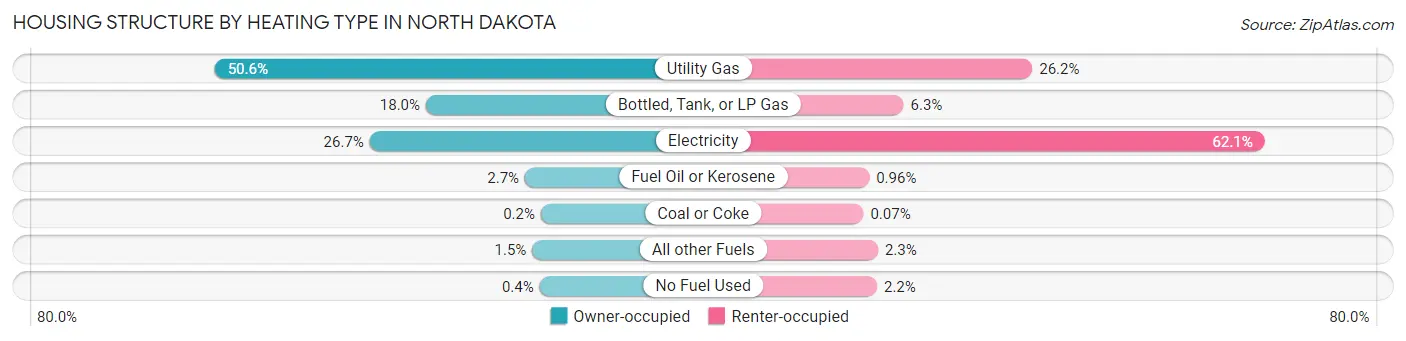
| Heating Type | Owner-occupied | Renter-occupied |
| Utility Gas | 102,310 (50.6%) | 30,839 (26.2%) |
| Bottled, Tank, or LP Gas | 36,329 (18.0%) | 7,386 (6.3%) |
| Electricity | 53,901 (26.7%) | 73,138 (62.1%) |
| Fuel Oil or Kerosene | 5,359 (2.6%) | 1,127 (1.0%) |
| Coal or Coke | 403 (0.2%) | 77 (0.1%) |
| All other Fuels | 3,097 (1.5%) | 2,716 (2.3%) |
| No Fuel Used | 814 (0.4%) | 2,542 (2.2%) |
| Total | 202,213 (100.0%) | 117,825 (100.0%) |
Household Vehicle Usage in North Dakota
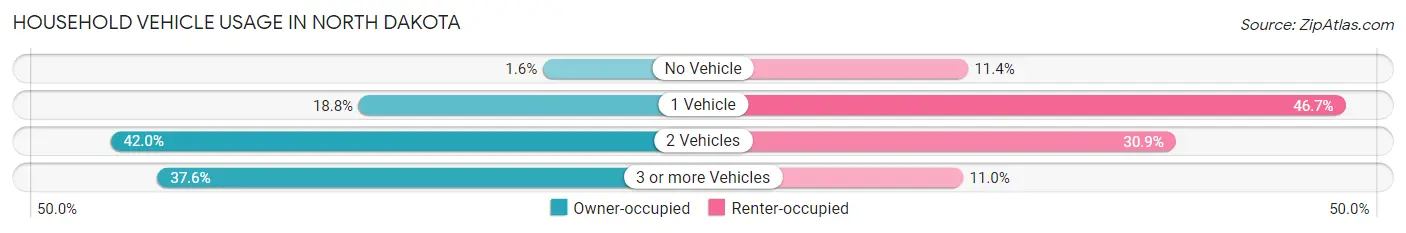
| Vehicles per Household | Owner-occupied | Renter-occupied |
| No Vehicle | 3,260 (1.6%) | 13,482 (11.4%) |
| 1 Vehicle | 37,995 (18.8%) | 55,048 (46.7%) |
| 2 Vehicles | 84,896 (42.0%) | 36,361 (30.9%) |
| 3 or more Vehicles | 76,062 (37.6%) | 12,934 (11.0%) |
| Total | 202,213 (100.0%) | 117,825 (100.0%) |
Real Estate & Mortgages in North Dakota
Real Estate and Mortgage Overview in North Dakota
| Characteristic | Without Mortgage | With Mortgage |
| Housing Units | 95,926 | 106,287 |
| Median Property Value | $198,400 | $256,700 |
| Median Household Income | $76,185 | $29,792 |
| Monthly Housing Costs | $551 | $7,974 |
| Real Estate Taxes | $1,883 | $2,921 |
Property Value by Mortgage Status in North Dakota
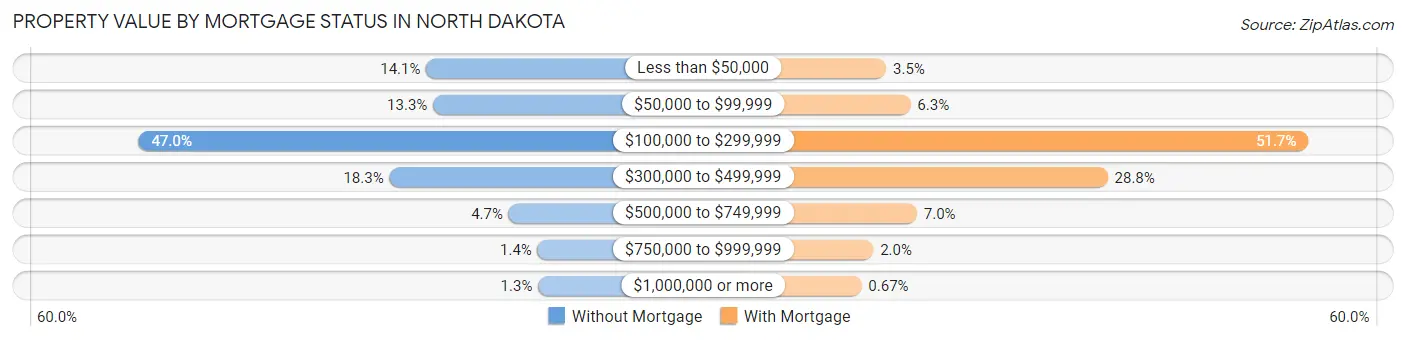
| Property Value | Without Mortgage | With Mortgage |
| Less than $50,000 | 13,520 (14.1%) | 3,708 (3.5%) |
| $50,000 to $99,999 | 12,763 (13.3%) | 6,662 (6.3%) |
| $100,000 to $299,999 | 45,066 (47.0%) | 54,983 (51.7%) |
| $300,000 to $499,999 | 17,558 (18.3%) | 30,621 (28.8%) |
| $500,000 to $749,999 | 4,470 (4.7%) | 7,455 (7.0%) |
| $750,000 to $999,999 | 1,301 (1.4%) | 2,151 (2.0%) |
| $1,000,000 or more | 1,248 (1.3%) | 707 (0.7%) |
| Total | 95,926 (100.0%) | 106,287 (100.0%) |
Household Income by Mortgage Status in North Dakota
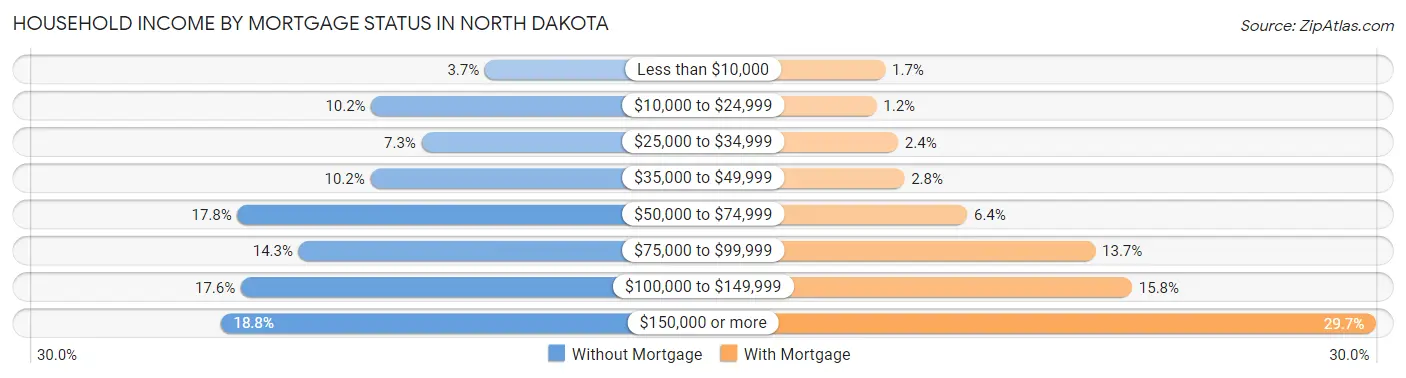
| Household Income | Without Mortgage | With Mortgage |
| Less than $10,000 | 3,537 (3.7%) | 1,801 (1.7%) |
| $10,000 to $24,999 | 9,763 (10.2%) | 1,262 (1.2%) |
| $25,000 to $34,999 | 7,013 (7.3%) | 2,577 (2.4%) |
| $35,000 to $49,999 | 9,813 (10.2%) | 2,954 (2.8%) |
| $50,000 to $74,999 | 17,102 (17.8%) | 6,768 (6.4%) |
| $75,000 to $99,999 | 13,746 (14.3%) | 14,548 (13.7%) |
| $100,000 to $149,999 | 16,915 (17.6%) | 16,781 (15.8%) |
| $150,000 or more | 18,037 (18.8%) | 31,605 (29.7%) |
| Total | 95,926 (100.0%) | 106,287 (100.0%) |
Property Value to Household Income Ratio in North Dakota
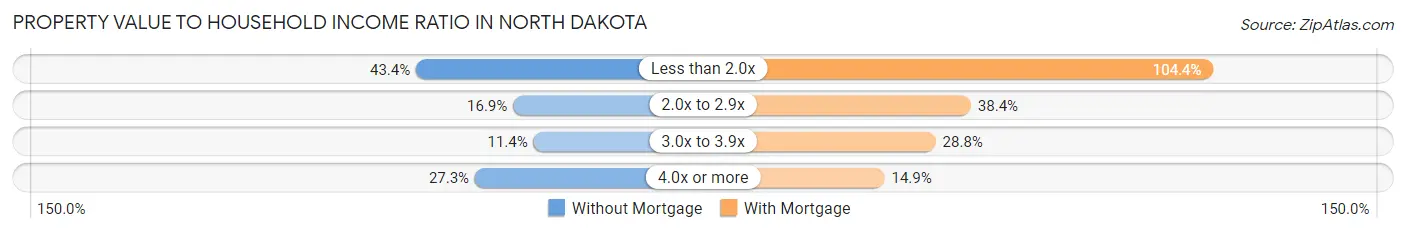
| Value-to-Income Ratio | Without Mortgage | With Mortgage |
| Less than 2.0x | 41,605 (43.4%) | 111,003 (104.4%) |
| 2.0x to 2.9x | 16,245 (16.9%) | 40,822 (38.4%) |
| 3.0x to 3.9x | 10,899 (11.4%) | 30,617 (28.8%) |
| 4.0x or more | 26,206 (27.3%) | 15,821 (14.9%) |
| Total | 95,926 (100.0%) | 106,287 (100.0%) |
Real Estate Taxes by Mortgage Status in North Dakota
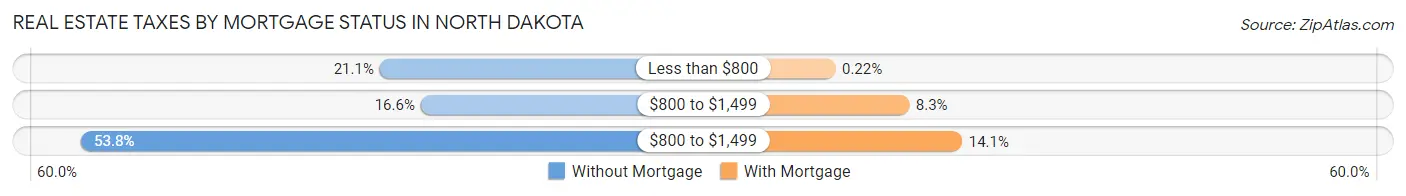
| Property Taxes | Without Mortgage | With Mortgage |
| Less than $800 | 20,217 (21.1%) | 239 (0.2%) |
| $800 to $1,499 | 15,912 (16.6%) | 8,828 (8.3%) |
| $800 to $1,499 | 51,605 (53.8%) | 14,994 (14.1%) |
| Total | 95,926 (100.0%) | 106,287 (100.0%) |
Health & Disability in North Dakota
Health Insurance Coverage by Age in North Dakota
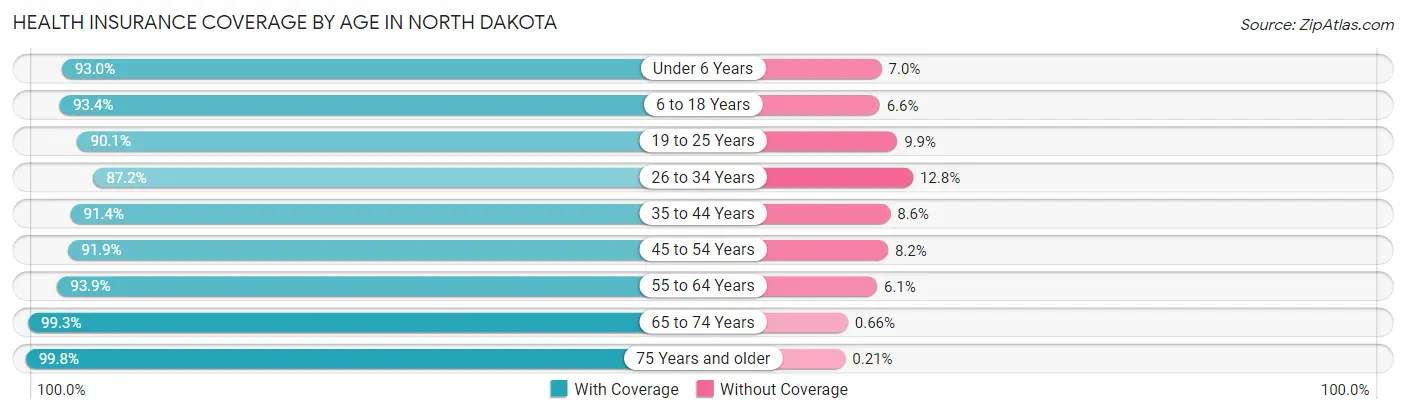
| Age Bracket | With Coverage | Without Coverage |
| Under 6 Years | 57,732 (93.0%) | 4,316 (7.0%) |
| 6 to 18 Years | 123,583 (93.4%) | 8,749 (6.6%) |
| 19 to 25 Years | 76,696 (90.1%) | 8,405 (9.9%) |
| 26 to 34 Years | 84,558 (87.2%) | 12,425 (12.8%) |
| 35 to 44 Years | 87,520 (91.4%) | 8,209 (8.6%) |
| 45 to 54 Years | 72,032 (91.8%) | 6,390 (8.2%) |
| 55 to 64 Years | 86,941 (93.9%) | 5,660 (6.1%) |
| 65 to 74 Years | 68,482 (99.3%) | 452 (0.7%) |
| 75 Years and older | 47,360 (99.8%) | 99 (0.2%) |
| Total | 704,904 (92.8%) | 54,705 (7.2%) |
Health Insurance Coverage by Citizenship Status in North Dakota
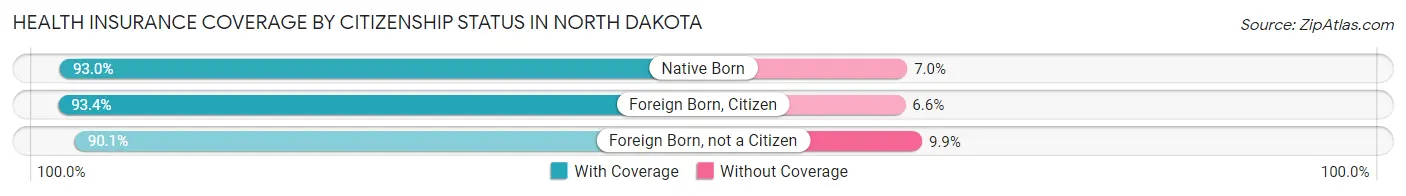
| Citizenship Status | With Coverage | Without Coverage |
| Native Born | 57,732 (93.0%) | 4,316 (7.0%) |
| Foreign Born, Citizen | 123,583 (93.4%) | 8,749 (6.6%) |
| Foreign Born, not a Citizen | 76,696 (90.1%) | 8,405 (9.9%) |
Health Insurance Coverage by Household Income in North Dakota
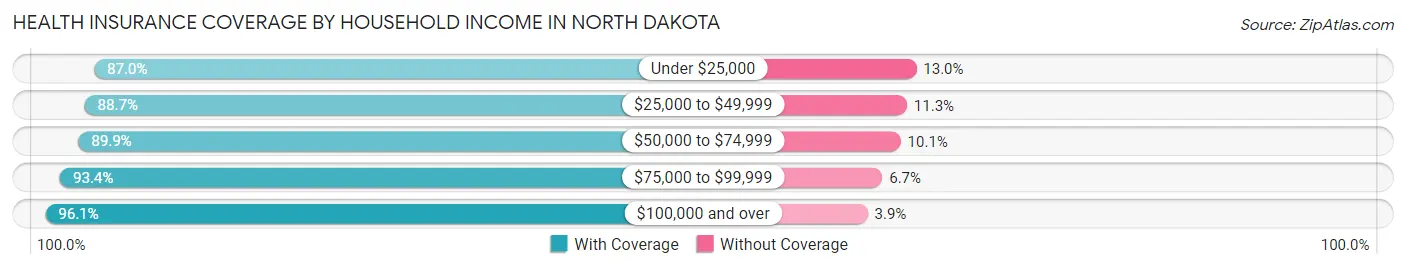
| Household Income | With Coverage | Without Coverage |
| Under $25,000 | 65,326 (87.0%) | 9,784 (13.0%) |
| $25,000 to $49,999 | 91,019 (88.7%) | 11,547 (11.3%) |
| $50,000 to $74,999 | 103,736 (89.9%) | 11,644 (10.1%) |
| $75,000 to $99,999 | 103,319 (93.3%) | 7,360 (6.7%) |
| $100,000 and over | 326,797 (96.1%) | 13,223 (3.9%) |
Public vs Private Health Insurance Coverage by Age in North Dakota
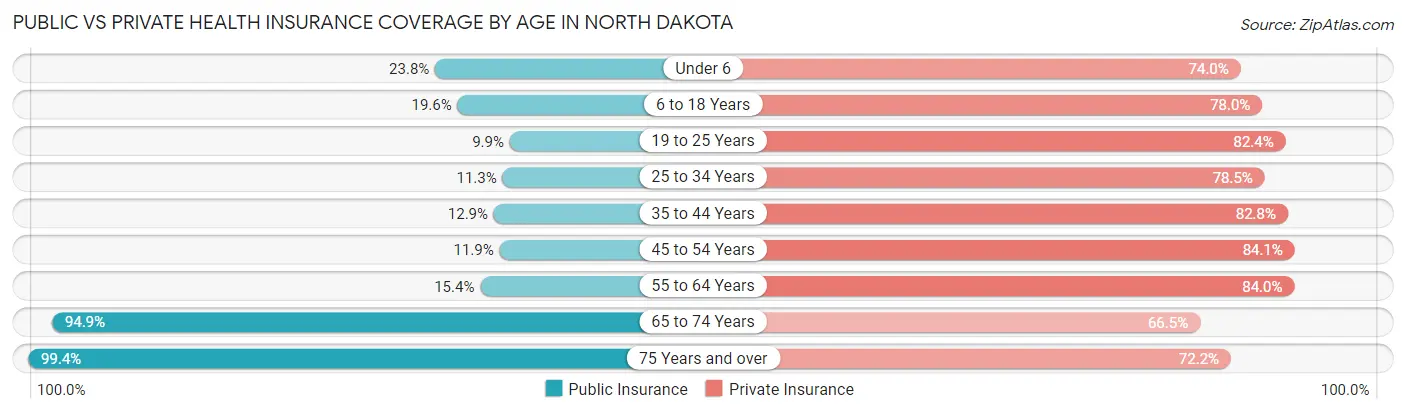
| Age Bracket | Public Insurance | Private Insurance |
| Under 6 | 14,760 (23.8%) | 45,925 (74.0%) |
| 6 to 18 Years | 25,986 (19.6%) | 103,261 (78.0%) |
| 19 to 25 Years | 8,456 (9.9%) | 70,090 (82.4%) |
| 25 to 34 Years | 10,940 (11.3%) | 76,123 (78.5%) |
| 35 to 44 Years | 12,348 (12.9%) | 79,246 (82.8%) |
| 45 to 54 Years | 9,291 (11.8%) | 65,920 (84.1%) |
| 55 to 64 Years | 14,289 (15.4%) | 77,769 (84.0%) |
| 65 to 74 Years | 65,437 (94.9%) | 45,825 (66.5%) |
| 75 Years and over | 47,165 (99.4%) | 34,273 (72.2%) |
| Total | 208,672 (27.5%) | 598,432 (78.8%) |
Disability Status by Sex by Age in North Dakota
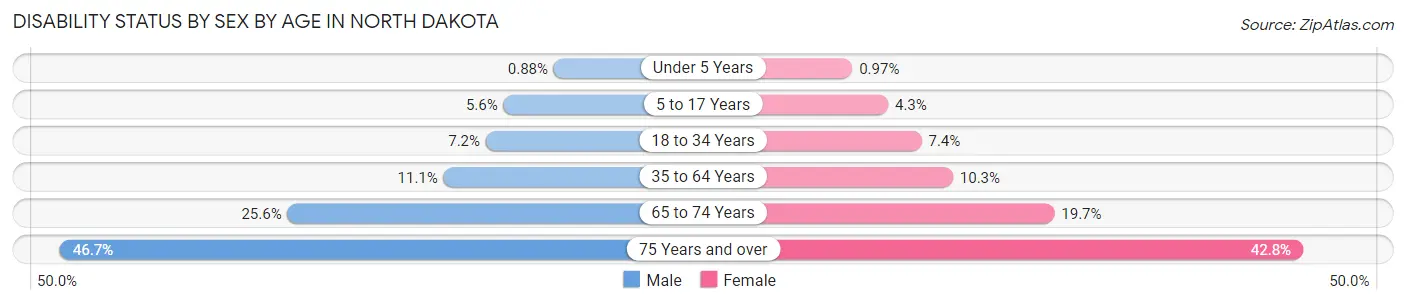
| Age Bracket | Male | Female |
| Under 5 Years | 236 (0.9%) | 242 (1.0%) |
| 5 to 17 Years | 3,737 (5.6%) | 2,723 (4.3%) |
| 18 to 34 Years | 7,299 (7.2%) | 6,837 (7.4%) |
| 35 to 64 Years | 15,383 (11.1%) | 13,225 (10.3%) |
| 65 to 74 Years | 8,852 (25.6%) | 6,778 (19.7%) |
| 75 Years and over | 9,250 (46.7%) | 11,835 (42.8%) |
Disability Class by Sex by Age in North Dakota
Disability Class: Hearing Difficulty
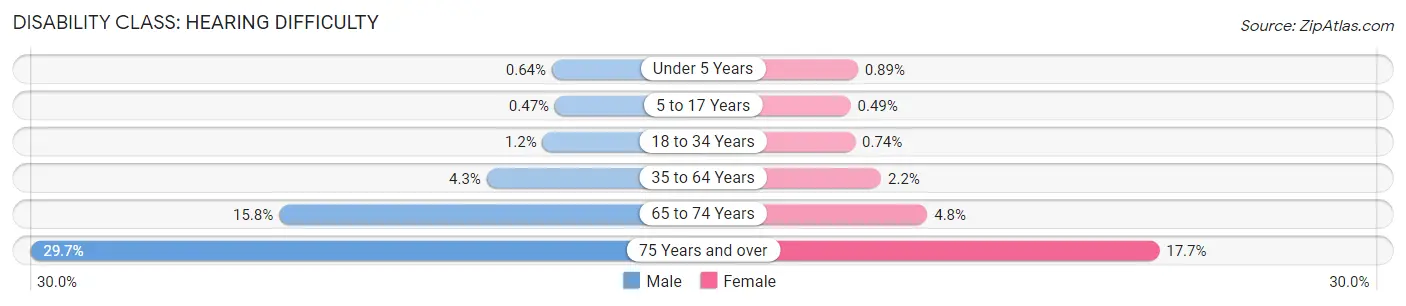
| Age Bracket | Male | Female |
| Under 5 Years | 171 (0.6%) | 221 (0.9%) |
| 5 to 17 Years | 315 (0.5%) | 310 (0.5%) |
| 18 to 34 Years | 1,183 (1.2%) | 684 (0.7%) |
| 35 to 64 Years | 5,917 (4.3%) | 2,808 (2.2%) |
| 65 to 74 Years | 5,474 (15.8%) | 1,634 (4.8%) |
| 75 Years and over | 5,876 (29.7%) | 4,890 (17.7%) |
Disability Class: Vision Difficulty
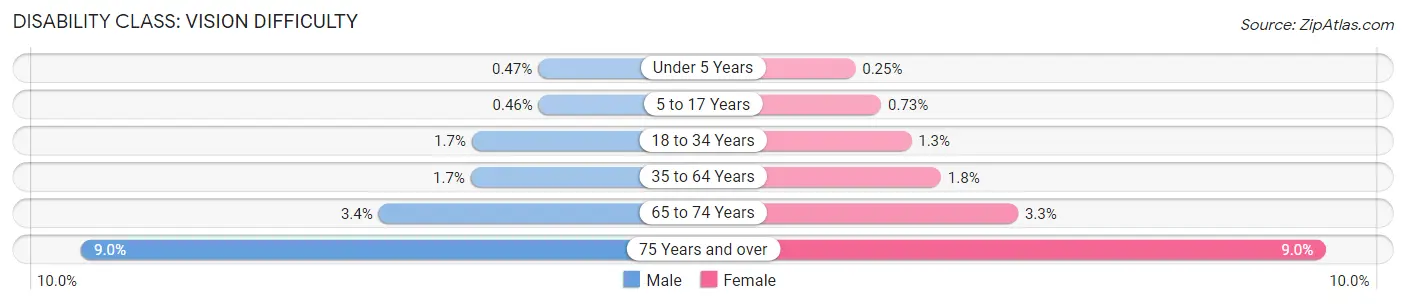
| Age Bracket | Male | Female |
| Under 5 Years | 126 (0.5%) | 62 (0.3%) |
| 5 to 17 Years | 307 (0.5%) | 461 (0.7%) |
| 18 to 34 Years | 1,731 (1.7%) | 1,189 (1.3%) |
| 35 to 64 Years | 2,383 (1.7%) | 2,357 (1.8%) |
| 65 to 74 Years | 1,186 (3.4%) | 1,123 (3.3%) |
| 75 Years and over | 1,773 (8.9%) | 2,480 (9.0%) |
Disability Class: Cognitive Difficulty
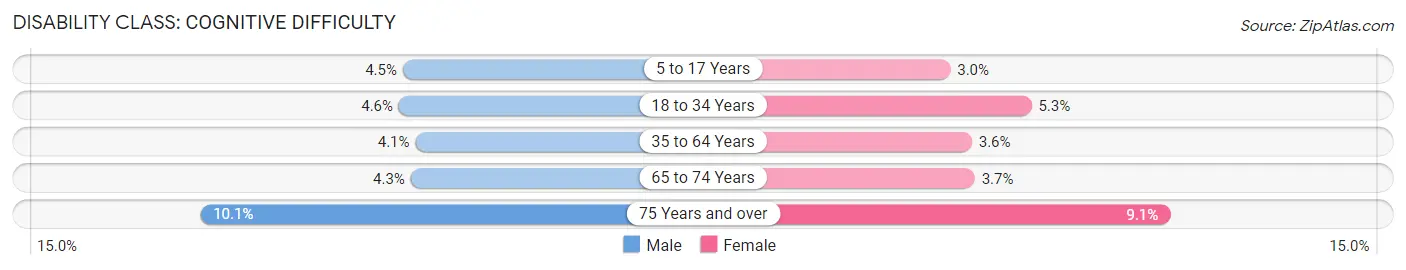
| Age Bracket | Male | Female |
| 5 to 17 Years | 3,011 (4.5%) | 1,920 (3.0%) |
| 18 to 34 Years | 4,656 (4.6%) | 4,875 (5.3%) |
| 35 to 64 Years | 5,701 (4.1%) | 4,639 (3.6%) |
| 65 to 74 Years | 1,471 (4.3%) | 1,272 (3.7%) |
| 75 Years and over | 2,001 (10.1%) | 2,529 (9.1%) |
Disability Class: Ambulatory Difficulty
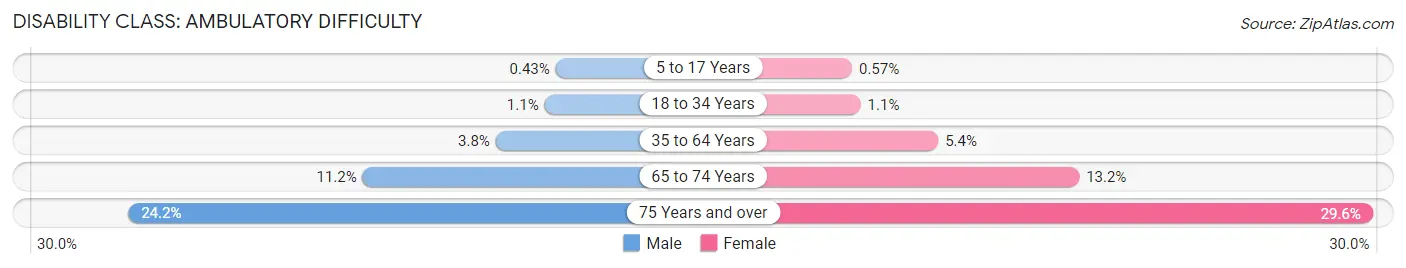
| Age Bracket | Male | Female |
| 5 to 17 Years | 289 (0.4%) | 364 (0.6%) |
| 18 to 34 Years | 1,067 (1.1%) | 969 (1.1%) |
| 35 to 64 Years | 5,222 (3.8%) | 6,887 (5.4%) |
| 65 to 74 Years | 3,865 (11.2%) | 4,543 (13.2%) |
| 75 Years and over | 4,797 (24.2%) | 8,176 (29.6%) |
Disability Class: Self-Care Difficulty
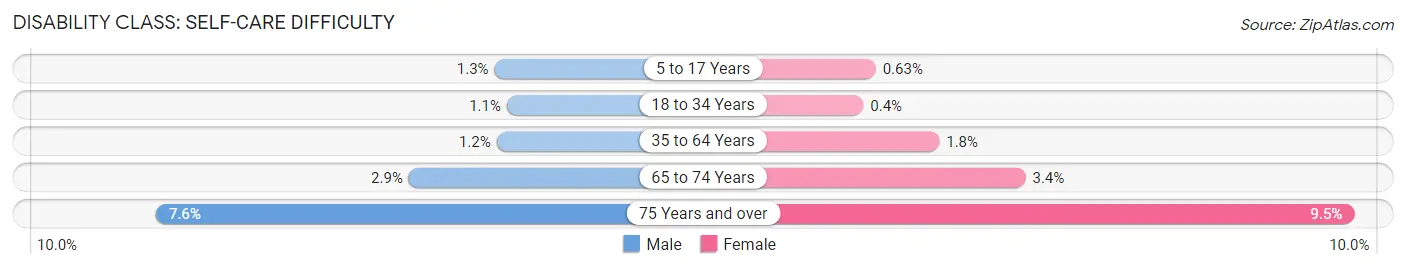
| Age Bracket | Male | Female |
| 5 to 17 Years | 860 (1.3%) | 400 (0.6%) |
| 18 to 34 Years | 1,065 (1.1%) | 373 (0.4%) |
| 35 to 64 Years | 1,714 (1.2%) | 2,323 (1.8%) |
| 65 to 74 Years | 992 (2.9%) | 1,172 (3.4%) |
| 75 Years and over | 1,497 (7.6%) | 2,631 (9.5%) |
Technology Access in North Dakota
Computing Device Access in North Dakota
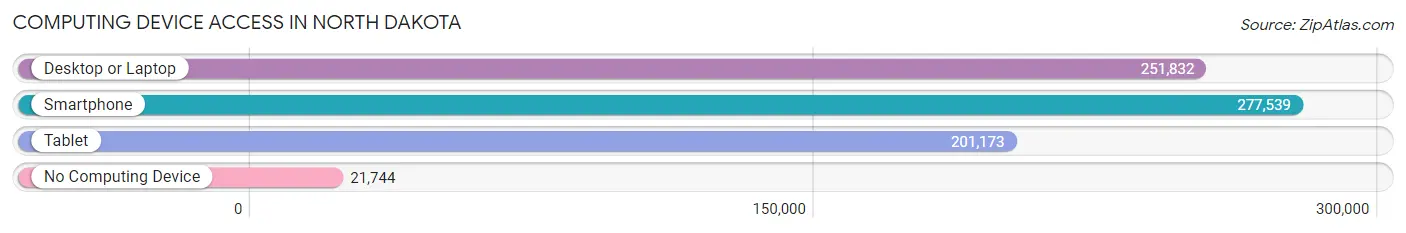
| Device Type | # Households | % Households |
| Desktop or Laptop | 251,832 | 78.7% |
| Smartphone | 277,539 | 86.7% |
| Tablet | 201,173 | 62.9% |
| No Computing Device | 21,744 | 6.8% |
| Total | 320,038 | 100.0% |
Internet Access in North Dakota
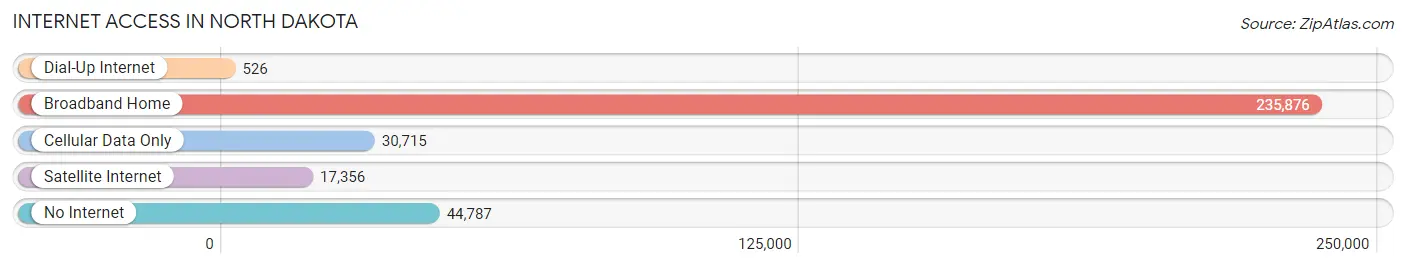
| Internet Type | # Households | % Households |
| Dial-Up Internet | 526 | 0.2% |
| Broadband Home | 235,876 | 73.7% |
| Cellular Data Only | 30,715 | 9.6% |
| Satellite Internet | 17,356 | 5.4% |
| No Internet | 44,787 | 14.0% |
| Total | 320,038 | 100.0% |
North Dakota Summary
North Dakota is a state located in the Midwestern and Northern regions of the United States. It is the 19th largest state by area, and the 4th least populous state. North Dakota was admitted to the Union on November 2, 1889, becoming the 39th state. The state is bordered by Minnesota to the east, South Dakota to the south, Montana to the west, and the Canadian provinces of Saskatchewan and Manitoba to the north.
Geography
North Dakota is located in the Upper Midwest region of the United States. It is bordered by Minnesota to the east, South Dakota to the south, Montana to the west, and the Canadian provinces of Saskatchewan and Manitoba to the north. The state has an area of 70,700 square miles, making it the 19th largest state in the United States. The state is divided into 53 counties and contains 1,844 townships. The state's capital is Bismarck, and its largest city is Fargo.
The geography of North Dakota is diverse, with the western half of the state being dominated by the Great Plains. The eastern half of the state is characterized by rolling hills and wooded areas. The Missouri River forms the western border of the state, and the Red River forms the eastern border. The state also contains several large lakes, including Lake Sakakawea, Lake Oahe, and Lake Audubon.
History
The area that is now North Dakota has been inhabited by various Native American tribes for thousands of years. The first Europeans to explore the area were French fur traders, who arrived in the late 17th century. The area was part of the Louisiana Purchase in 1803, and was later organized as part of the Dakota Territory in 1861.
In 1889, North Dakota was admitted to the Union as the 39th state. During the early 20th century, the state experienced a period of rapid growth and development, fueled by the discovery of oil and the development of the agricultural industry. The state also experienced a period of economic decline during the Great Depression, but recovered in the post-war years.
Economy
North Dakota has a diversified economy, with agriculture, energy, and tourism being the main industries. Agriculture is the largest sector of the state's economy, accounting for over 20% of the state's GDP. The state is a major producer of wheat, barley, oats, and other grains. Livestock production is also important, with cattle, hogs, and sheep being the main products.
The energy sector is also important to the state's economy, with oil and natural gas being the main sources of energy. The state is the second-largest producer of oil in the United States, and the fourth-largest producer of natural gas. The state also has a growing renewable energy sector, with wind and solar energy being the main sources.
Tourism is also an important part of the state's economy, with the state's national parks, monuments, and other attractions drawing millions of visitors each year. The state is also home to several major events, including the annual North Dakota State Fair and the annual Sturgis Motorcycle Rally.
Demographics
As of the 2020 census, North Dakota had a population of 762,062. The state has a population density of 10.7 people per square mile, making it the 4th least populous state in the United States. The state's population is predominantly white (90.2%), with Native Americans (5.2%), African Americans (2.2%), and Asians (1.3%) making up the remainder.
The median household income in North Dakota is $58,945, and the median family income is $71,845. The state's poverty rate is 11.2%, which is lower than the national average. The state's unemployment rate is 3.2%, which is lower than the national average.
Conclusion
North Dakota is a state located in the Midwestern and Northern regions of the United States. It is the 19th largest state by area, and the 4th least populous state. North Dakota was admitted to the Union on November 2, 1889, becoming the 39th state. The state is bordered by Minnesota to the east, South Dakota to the south, Montana to the west, and the Canadian provinces of Saskatchewan and Manitoba to the north. The geography of North Dakota is diverse, with the western half of the state being dominated by the Great Plains and the eastern half being characterized by rolling hills and wooded areas. The state has a diversified economy, with agriculture, energy, and tourism being the main industries. As of the 2020 census, North Dakota had a population of 762,062, with a population density of 10.7 people per square mile. The state's population is predominantly white, with Native Americans, African Americans, and Asians making up the remainder. The median household income in North Dakota is $58,945, and the median family income is $71,845. The state's poverty rate is 11.2%, and the unemployment rate is 3.2%.
Common Questions
When was North Dakota Incorporated?
North Dakota was Incorporated into the Union on Nov 2, 1889.
What is the Total Area of North Dakota?
Total Area of North Dakota is 70,698 Square Miles.
What is the Total Land Area of North Dakota?
Total Land Area of North Dakota is 69,001 Square Miles.
What is the Total Water Area of North Dakota?
Total Water Area of North Dakota is 1,697 Square Miles.
What is the Average Elevation in North Dakota?
Average Elevation in North Dakota is 1,900 Feet.
What is the Highest Elevation in North Dakota?
Highest Elevation in North Dakota is 3,506 Feet.
What is the Lowest Elevation in North Dakota?
Lowest Elevation in North Dakota is 750 Feet.
What is the Population Density in North Dakota?
Population Density in North Dakota is 11.3 People per Square Mile.
What is Per Capita Income in North Dakota?
Per Capita income in North Dakota is $40,748.
What is the Median Family Income in North Dakota?
Median Family Income in North Dakota is $100,188.
What is the Median Household income in North Dakota?
Median Household Income in North Dakota is $73,959.
What is Income or Wage Gap in North Dakota?
Income or Wage Gap in North Dakota is 30.5%.
Women in North Dakota earn 69.5 cents for every dollar earned by a man.
What is Family Income Deficit in North Dakota?
Family Income Deficit in North Dakota is $11,587.
Families that are below poverty line in North Dakota earn $11,587 less on average than the poverty threshold level.
What is Inequality or Gini Index in North Dakota?
Inequality or Gini Index in North Dakota is 0.45.
What is the Total Population of North Dakota?
Total Population of North Dakota is 776,874.
What is the Total Male Population of North Dakota?
Total Male Population of North Dakota is 399,345.
What is the Total Female Population of North Dakota?
Total Female Population of North Dakota is 377,529.
What is the Ratio of Males per 100 Females in North Dakota?
There are 105.78 Males per 100 Females in North Dakota.
What is the Ratio of Females per 100 Males in North Dakota?
There are 94.54 Females per 100 Males in North Dakota.
What is the Median Population Age in North Dakota?
Median Population Age in North Dakota is 35.4 Years.
What is the Average Family Size in North Dakota
Average Family Size in North Dakota is 3.0 People.
What is the Average Household Size in North Dakota
Average Household Size in North Dakota is 2.3 People.
How Large is the Labor Force in North Dakota?
There are 423,527 People in the Labor Forcein in North Dakota.
What is the Percentage of People in the Labor Force in North Dakota?
69.1% of People are in the Labor Force in North Dakota.
What is the Unemployment Rate in North Dakota?
Unemployment Rate in North Dakota is 2.9%.