Cities with the Highest Percentage of Bahamian Population in California
RELATED REPORTS & OPTIONS
Bahamian
California
Compare Cities
Map of Cities with the Highest Percentage of Bahamian Population in California
0.00%
0.40%
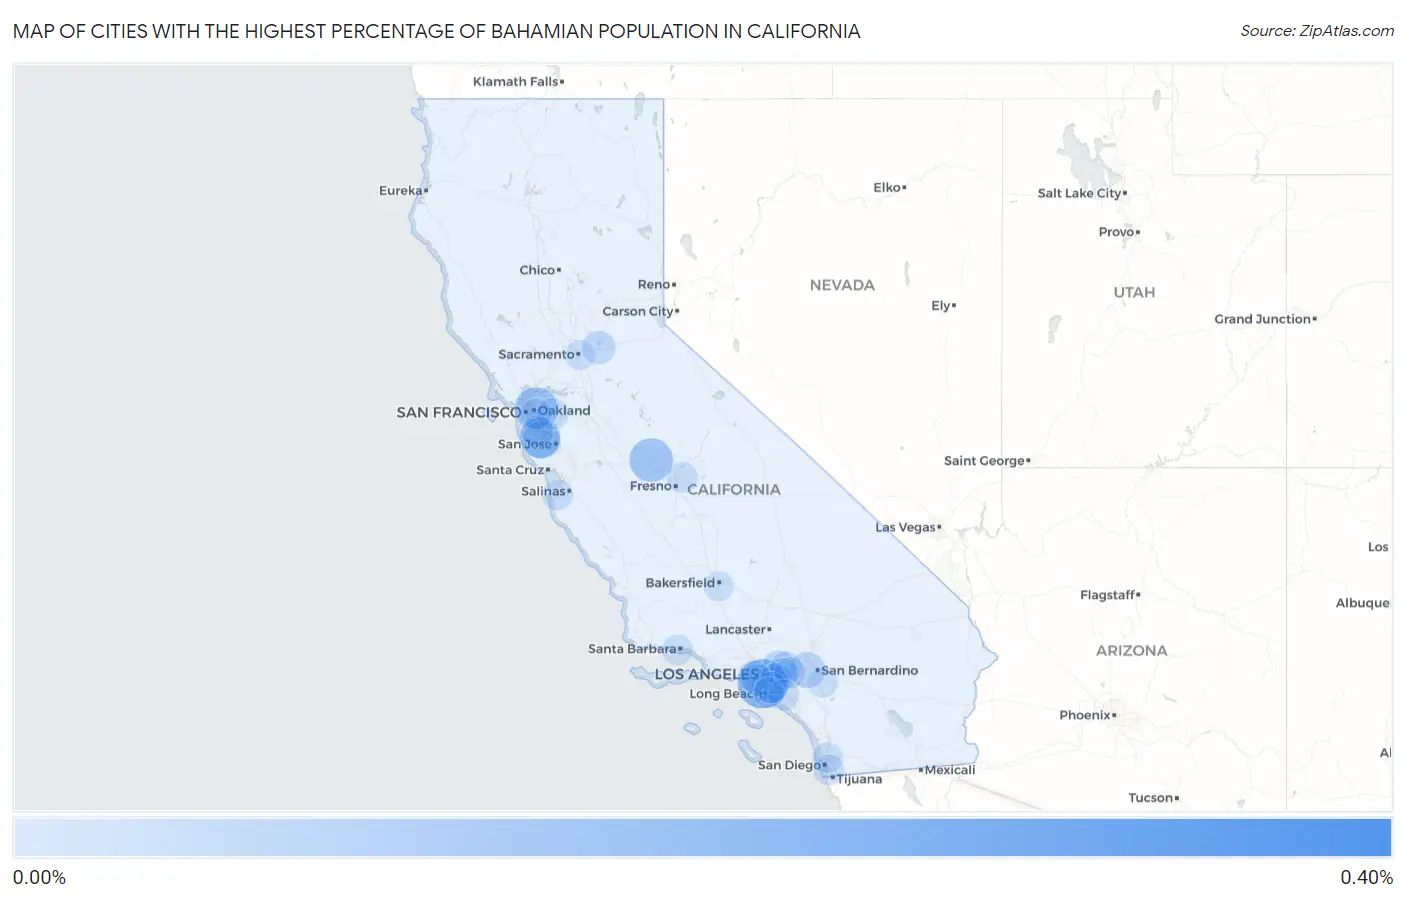
Cities with the Highest Percentage of Bahamian Population in California
| City | Bahamian | vs State | vs National | |
| 1. | Pepperdine University | 0.33% | 0.0027%(+0.326)#1 | 0.017%(+0.311)#133 |
| 2. | West Rancho Dominguez | 0.16% | 0.0027%(+0.160)#2 | 0.017%(+0.145)#217 |
| 3. | Chowchilla | 0.11% | 0.0027%(+0.109)#3 | 0.017%(+0.095)#280 |
| 4. | Piedmont | 0.11% | 0.0027%(+0.105)#4 | 0.017%(+0.090)#286 |
| 5. | Stanford | 0.087% | 0.0027%(+0.084)#5 | 0.017%(+0.070)#315 |
| 6. | Palo Alto | 0.063% | 0.0027%(+0.061)#6 | 0.017%(+0.046)#358 |
| 7. | Bellflower | 0.056% | 0.0027%(+0.053)#7 | 0.017%(+0.039)#372 |
| 8. | Fontana | 0.046% | 0.0027%(+0.044)#8 | 0.017%(+0.029)#391 |
| 9. | Monrovia | 0.032% | 0.0027%(+0.029)#9 | 0.017%(+0.015)#440 |
| 10. | Folsom | 0.027% | 0.0027%(+0.024)#10 | 0.017%(+0.010)#453 |
| 11. | Glendora | 0.015% | 0.0027%(+0.013)#11 | 0.017%(-0.002)#505 |
| 12. | San Ramon | 0.014% | 0.0027%(+0.011)#12 | 0.017%(-0.003)#517 |
| 13. | West Covina | 0.014% | 0.0027%(+0.011)#13 | 0.017%(-0.003)#518 |
| 14. | Redwood City | 0.013% | 0.0027%(+0.011)#14 | 0.017%(-0.004)#522 |
| 15. | Inglewood | 0.013% | 0.0027%(+0.010)#15 | 0.017%(-0.004)#523 |
| 16. | Whittier | 0.012% | 0.0027%(+0.009)#16 | 0.017%(-0.006)#533 |
| 17. | Los Angeles | 0.012% | 0.0027%(+0.009)#17 | 0.017%(-0.006)#535 |
| 18. | Lakewood | 0.011% | 0.0027%(+0.008)#18 | 0.017%(-0.006)#539 |
| 19. | Clovis | 0.0091% | 0.0027%(+0.006)#19 | 0.017%(-0.008)#557 |
| 20. | Pomona | 0.0087% | 0.0027%(+0.006)#20 | 0.017%(-0.008)#562 |
| 21. | Santa Ana | 0.0080% | 0.0027%(+0.005)#21 | 0.017%(-0.009)#567 |
| 22. | Monterey | 0.0067% | 0.0027%(+0.004)#22 | 0.017%(-0.010)#578 |
| 23. | Oakland | 0.0059% | 0.0027%(+0.003)#23 | 0.017%(-0.011)#581 |
| 24. | Long Beach | 0.0058% | 0.0027%(+0.003)#24 | 0.017%(-0.011)#582 |
| 25. | Santa Barbara | 0.0056% | 0.0027%(+0.003)#25 | 0.017%(-0.012)#586 |
| 26. | National City | 0.0053% | 0.0027%(+0.003)#26 | 0.017%(-0.012)#591 |
| 27. | San Diego | 0.0053% | 0.0027%(+0.003)#27 | 0.017%(-0.012)#593 |
| 28. | Moreno Valley | 0.0033% | 0.0027%(+0.001)#28 | 0.017%(-0.014)#609 |
| 29. | Sacramento | 0.0015% | 0.0027%(-0.001)#29 | 0.017%(-0.016)#619 |
| 30. | Bakersfield | 0.00099% | 0.0027%(-0.002)#30 | 0.017%(-0.016)#623 |
Common Questions
What are the Top 10 Cities with the Highest Percentage of Bahamian Population in California?
Top 10 Cities with the Highest Percentage of Bahamian Population in California are:
#1
0.16%
#2
0.11%
#3
0.11%
#4
0.087%
#5
0.063%
#6
0.056%
#7
0.046%
#8
0.032%
#9
0.027%
#10
0.015%
What city has the Highest Percentage of Bahamian Population in California?
West Rancho Dominguez has the Highest Percentage of Bahamian Population in California with 0.16%.
What is the Percentage of Bahamian Population in the State of California?
Percentage of Bahamian Population in California is 0.0027%.
What is the Percentage of Bahamian Population in the United States?
Percentage of Bahamian Population in the United States is 0.017%.