Cities with the Most Immigrants from India in California
RELATED REPORTS & OPTIONS
India
California
Compare Cities
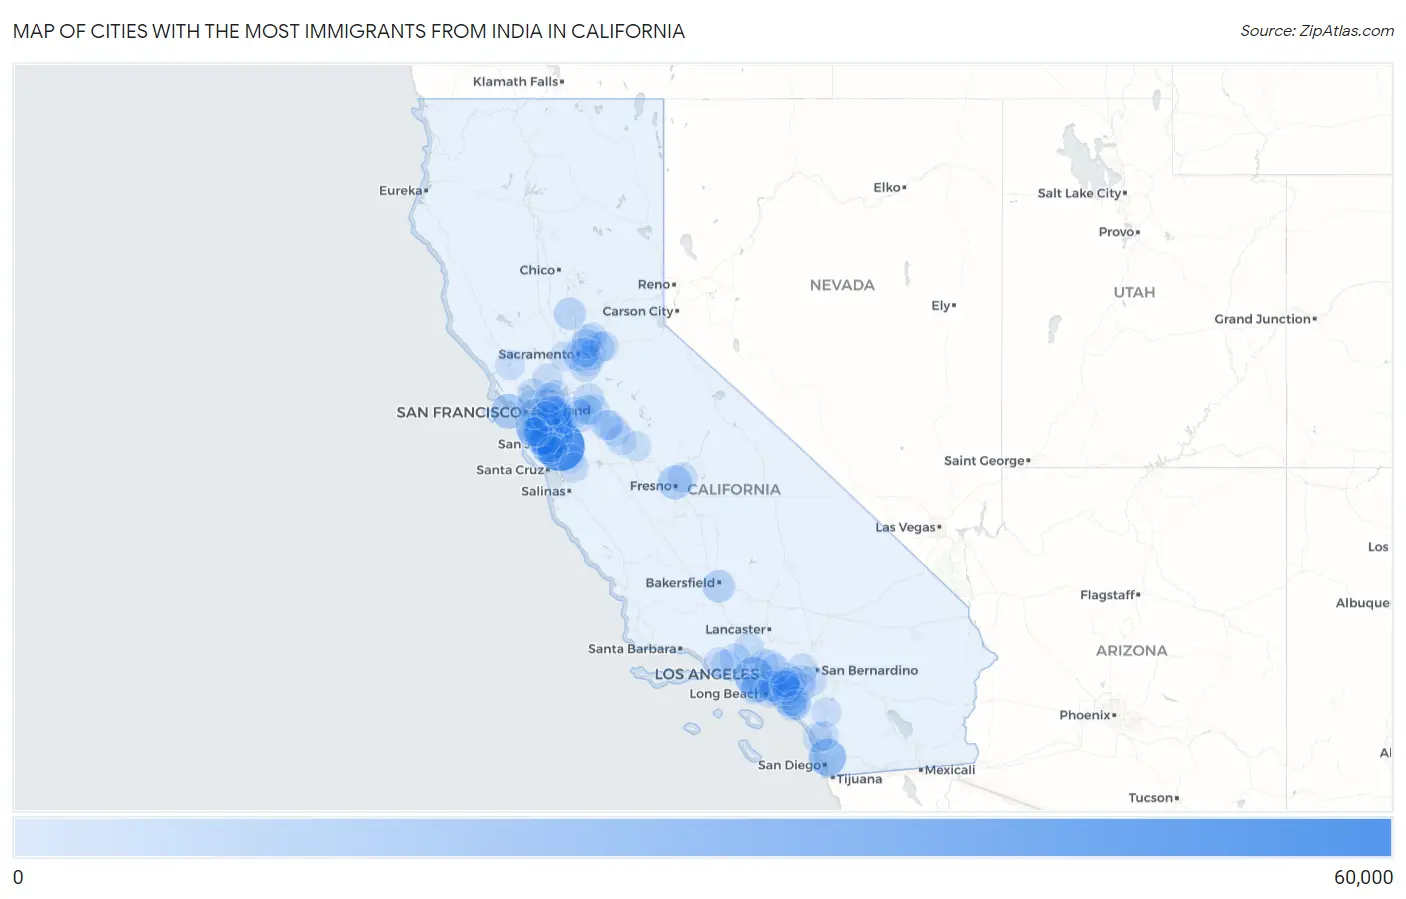
Map of Cities with the Most Immigrants from India in California
0
60,000
Cities with the Most Immigrants from India in California
| City | India | vs State | vs National | |
| 1. | San Jose | 52,443 | 539,184(9.73%)#1 | 2,732,526(1.92%)#2 |
| 2. | Fremont | 46,295 | 539,184(8.59%)#2 | 2,732,526(1.69%)#3 |
| 3. | Los Angeles | 22,337 | 539,184(4.14%)#3 | 2,732,526(0.82%)#9 |
| 4. | Sunnyvale | 21,850 | 539,184(4.05%)#4 | 2,732,526(0.80%)#10 |
| 5. | San Diego | 19,690 | 539,184(3.65%)#5 | 2,732,526(0.72%)#13 |
| 6. | Santa Clara | 17,536 | 539,184(3.25%)#6 | 2,732,526(0.64%)#14 |
| 7. | Milpitas | 13,458 | 539,184(2.50%)#7 | 2,732,526(0.49%)#20 |
| 8. | San Francisco | 12,831 | 539,184(2.38%)#8 | 2,732,526(0.47%)#21 |
| 9. | Irvine | 12,658 | 539,184(2.35%)#9 | 2,732,526(0.46%)#22 |
| 10. | San Ramon | 12,347 | 539,184(2.29%)#10 | 2,732,526(0.45%)#25 |
| 11. | Dublin | 11,860 | 539,184(2.20%)#11 | 2,732,526(0.43%)#28 |
| 12. | Cupertino | 11,853 | 539,184(2.20%)#12 | 2,732,526(0.43%)#29 |
| 13. | Fresno | 10,748 | 539,184(1.99%)#13 | 2,732,526(0.39%)#30 |
| 14. | Pleasanton | 10,726 | 539,184(1.99%)#14 | 2,732,526(0.39%)#31 |
| 15. | Sacramento | 7,951 | 539,184(1.47%)#15 | 2,732,526(0.29%)#39 |
| 16. | Bakersfield | 7,444 | 539,184(1.38%)#16 | 2,732,526(0.27%)#42 |
| 17. | Union City | 6,760 | 539,184(1.25%)#17 | 2,732,526(0.25%)#47 |
| 18. | Yuba City | 6,376 | 539,184(1.18%)#18 | 2,732,526(0.23%)#49 |
| 19. | Hayward | 5,177 | 539,184(0.96%)#19 | 2,732,526(0.19%)#60 |
| 20. | Mountain View | 5,087 | 539,184(0.94%)#20 | 2,732,526(0.19%)#63 |
| 21. | Tracy | 5,058 | 539,184(0.94%)#21 | 2,732,526(0.19%)#65 |
| 22. | Folsom | 4,883 | 539,184(0.91%)#22 | 2,732,526(0.18%)#67 |
| 23. | Mountain House | 4,281 | 539,184(0.79%)#23 | 2,732,526(0.16%)#76 |
| 24. | Newark | 4,183 | 539,184(0.78%)#24 | 2,732,526(0.15%)#77 |
| 25. | Elk Grove | 3,854 | 539,184(0.71%)#25 | 2,732,526(0.14%)#86 |
| 26. | Torrance | 3,724 | 539,184(0.69%)#26 | 2,732,526(0.14%)#90 |
| 27. | Livermore | 3,613 | 539,184(0.67%)#27 | 2,732,526(0.13%)#93 |
| 28. | Foster City | 3,589 | 539,184(0.67%)#28 | 2,732,526(0.13%)#95 |
| 29. | Manteca | 3,312 | 539,184(0.61%)#29 | 2,732,526(0.12%)#111 |
| 30. | Stockton | 3,281 | 539,184(0.61%)#30 | 2,732,526(0.12%)#112 |
| 31. | Anaheim | 3,251 | 539,184(0.60%)#31 | 2,732,526(0.12%)#116 |
| 32. | Saratoga | 3,007 | 539,184(0.56%)#32 | 2,732,526(0.11%)#131 |
| 33. | San Mateo | 2,883 | 539,184(0.53%)#33 | 2,732,526(0.11%)#136 |
| 34. | Roseville | 2,593 | 539,184(0.48%)#34 | 2,732,526(0.09%)#151 |
| 35. | Santa Clarita | 2,549 | 539,184(0.47%)#35 | 2,732,526(0.09%)#156 |
| 36. | Cerritos | 2,540 | 539,184(0.47%)#36 | 2,732,526(0.09%)#158 |
| 37. | Palo Alto | 2,523 | 539,184(0.47%)#37 | 2,732,526(0.09%)#159 |
| 38. | Oakland | 2,506 | 539,184(0.46%)#38 | 2,732,526(0.09%)#162 |
| 39. | Simi Valley | 2,387 | 539,184(0.44%)#39 | 2,732,526(0.09%)#169 |
| 40. | Berkeley | 2,354 | 539,184(0.44%)#40 | 2,732,526(0.09%)#170 |
| 41. | Livingston | 2,119 | 539,184(0.39%)#41 | 2,732,526(0.08%)#187 |
| 42. | Tustin | 2,108 | 539,184(0.39%)#42 | 2,732,526(0.08%)#188 |
| 43. | Vineyard | 2,012 | 539,184(0.37%)#43 | 2,732,526(0.07%)#195 |
| 44. | Riverside | 1,999 | 539,184(0.37%)#44 | 2,732,526(0.07%)#196 |
| 45. | Los Altos | 1,949 | 539,184(0.36%)#45 | 2,732,526(0.07%)#203 |
| 46. | Campbell | 1,902 | 539,184(0.35%)#46 | 2,732,526(0.07%)#208 |
| 47. | Thousand Oaks | 1,890 | 539,184(0.35%)#47 | 2,732,526(0.07%)#210 |
| 48. | Fullerton | 1,848 | 539,184(0.34%)#48 | 2,732,526(0.07%)#214 |
| 49. | Rancho Cucamonga | 1,761 | 539,184(0.33%)#49 | 2,732,526(0.06%)#221 |
| 50. | Clovis | 1,692 | 539,184(0.31%)#50 | 2,732,526(0.06%)#232 |
| 51. | Modesto | 1,684 | 539,184(0.31%)#51 | 2,732,526(0.06%)#233 |
| 52. | Rancho Cordova | 1,675 | 539,184(0.31%)#52 | 2,732,526(0.06%)#235 |
| 53. | Buena Park | 1,652 | 539,184(0.31%)#53 | 2,732,526(0.06%)#241 |
| 54. | Cypress | 1,613 | 539,184(0.30%)#54 | 2,732,526(0.06%)#249 |
| 55. | Lathrop | 1,604 | 539,184(0.30%)#55 | 2,732,526(0.06%)#251 |
| 56. | Eastvale | 1,546 | 539,184(0.29%)#56 | 2,732,526(0.06%)#261 |
| 57. | Hercules | 1,526 | 539,184(0.28%)#57 | 2,732,526(0.06%)#266 |
| 58. | Artesia | 1,525 | 539,184(0.28%)#58 | 2,732,526(0.06%)#267 |
| 59. | Fairfield | 1,462 | 539,184(0.27%)#59 | 2,732,526(0.05%)#274 |
| 60. | Turlock | 1,388 | 539,184(0.26%)#60 | 2,732,526(0.05%)#287 |
| 61. | Belmont | 1,336 | 539,184(0.25%)#61 | 2,732,526(0.05%)#301 |
| 62. | Redwood City | 1,327 | 539,184(0.25%)#62 | 2,732,526(0.05%)#305 |
| 63. | Walnut Creek | 1,304 | 539,184(0.24%)#63 | 2,732,526(0.05%)#310 |
| 64. | Long Beach | 1,248 | 539,184(0.23%)#64 | 2,732,526(0.05%)#325 |
| 65. | Yorba Linda | 1,226 | 539,184(0.23%)#65 | 2,732,526(0.04%)#327 |
| 66. | Corona | 1,208 | 539,184(0.22%)#66 | 2,732,526(0.04%)#332 |
| 67. | Pasadena | 1,193 | 539,184(0.22%)#67 | 2,732,526(0.04%)#334 |
| 68. | Ceres | 1,174 | 539,184(0.22%)#68 | 2,732,526(0.04%)#337 |
| 69. | Diamond Bar | 1,171 | 539,184(0.22%)#69 | 2,732,526(0.04%)#338 |
| 70. | Camino Tassajara | 1,116 | 539,184(0.21%)#70 | 2,732,526(0.04%)#354 |
| 71. | Rocklin | 1,095 | 539,184(0.20%)#71 | 2,732,526(0.04%)#361 |
| 72. | Antelope | 1,034 | 539,184(0.19%)#72 | 2,732,526(0.04%)#379 |
| 73. | El Dorado Hills | 1,028 | 539,184(0.19%)#73 | 2,732,526(0.04%)#384 |
| 74. | Lake Forest | 1,026 | 539,184(0.19%)#74 | 2,732,526(0.04%)#387 |
| 75. | Chino Hills | 990 | 539,184(0.18%)#75 | 2,732,526(0.04%)#402 |
| 76. | Pittsburg | 970 | 539,184(0.18%)#76 | 2,732,526(0.04%)#405 |
| 77. | Carlsbad | 966 | 539,184(0.18%)#77 | 2,732,526(0.04%)#407 |
| 78. | Alameda | 964 | 539,184(0.18%)#78 | 2,732,526(0.04%)#408 |
| 79. | Santa Rosa | 963 | 539,184(0.18%)#79 | 2,732,526(0.04%)#409 |
| 80. | Danville | 962 | 539,184(0.18%)#80 | 2,732,526(0.04%)#410 |
| 81. | Morgan Hill | 952 | 539,184(0.18%)#81 | 2,732,526(0.03%)#414 |
| 82. | Concord | 947 | 539,184(0.18%)#82 | 2,732,526(0.03%)#415 |
| 83. | Glendale | 936 | 539,184(0.17%)#83 | 2,732,526(0.03%)#420 |
| 84. | Orange | 922 | 539,184(0.17%)#84 | 2,732,526(0.03%)#428 |
| 85. | San Marcos | 913 | 539,184(0.17%)#85 | 2,732,526(0.03%)#431 |
| 86. | Aliso Viejo | 907 | 539,184(0.17%)#86 | 2,732,526(0.03%)#434 |
| 87. | Castro Valley | 906 | 539,184(0.17%)#87 | 2,732,526(0.03%)#436 |
| 88. | Arcadia | 905 | 539,184(0.17%)#88 | 2,732,526(0.03%)#437 |
| 89. | Temecula | 902 | 539,184(0.17%)#89 | 2,732,526(0.03%)#439 |
| 90. | Mission Viejo | 902 | 539,184(0.17%)#90 | 2,732,526(0.03%)#440 |
| 91. | Camarillo | 878 | 539,184(0.16%)#91 | 2,732,526(0.03%)#452 |
| 92. | Davis | 864 | 539,184(0.16%)#92 | 2,732,526(0.03%)#461 |
| 93. | Los Gatos | 835 | 539,184(0.15%)#93 | 2,732,526(0.03%)#477 |
| 94. | Gilroy | 831 | 539,184(0.15%)#94 | 2,732,526(0.03%)#480 |
| 95. | Redondo Beach | 809 | 539,184(0.15%)#95 | 2,732,526(0.03%)#497 |
| 96. | San Carlos | 797 | 539,184(0.15%)#96 | 2,732,526(0.03%)#501 |
| 97. | Placentia | 795 | 539,184(0.15%)#97 | 2,732,526(0.03%)#503 |
| 98. | Merced | 787 | 539,184(0.15%)#98 | 2,732,526(0.03%)#509 |
| 99. | Arden Arcade | 735 | 539,184(0.14%)#99 | 2,732,526(0.03%)#547 |
| 100. | Brea | 734 | 539,184(0.14%)#100 | 2,732,526(0.03%)#550 |
Common Questions
What are the Top 10 Cities with the Most Immigrants from India in California?
Top 10 Cities with the Most Immigrants from India in California are:
#1
52,443
#2
46,295
#3
22,337
#4
21,850
#5
19,690
#6
17,536
#7
13,458
#8
12,831
#9
12,658
#10
12,347
What city has the Most Immigrants from India in California?
San Jose has the Most Immigrants from India in California with 52,443.
What is the Total Immigrants from India in the State of California?
Total Immigrants from India in California is 539,184.
What is the Total Immigrants from India in the United States?
Total Immigrants from India in the United States is 2,732,526.