Cities with the Most Immigrants from Lebanon in California
RELATED REPORTS & OPTIONS
Lebanon
California
Compare Cities
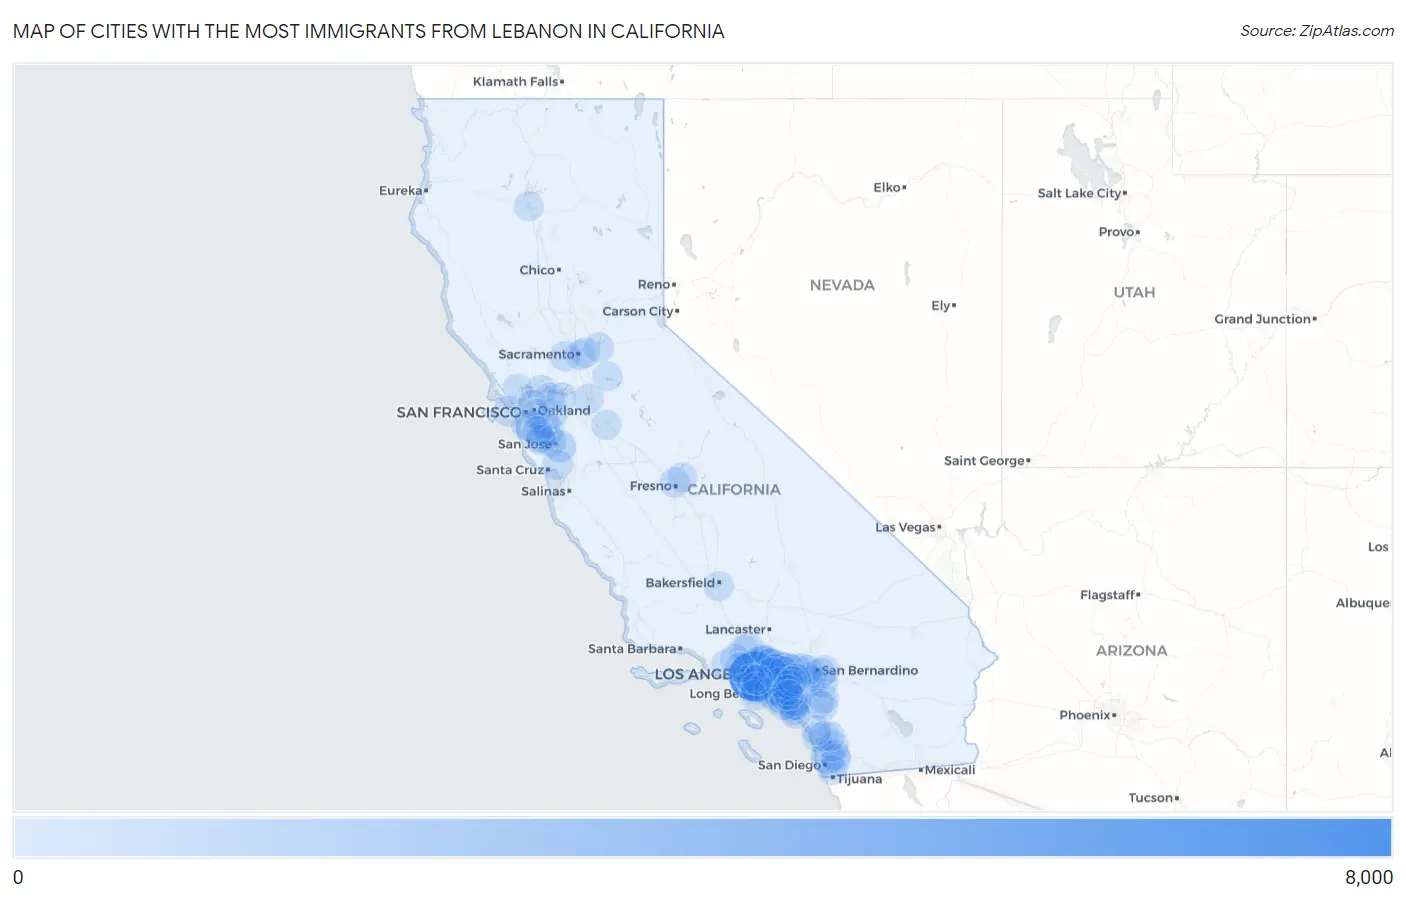
Map of Cities with the Most Immigrants from Lebanon in California
0
8,000
Cities with the Most Immigrants from Lebanon in California
| City | Lebanon | vs State | vs National | |
| 1. | Los Angeles | 6,180 | 31,757(19.46%)#1 | 133,021(4.65%)#3 |
| 2. | Glendale | 2,456 | 31,757(7.73%)#2 | 133,021(1.85%)#5 |
| 3. | San Diego | 1,149 | 31,757(3.62%)#3 | 133,021(0.86%)#7 |
| 4. | Pasadena | 832 | 31,757(2.62%)#4 | 133,021(0.63%)#8 |
| 5. | San Jose | 730 | 31,757(2.30%)#5 | 133,021(0.55%)#11 |
| 6. | Irvine | 508 | 31,757(1.60%)#6 | 133,021(0.38%)#20 |
| 7. | Loma Linda | 480 | 31,757(1.51%)#7 | 133,021(0.36%)#22 |
| 8. | Bell | 461 | 31,757(1.45%)#8 | 133,021(0.35%)#23 |
| 9. | Anaheim | 458 | 31,757(1.44%)#9 | 133,021(0.34%)#24 |
| 10. | Altadena | 438 | 31,757(1.38%)#10 | 133,021(0.33%)#26 |
| 11. | Torrance | 403 | 31,757(1.27%)#11 | 133,021(0.30%)#30 |
| 12. | San Francisco | 371 | 31,757(1.17%)#12 | 133,021(0.28%)#32 |
| 13. | Santa Clarita | 366 | 31,757(1.15%)#13 | 133,021(0.28%)#33 |
| 14. | Aliso Viejo | 340 | 31,757(1.07%)#14 | 133,021(0.26%)#39 |
| 15. | Corona | 315 | 31,757(0.99%)#15 | 133,021(0.24%)#43 |
| 16. | Fullerton | 294 | 31,757(0.93%)#16 | 133,021(0.22%)#51 |
| 17. | Fremont | 293 | 31,757(0.92%)#17 | 133,021(0.22%)#52 |
| 18. | Santa Clara | 272 | 31,757(0.86%)#18 | 133,021(0.20%)#61 |
| 19. | Glendora | 256 | 31,757(0.81%)#19 | 133,021(0.19%)#65 |
| 20. | Fresno | 249 | 31,757(0.78%)#20 | 133,021(0.19%)#67 |
| 21. | Rancho Cucamonga | 237 | 31,757(0.75%)#21 | 133,021(0.18%)#73 |
| 22. | Rancho Palos Verdes | 232 | 31,757(0.73%)#22 | 133,021(0.17%)#77 |
| 23. | Stanton | 218 | 31,757(0.69%)#23 | 133,021(0.16%)#81 |
| 24. | San Mateo | 214 | 31,757(0.67%)#24 | 133,021(0.16%)#84 |
| 25. | Santee | 193 | 31,757(0.61%)#25 | 133,021(0.15%)#92 |
| 26. | Downey | 187 | 31,757(0.59%)#26 | 133,021(0.14%)#96 |
| 27. | Riverside | 181 | 31,757(0.57%)#27 | 133,021(0.14%)#99 |
| 28. | Novato | 181 | 31,757(0.57%)#28 | 133,021(0.14%)#101 |
| 29. | Santa Monica | 180 | 31,757(0.57%)#29 | 133,021(0.14%)#102 |
| 30. | Day Valley | 180 | 31,757(0.57%)#30 | 133,021(0.14%)#103 |
| 31. | Placentia | 176 | 31,757(0.55%)#31 | 133,021(0.13%)#107 |
| 32. | La Crescenta Montrose | 173 | 31,757(0.54%)#32 | 133,021(0.13%)#110 |
| 33. | Diamond Bar | 172 | 31,757(0.54%)#33 | 133,021(0.13%)#111 |
| 34. | Davis | 167 | 31,757(0.53%)#34 | 133,021(0.13%)#114 |
| 35. | Cypress | 164 | 31,757(0.52%)#35 | 133,021(0.12%)#117 |
| 36. | Duarte | 164 | 31,757(0.52%)#36 | 133,021(0.12%)#118 |
| 37. | Azusa | 163 | 31,757(0.51%)#37 | 133,021(0.12%)#119 |
| 38. | El Sobrante Cdp Riverside County | 160 | 31,757(0.50%)#38 | 133,021(0.12%)#122 |
| 39. | Murrieta | 153 | 31,757(0.48%)#39 | 133,021(0.12%)#124 |
| 40. | Mission Viejo | 152 | 31,757(0.48%)#40 | 133,021(0.11%)#126 |
| 41. | San Ramon | 148 | 31,757(0.47%)#41 | 133,021(0.11%)#129 |
| 42. | Modesto | 142 | 31,757(0.45%)#42 | 133,021(0.11%)#132 |
| 43. | Sacramento | 138 | 31,757(0.43%)#43 | 133,021(0.10%)#136 |
| 44. | Long Beach | 136 | 31,757(0.43%)#44 | 133,021(0.10%)#141 |
| 45. | Arden Arcade | 134 | 31,757(0.42%)#45 | 133,021(0.10%)#143 |
| 46. | Arcadia | 134 | 31,757(0.42%)#46 | 133,021(0.10%)#144 |
| 47. | Poway | 133 | 31,757(0.42%)#47 | 133,021(0.10%)#145 |
| 48. | Clovis | 131 | 31,757(0.41%)#48 | 133,021(0.10%)#147 |
| 49. | Moreno Valley | 128 | 31,757(0.40%)#49 | 133,021(0.10%)#150 |
| 50. | Thousand Oaks | 127 | 31,757(0.40%)#50 | 133,021(0.10%)#153 |
| 51. | Stevenson Ranch | 121 | 31,757(0.38%)#51 | 133,021(0.09%)#163 |
| 52. | Fountain Valley | 113 | 31,757(0.36%)#52 | 133,021(0.08%)#168 |
| 53. | Upland | 108 | 31,757(0.34%)#53 | 133,021(0.08%)#179 |
| 54. | Marina Del Rey | 107 | 31,757(0.34%)#54 | 133,021(0.08%)#181 |
| 55. | Menifee | 106 | 31,757(0.33%)#55 | 133,021(0.08%)#182 |
| 56. | Redondo Beach | 104 | 31,757(0.33%)#56 | 133,021(0.08%)#188 |
| 57. | Huntington Beach | 101 | 31,757(0.32%)#57 | 133,021(0.08%)#193 |
| 58. | Simi Valley | 99 | 31,757(0.31%)#58 | 133,021(0.07%)#196 |
| 59. | Stockton | 98 | 31,757(0.31%)#59 | 133,021(0.07%)#201 |
| 60. | Camanche Village | 98 | 31,757(0.31%)#60 | 133,021(0.07%)#206 |
| 61. | Laguna Niguel | 96 | 31,757(0.30%)#61 | 133,021(0.07%)#207 |
| 62. | La Verne | 96 | 31,757(0.30%)#62 | 133,021(0.07%)#209 |
| 63. | Covina | 95 | 31,757(0.30%)#63 | 133,021(0.07%)#212 |
| 64. | Wildomar | 95 | 31,757(0.30%)#64 | 133,021(0.07%)#213 |
| 65. | Laguna Hills | 94 | 31,757(0.30%)#65 | 133,021(0.07%)#216 |
| 66. | Calabasas | 93 | 31,757(0.29%)#66 | 133,021(0.07%)#219 |
| 67. | Millbrae | 92 | 31,757(0.29%)#67 | 133,021(0.07%)#222 |
| 68. | Jurupa Valley | 91 | 31,757(0.29%)#68 | 133,021(0.07%)#223 |
| 69. | Santa Ana | 89 | 31,757(0.28%)#69 | 133,021(0.07%)#227 |
| 70. | Carlsbad | 89 | 31,757(0.28%)#70 | 133,021(0.07%)#229 |
| 71. | Benicia | 89 | 31,757(0.28%)#71 | 133,021(0.07%)#232 |
| 72. | Fontana | 88 | 31,757(0.28%)#72 | 133,021(0.07%)#234 |
| 73. | Stanford | 86 | 31,757(0.27%)#73 | 133,021(0.06%)#239 |
| 74. | Hayward | 85 | 31,757(0.27%)#74 | 133,021(0.06%)#240 |
| 75. | Berkeley | 85 | 31,757(0.27%)#75 | 133,021(0.06%)#241 |
| 76. | San Marcos | 85 | 31,757(0.27%)#76 | 133,021(0.06%)#243 |
| 77. | La Habra | 84 | 31,757(0.26%)#77 | 133,021(0.06%)#250 |
| 78. | Folsom | 83 | 31,757(0.26%)#78 | 133,021(0.06%)#252 |
| 79. | Lake Forest | 81 | 31,757(0.26%)#79 | 133,021(0.06%)#255 |
| 80. | Concord | 79 | 31,757(0.25%)#80 | 133,021(0.06%)#260 |
| 81. | Chino | 78 | 31,757(0.25%)#81 | 133,021(0.06%)#266 |
| 82. | Rosemead | 78 | 31,757(0.25%)#82 | 133,021(0.06%)#268 |
| 83. | Highland | 77 | 31,757(0.24%)#83 | 133,021(0.06%)#272 |
| 84. | Oakland | 76 | 31,757(0.24%)#84 | 133,021(0.06%)#274 |
| 85. | Chula Vista | 76 | 31,757(0.24%)#85 | 133,021(0.06%)#275 |
| 86. | Newport Beach | 75 | 31,757(0.24%)#86 | 133,021(0.06%)#282 |
| 87. | Yorba Linda | 75 | 31,757(0.24%)#87 | 133,021(0.06%)#284 |
| 88. | El Cajon | 74 | 31,757(0.23%)#88 | 133,021(0.06%)#291 |
| 89. | Antioch | 73 | 31,757(0.23%)#89 | 133,021(0.05%)#293 |
| 90. | Palo Alto | 72 | 31,757(0.23%)#90 | 133,021(0.05%)#298 |
| 91. | Redwood City | 71 | 31,757(0.22%)#91 | 133,021(0.05%)#301 |
| 92. | Chino Hills | 69 | 31,757(0.22%)#92 | 133,021(0.05%)#309 |
| 93. | Orange | 68 | 31,757(0.21%)#93 | 133,021(0.05%)#314 |
| 94. | Escondido | 67 | 31,757(0.21%)#94 | 133,021(0.05%)#317 |
| 95. | Dana Point | 66 | 31,757(0.21%)#95 | 133,021(0.05%)#321 |
| 96. | Bakersfield | 65 | 31,757(0.20%)#96 | 133,021(0.05%)#322 |
| 97. | Oceanside | 65 | 31,757(0.20%)#97 | 133,021(0.05%)#323 |
| 98. | Inglewood | 65 | 31,757(0.20%)#98 | 133,021(0.05%)#325 |
| 99. | Tustin | 65 | 31,757(0.20%)#99 | 133,021(0.05%)#326 |
| 100. | Redding | 64 | 31,757(0.20%)#100 | 133,021(0.05%)#333 |
Common Questions
What are the Top 10 Cities with the Most Immigrants from Lebanon in California?
Top 10 Cities with the Most Immigrants from Lebanon in California are:
#1
6,180
#2
2,456
#3
1,149
#4
832
#5
730
#6
508
#7
480
#8
461
#9
458
#10
438
What city has the Most Immigrants from Lebanon in California?
Los Angeles has the Most Immigrants from Lebanon in California with 6,180.
What is the Total Immigrants from Lebanon in the State of California?
Total Immigrants from Lebanon in California is 31,757.
What is the Total Immigrants from Lebanon in the United States?
Total Immigrants from Lebanon in the United States is 133,021.