Cities with the Most Immigrants from Korea in California
RELATED REPORTS & OPTIONS
Korea
California
Compare Cities
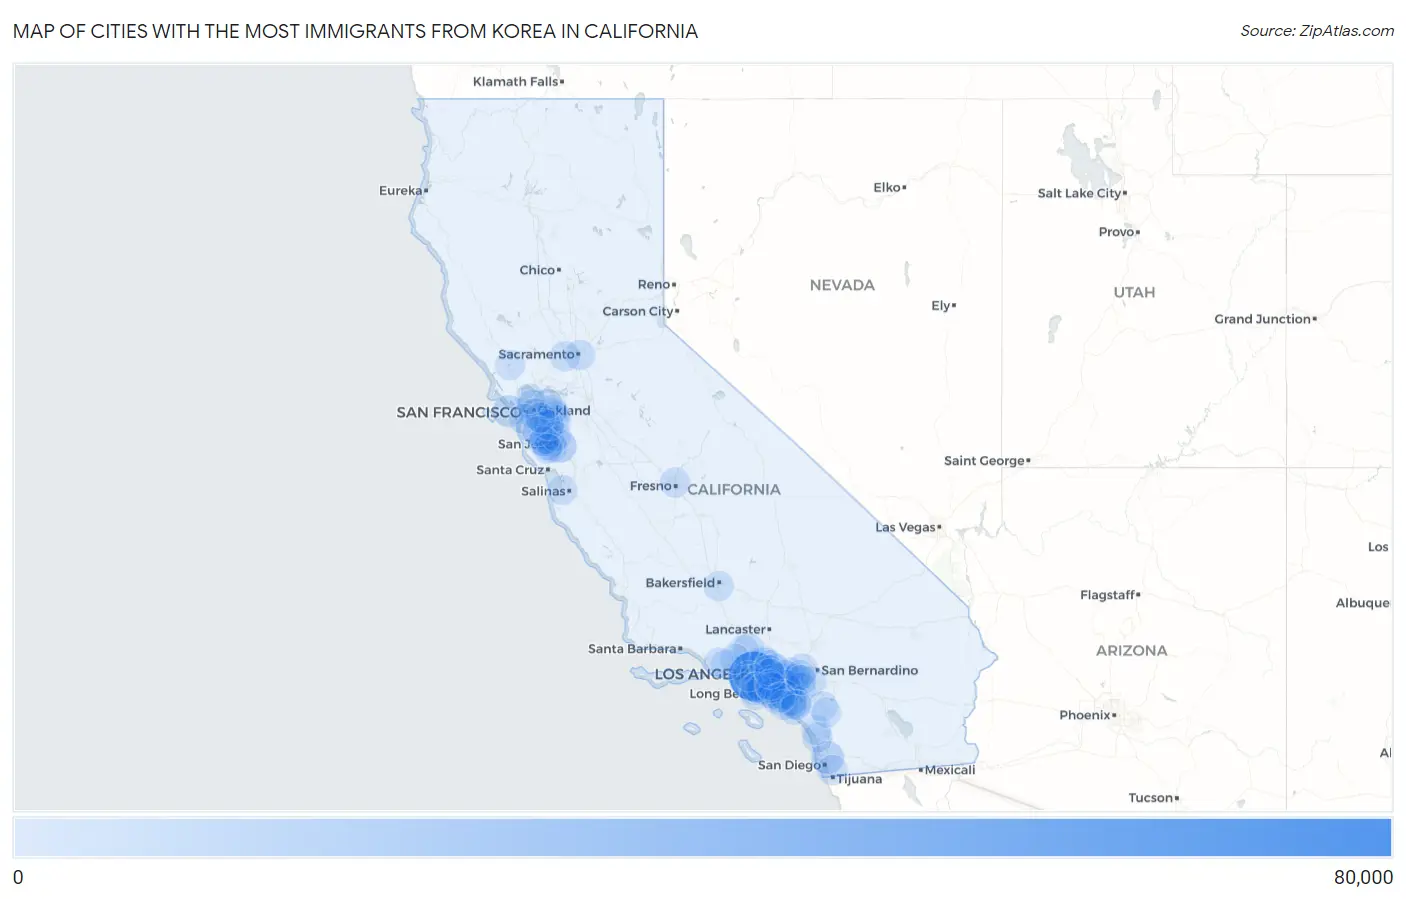
Map of Cities with the Most Immigrants from Korea in California
0
80,000
Cities with the Most Immigrants from Korea in California
| City | Korea | vs State | vs National | |
| 1. | Los Angeles | 72,278 | 315,248(22.93%)#1 | 1,034,299(6.99%)#1 |
| 2. | Irvine | 13,665 | 315,248(4.33%)#2 | 1,034,299(1.32%)#3 |
| 3. | Fullerton | 10,956 | 315,248(3.48%)#3 | 1,034,299(1.06%)#4 |
| 4. | San Jose | 10,848 | 315,248(3.44%)#4 | 1,034,299(1.05%)#5 |
| 5. | San Diego | 9,638 | 315,248(3.06%)#5 | 1,034,299(0.93%)#6 |
| 6. | Torrance | 7,176 | 315,248(2.28%)#6 | 1,034,299(0.69%)#10 |
| 7. | Buena Park | 6,779 | 315,248(2.15%)#7 | 1,034,299(0.66%)#12 |
| 8. | San Francisco | 6,705 | 315,248(2.13%)#8 | 1,034,299(0.65%)#13 |
| 9. | Anaheim | 4,604 | 315,248(1.46%)#9 | 1,034,299(0.45%)#17 |
| 10. | Glendale | 4,358 | 315,248(1.38%)#10 | 1,034,299(0.42%)#19 |
| 11. | Cypress | 4,268 | 315,248(1.35%)#11 | 1,034,299(0.41%)#20 |
| 12. | Cerritos | 3,884 | 315,248(1.23%)#12 | 1,034,299(0.38%)#23 |
| 13. | La Mirada | 3,881 | 315,248(1.23%)#13 | 1,034,299(0.38%)#24 |
| 14. | Diamond Bar | 3,670 | 315,248(1.16%)#14 | 1,034,299(0.35%)#25 |
| 15. | Garden Grove | 3,369 | 315,248(1.07%)#15 | 1,034,299(0.33%)#28 |
| 16. | Brea | 2,947 | 315,248(0.93%)#16 | 1,034,299(0.28%)#30 |
| 17. | Santa Clara | 2,451 | 315,248(0.78%)#17 | 1,034,299(0.24%)#40 |
| 18. | Gardena | 2,440 | 315,248(0.77%)#18 | 1,034,299(0.24%)#41 |
| 19. | Sunnyvale | 2,436 | 315,248(0.77%)#19 | 1,034,299(0.24%)#42 |
| 20. | Chino Hills | 2,251 | 315,248(0.71%)#20 | 1,034,299(0.22%)#48 |
| 21. | San Ramon | 2,244 | 315,248(0.71%)#21 | 1,034,299(0.22%)#49 |
| 22. | Fremont | 2,100 | 315,248(0.67%)#22 | 1,034,299(0.20%)#53 |
| 23. | La Habra | 2,060 | 315,248(0.65%)#23 | 1,034,299(0.20%)#56 |
| 24. | La Crescenta Montrose | 1,963 | 315,248(0.62%)#24 | 1,034,299(0.19%)#60 |
| 25. | Santa Clarita | 1,902 | 315,248(0.60%)#25 | 1,034,299(0.18%)#64 |
| 26. | Tustin | 1,889 | 315,248(0.60%)#26 | 1,034,299(0.18%)#65 |
| 27. | Rowland Heights | 1,852 | 315,248(0.59%)#27 | 1,034,299(0.18%)#67 |
| 28. | Long Beach | 1,686 | 315,248(0.53%)#28 | 1,034,299(0.16%)#74 |
| 29. | Oakland | 1,674 | 315,248(0.53%)#29 | 1,034,299(0.16%)#76 |
| 30. | Yorba Linda | 1,611 | 315,248(0.51%)#30 | 1,034,299(0.16%)#79 |
| 31. | La Canada Flintridge | 1,608 | 315,248(0.51%)#31 | 1,034,299(0.16%)#80 |
| 32. | Rancho Cucamonga | 1,535 | 315,248(0.49%)#32 | 1,034,299(0.15%)#85 |
| 33. | Pasadena | 1,486 | 315,248(0.47%)#33 | 1,034,299(0.14%)#88 |
| 34. | Rancho Palos Verdes | 1,486 | 315,248(0.47%)#34 | 1,034,299(0.14%)#89 |
| 35. | Cupertino | 1,485 | 315,248(0.47%)#35 | 1,034,299(0.14%)#90 |
| 36. | Pomona | 1,482 | 315,248(0.47%)#36 | 1,034,299(0.14%)#91 |
| 37. | Berkeley | 1,471 | 315,248(0.47%)#37 | 1,034,299(0.14%)#92 |
| 38. | Pleasanton | 1,457 | 315,248(0.46%)#38 | 1,034,299(0.14%)#93 |
| 39. | Riverside | 1,380 | 315,248(0.44%)#39 | 1,034,299(0.13%)#98 |
| 40. | Downey | 1,325 | 315,248(0.42%)#40 | 1,034,299(0.13%)#102 |
| 41. | Palo Alto | 1,315 | 315,248(0.42%)#41 | 1,034,299(0.13%)#104 |
| 42. | Chula Vista | 1,280 | 315,248(0.41%)#42 | 1,034,299(0.12%)#110 |
| 43. | Orange | 1,268 | 315,248(0.40%)#43 | 1,034,299(0.12%)#112 |
| 44. | Stevenson Ranch | 1,216 | 315,248(0.39%)#44 | 1,034,299(0.12%)#115 |
| 45. | Norwalk | 1,206 | 315,248(0.38%)#45 | 1,034,299(0.12%)#116 |
| 46. | Dublin | 1,189 | 315,248(0.38%)#46 | 1,034,299(0.11%)#117 |
| 47. | La Palma | 1,189 | 315,248(0.38%)#47 | 1,034,299(0.11%)#118 |
| 48. | West Carson | 1,178 | 315,248(0.37%)#48 | 1,034,299(0.11%)#120 |
| 49. | Chino | 1,156 | 315,248(0.37%)#49 | 1,034,299(0.11%)#122 |
| 50. | Bakersfield | 1,092 | 315,248(0.35%)#50 | 1,034,299(0.11%)#131 |
| 51. | Carson | 1,084 | 315,248(0.34%)#51 | 1,034,299(0.10%)#133 |
| 52. | Hacienda Heights | 1,067 | 315,248(0.34%)#52 | 1,034,299(0.10%)#136 |
| 53. | Mountain View | 1,045 | 315,248(0.33%)#53 | 1,034,299(0.10%)#140 |
| 54. | Corona | 1,041 | 315,248(0.33%)#54 | 1,034,299(0.10%)#142 |
| 55. | Placentia | 1,020 | 315,248(0.32%)#55 | 1,034,299(0.10%)#144 |
| 56. | Fresno | 980 | 315,248(0.31%)#56 | 1,034,299(0.09%)#148 |
| 57. | Seal Beach | 915 | 315,248(0.29%)#57 | 1,034,299(0.09%)#163 |
| 58. | Sacramento | 885 | 315,248(0.28%)#58 | 1,034,299(0.09%)#170 |
| 59. | Lake Forest | 879 | 315,248(0.28%)#59 | 1,034,299(0.08%)#172 |
| 60. | Huntington Beach | 850 | 315,248(0.27%)#60 | 1,034,299(0.08%)#176 |
| 61. | Alameda | 845 | 315,248(0.27%)#61 | 1,034,299(0.08%)#178 |
| 62. | Walnut | 841 | 315,248(0.27%)#62 | 1,034,299(0.08%)#179 |
| 63. | Davis | 819 | 315,248(0.26%)#63 | 1,034,299(0.08%)#186 |
| 64. | Laguna Woods | 806 | 315,248(0.26%)#64 | 1,034,299(0.08%)#189 |
| 65. | Santa Ana | 782 | 315,248(0.25%)#65 | 1,034,299(0.08%)#197 |
| 66. | Santa Monica | 775 | 315,248(0.25%)#66 | 1,034,299(0.07%)#201 |
| 67. | Arcadia | 769 | 315,248(0.24%)#67 | 1,034,299(0.07%)#204 |
| 68. | San Mateo | 763 | 315,248(0.24%)#68 | 1,034,299(0.07%)#206 |
| 69. | Redondo Beach | 753 | 315,248(0.24%)#69 | 1,034,299(0.07%)#208 |
| 70. | South Pasadena | 752 | 315,248(0.24%)#70 | 1,034,299(0.07%)#209 |
| 71. | Ontario | 722 | 315,248(0.23%)#71 | 1,034,299(0.07%)#217 |
| 72. | Danville | 717 | 315,248(0.23%)#72 | 1,034,299(0.07%)#220 |
| 73. | Campbell | 711 | 315,248(0.23%)#73 | 1,034,299(0.07%)#222 |
| 74. | Hayward | 703 | 315,248(0.22%)#74 | 1,034,299(0.07%)#224 |
| 75. | Eastvale | 698 | 315,248(0.22%)#75 | 1,034,299(0.07%)#227 |
| 76. | Carlsbad | 690 | 315,248(0.22%)#76 | 1,034,299(0.07%)#231 |
| 77. | Milpitas | 685 | 315,248(0.22%)#77 | 1,034,299(0.07%)#234 |
| 78. | Union City | 670 | 315,248(0.21%)#78 | 1,034,299(0.06%)#238 |
| 79. | Daly City | 637 | 315,248(0.20%)#79 | 1,034,299(0.06%)#246 |
| 80. | Lakewood | 632 | 315,248(0.20%)#80 | 1,034,299(0.06%)#248 |
| 81. | Thousand Oaks | 611 | 315,248(0.19%)#81 | 1,034,299(0.06%)#256 |
| 82. | Los Altos | 607 | 315,248(0.19%)#82 | 1,034,299(0.06%)#257 |
| 83. | Walnut Creek | 605 | 315,248(0.19%)#83 | 1,034,299(0.06%)#258 |
| 84. | Newport Beach | 604 | 315,248(0.19%)#84 | 1,034,299(0.06%)#259 |
| 85. | Bellflower | 604 | 315,248(0.19%)#85 | 1,034,299(0.06%)#260 |
| 86. | Oceanside | 597 | 315,248(0.19%)#86 | 1,034,299(0.06%)#262 |
| 87. | Murrieta | 596 | 315,248(0.19%)#87 | 1,034,299(0.06%)#263 |
| 88. | Camarillo | 591 | 315,248(0.19%)#88 | 1,034,299(0.06%)#270 |
| 89. | Redwood City | 560 | 315,248(0.18%)#89 | 1,034,299(0.05%)#280 |
| 90. | Monterey Park | 558 | 315,248(0.18%)#90 | 1,034,299(0.05%)#281 |
| 91. | Richmond | 555 | 315,248(0.18%)#91 | 1,034,299(0.05%)#282 |
| 92. | Laguna Niguel | 554 | 315,248(0.18%)#92 | 1,034,299(0.05%)#284 |
| 93. | Santa Rosa | 543 | 315,248(0.17%)#93 | 1,034,299(0.05%)#288 |
| 94. | Mission Viejo | 539 | 315,248(0.17%)#94 | 1,034,299(0.05%)#292 |
| 95. | Fountain Valley | 535 | 315,248(0.17%)#95 | 1,034,299(0.05%)#298 |
| 96. | Temecula | 531 | 315,248(0.17%)#96 | 1,034,299(0.05%)#301 |
| 97. | Marina | 528 | 315,248(0.17%)#97 | 1,034,299(0.05%)#303 |
| 98. | San Leandro | 525 | 315,248(0.17%)#98 | 1,034,299(0.05%)#307 |
| 99. | Simi Valley | 519 | 315,248(0.16%)#99 | 1,034,299(0.05%)#315 |
| 100. | Saratoga | 518 | 315,248(0.16%)#100 | 1,034,299(0.05%)#316 |
Common Questions
What are the Top 10 Cities with the Most Immigrants from Korea in California?
Top 10 Cities with the Most Immigrants from Korea in California are:
#1
72,278
#2
13,665
#3
10,956
#4
10,848
#5
9,638
#6
7,176
#7
6,779
#8
6,705
#9
4,604
#10
4,358
What city has the Most Immigrants from Korea in California?
Los Angeles has the Most Immigrants from Korea in California with 72,278.
What is the Total Immigrants from Korea in the State of California?
Total Immigrants from Korea in California is 315,248.
What is the Total Immigrants from Korea in the United States?
Total Immigrants from Korea in the United States is 1,034,299.