Springville, CA Map & Demographics
Springville Map
Springville Overview
$31,261
PER CAPITA INCOME
$93,571
AVG FAMILY INCOME
$81,319
AVG HOUSEHOLD INCOME
49.5%
WAGE / INCOME GAP [ % ]
50.5¢/ $1
WAGE / INCOME GAP [ $ ]
0.45
INEQUALITY / GINI INDEX
508
TOTAL POPULATION
346
MALE POPULATION
162
FEMALE POPULATION
213.58
MALES / 100 FEMALES
46.82
FEMALES / 100 MALES
34.5
MEDIAN AGE
3.8
AVG FAMILY SIZE
2.9
AVG HOUSEHOLD SIZE
262
LABOR FORCE [ PEOPLE ]
57.3%
PERCENT IN LABOR FORCE
6.9%
UNEMPLOYMENT RATE
Springville Zip Codes
Springville Area Codes
Income in Springville
Income Overview in Springville
Per Capita Income in Springville is $31,261, while median incomes of families and households are $93,571 and $81,319 respectively.
| Characteristic | Number | Measure |
| Per Capita Income | 508 | $31,261 |
| Median Family Income | 106 | $93,571 |
| Mean Family Income | 106 | $111,651 |
| Median Household Income | 177 | $81,319 |
| Mean Household Income | 177 | $80,560 |
| Income Deficit | 106 | $0 |
| Wage / Income Gap (%) | 508 | 49.49% |
| Wage / Income Gap ($) | 508 | 50.51¢ per $1 |
| Gini / Inequality Index | 508 | 0.45 |
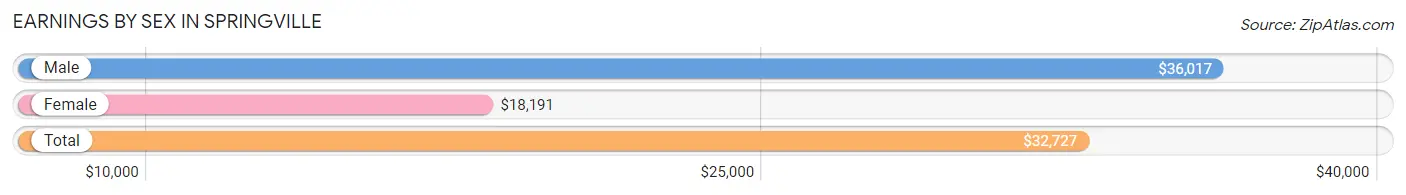
Earnings by Sex in Springville
Average Earnings in Springville are $32,727, $36,017 for men and $18,191 for women, a difference of 49.5%.
| Sex | Number | Average Earnings |
| Male | 147 (60.3%) | $36,017 |
| Female | 97 (39.8%) | $18,191 |
| Total | 244 (100.0%) | $32,727 |
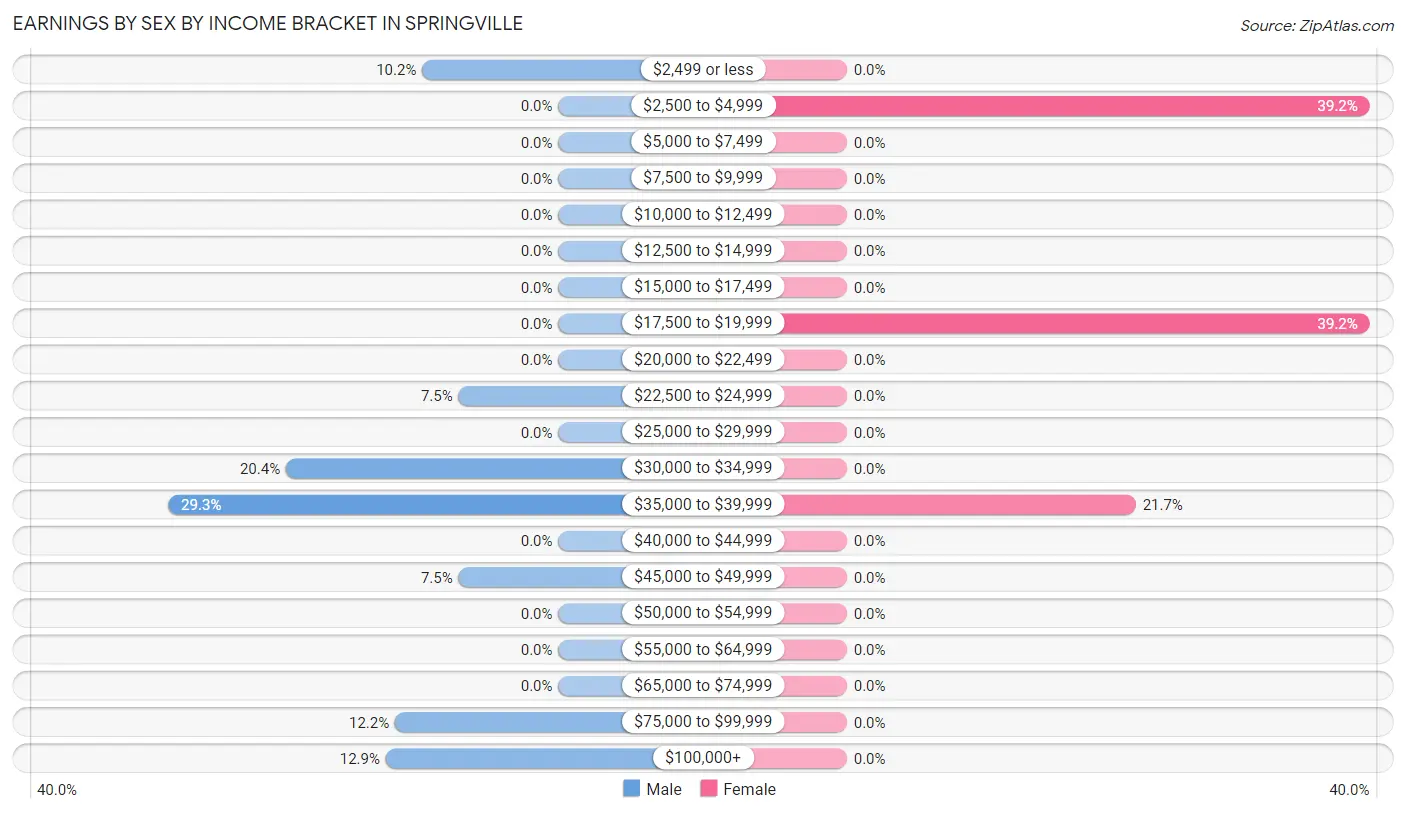
Earnings by Sex by Income Bracket in Springville
The most common earnings brackets in Springville are $35,000 to $39,999 for men (43 | 29.2%) and $2,500 to $4,999 for women (38 | 39.2%).
| Income | Male | Female |
| $2,499 or less | 15 (10.2%) | 0 (0.0%) |
| $2,500 to $4,999 | 0 (0.0%) | 38 (39.2%) |
| $5,000 to $7,499 | 0 (0.0%) | 0 (0.0%) |
| $7,500 to $9,999 | 0 (0.0%) | 0 (0.0%) |
| $10,000 to $12,499 | 0 (0.0%) | 0 (0.0%) |
| $12,500 to $14,999 | 0 (0.0%) | 0 (0.0%) |
| $15,000 to $17,499 | 0 (0.0%) | 0 (0.0%) |
| $17,500 to $19,999 | 0 (0.0%) | 38 (39.2%) |
| $20,000 to $22,499 | 0 (0.0%) | 0 (0.0%) |
| $22,500 to $24,999 | 11 (7.5%) | 0 (0.0%) |
| $25,000 to $29,999 | 0 (0.0%) | 0 (0.0%) |
| $30,000 to $34,999 | 30 (20.4%) | 0 (0.0%) |
| $35,000 to $39,999 | 43 (29.2%) | 21 (21.6%) |
| $40,000 to $44,999 | 0 (0.0%) | 0 (0.0%) |
| $45,000 to $49,999 | 11 (7.5%) | 0 (0.0%) |
| $50,000 to $54,999 | 0 (0.0%) | 0 (0.0%) |
| $55,000 to $64,999 | 0 (0.0%) | 0 (0.0%) |
| $65,000 to $74,999 | 0 (0.0%) | 0 (0.0%) |
| $75,000 to $99,999 | 18 (12.2%) | 0 (0.0%) |
| $100,000+ | 19 (12.9%) | 0 (0.0%) |
| Total | 147 (100.0%) | 97 (100.0%) |
Earnings by Sex by Educational Attainment in Springville
| Educational Attainment | Male Income | Female Income |
| Less than High School | - | - |
| High School Diploma | - | - |
| College or Associate's Degree | - | - |
| Bachelor's Degree | - | - |
| Graduate Degree | - | - |
| Total | $36,773 | $18,191 |
Family Income in Springville
Family Income Brackets in Springville
According to the Springville family income data, there are 39 families falling into the $75,000 to $99,999 income range, which is the most common income bracket and makes up 36.8% of all families.
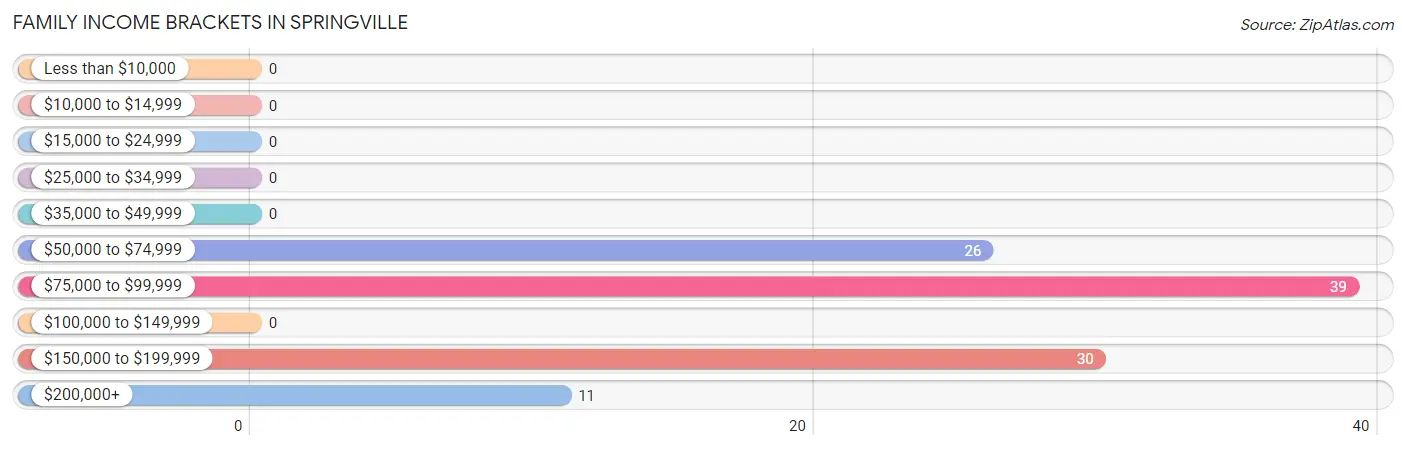
| Income Bracket | # Families | % Families |
| Less than $10,000 | 0 | 0.0% |
| $10,000 to $14,999 | 0 | 0.0% |
| $15,000 to $24,999 | 0 | 0.0% |
| $25,000 to $34,999 | 0 | 0.0% |
| $35,000 to $49,999 | 0 | 0.0% |
| $50,000 to $74,999 | 26 | 24.5% |
| $75,000 to $99,999 | 39 | 36.8% |
| $100,000 to $149,999 | 0 | 0.0% |
| $150,000 to $199,999 | 30 | 28.3% |
| $200,000+ | 11 | 10.4% |
Family Income by Famaliy Size in Springville
| Income Bracket | # Families | Median Income |
| 2-Person Families | 45 (42.4%) | $0 |
| 3-Person Families | 22 (20.7%) | $0 |
| 4-Person Families | 39 (36.8%) | $0 |
| 5-Person Families | 0 (0.0%) | $0 |
| 6-Person Families | 0 (0.0%) | $0 |
| 7+ Person Families | 0 (0.0%) | $0 |
| Total | 106 (100.0%) | $93,571 |
Family Income by Number of Earners in Springville
| Number of Earners | # Families | Median Income |
| No Earners | 45 (42.4%) | $0 |
| 1 Earner | 18 (17.0%) | $0 |
| 2 Earners | 11 (10.4%) | $0 |
| 3+ Earners | 32 (30.2%) | $0 |
| Total | 106 (100.0%) | $93,571 |
Household Income in Springville
Household Income Brackets in Springville
With 53 households falling in the category, the less than $10,000 income range is the most frequent in Springville, accounting for 29.9% of all households.
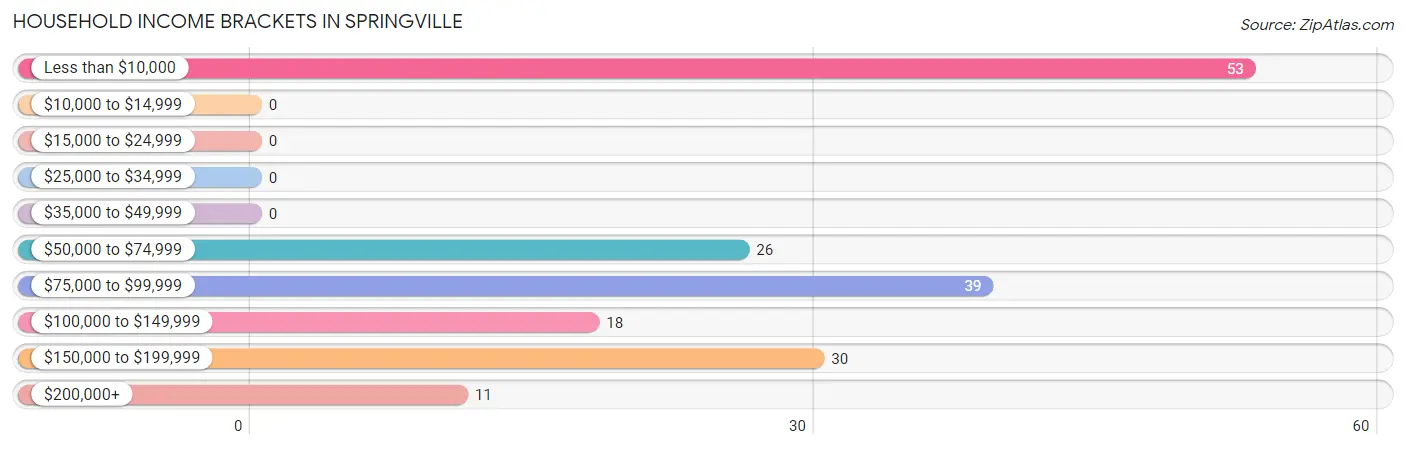
| Income Bracket | # Households | % Households |
| Less than $10,000 | 53 | 29.9% |
| $10,000 to $14,999 | 0 | 0.0% |
| $15,000 to $24,999 | 0 | 0.0% |
| $25,000 to $34,999 | 0 | 0.0% |
| $35,000 to $49,999 | 0 | 0.0% |
| $50,000 to $74,999 | 26 | 14.7% |
| $75,000 to $99,999 | 39 | 22.0% |
| $100,000 to $149,999 | 18 | 10.2% |
| $150,000 to $199,999 | 30 | 16.9% |
| $200,000+ | 11 | 6.2% |
Household Income by Householder Age in Springville
The median household income in Springville is $81,319, with the highest median household income of $94,821 found in the 45 to 64 years age bracket for the primary householder. A total of 61 households (34.5%) fall into this category.
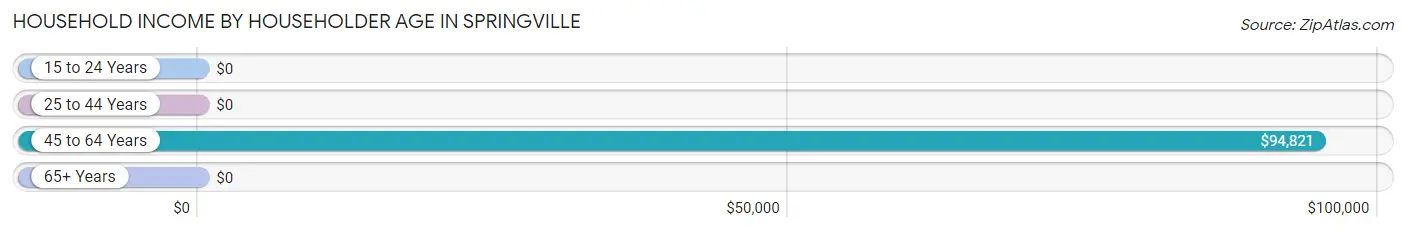
| Income Bracket | # Households | Median Income |
| 15 to 24 Years | 0 (0.0%) | $0 |
| 25 to 44 Years | 71 (40.1%) | $0 |
| 45 to 64 Years | 61 (34.5%) | $94,821 |
| 65+ Years | 45 (25.4%) | $0 |
| Total | 177 (100.0%) | $81,319 |
Poverty in Springville
Income Below Poverty by Sex and Age in Springville
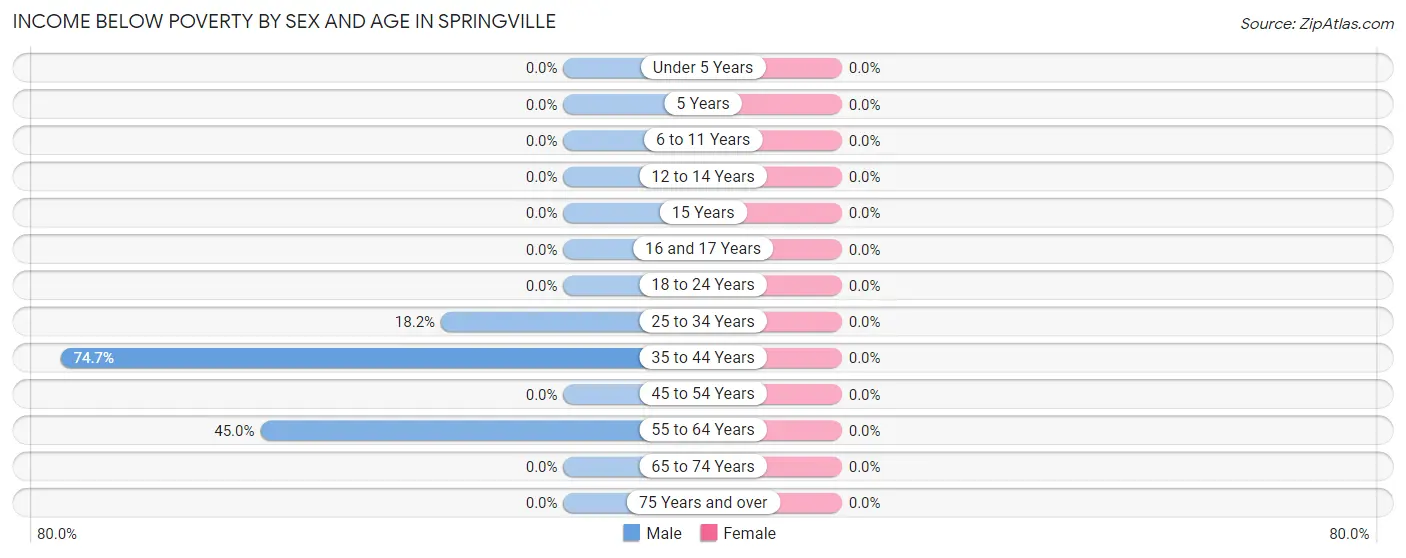
| Age Bracket | Male | Female |
| Under 5 Years | 0 (0.0%) | 0 (0.0%) |
| 5 Years | 0 (0.0%) | 0 (0.0%) |
| 6 to 11 Years | 0 (0.0%) | 0 (0.0%) |
| 12 to 14 Years | 0 (0.0%) | 0 (0.0%) |
| 15 Years | 0 (0.0%) | 0 (0.0%) |
| 16 and 17 Years | 0 (0.0%) | 0 (0.0%) |
| 18 to 24 Years | 0 (0.0%) | 0 (0.0%) |
| 25 to 34 Years | 18 (18.2%) | 0 (0.0%) |
| 35 to 44 Years | 53 (74.7%) | 0 (0.0%) |
| 45 to 54 Years | 0 (0.0%) | 0 (0.0%) |
| 55 to 64 Years | 18 (45.0%) | 0 (0.0%) |
| 65 to 74 Years | 0 (0.0%) | 0 (0.0%) |
| 75 Years and over | 0 (0.0%) | 0 (0.0%) |
| Total | 89 (25.7%) | 0 (0.0%) |
Income Above Poverty by Sex and Age in Springville
According to the poverty statistics in Springville, males aged under 5 years and females aged under 5 years are the age groups that are most secure financially, with 100.0% of males and 100.0% of females in these age groups living above the poverty line.
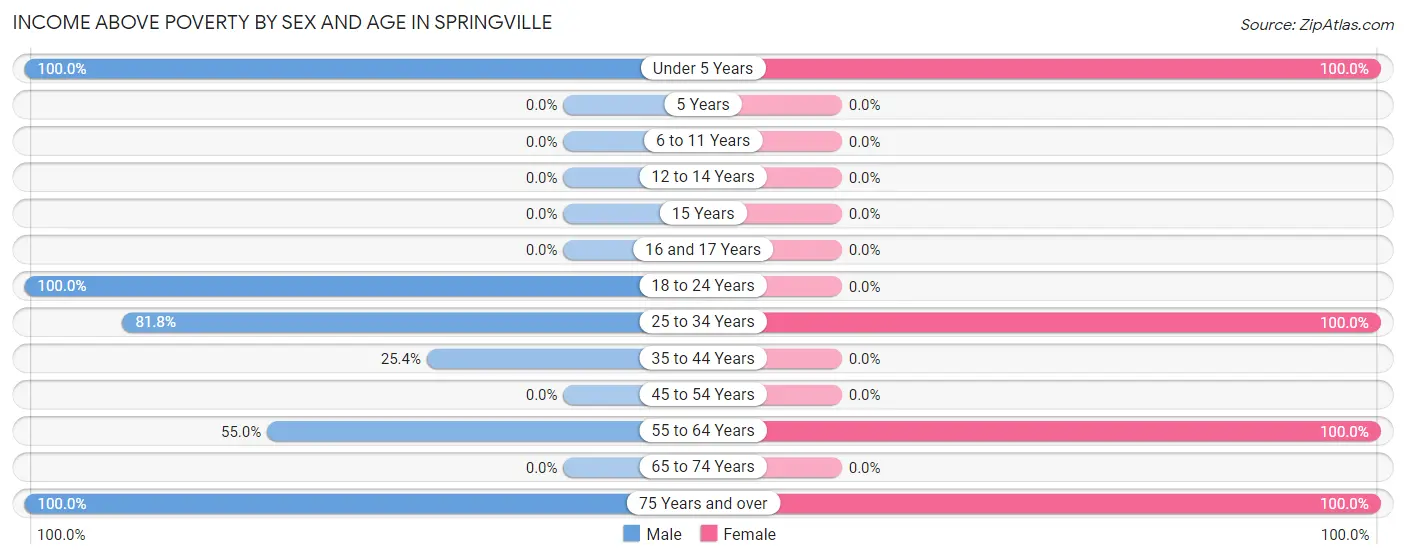
| Age Bracket | Male | Female |
| Under 5 Years | 22 (100.0%) | 29 (100.0%) |
| 5 Years | 0 (0.0%) | 0 (0.0%) |
| 6 to 11 Years | 0 (0.0%) | 0 (0.0%) |
| 12 to 14 Years | 0 (0.0%) | 0 (0.0%) |
| 15 Years | 0 (0.0%) | 0 (0.0%) |
| 16 and 17 Years | 0 (0.0%) | 0 (0.0%) |
| 18 to 24 Years | 26 (100.0%) | 0 (0.0%) |
| 25 to 34 Years | 81 (81.8%) | 97 (100.0%) |
| 35 to 44 Years | 18 (25.4%) | 0 (0.0%) |
| 45 to 54 Years | 0 (0.0%) | 0 (0.0%) |
| 55 to 64 Years | 22 (55.0%) | 21 (100.0%) |
| 65 to 74 Years | 0 (0.0%) | 0 (0.0%) |
| 75 Years and over | 88 (100.0%) | 15 (100.0%) |
| Total | 257 (74.3%) | 162 (100.0%) |
Income Below Poverty Among Married-Couple Families in Springville
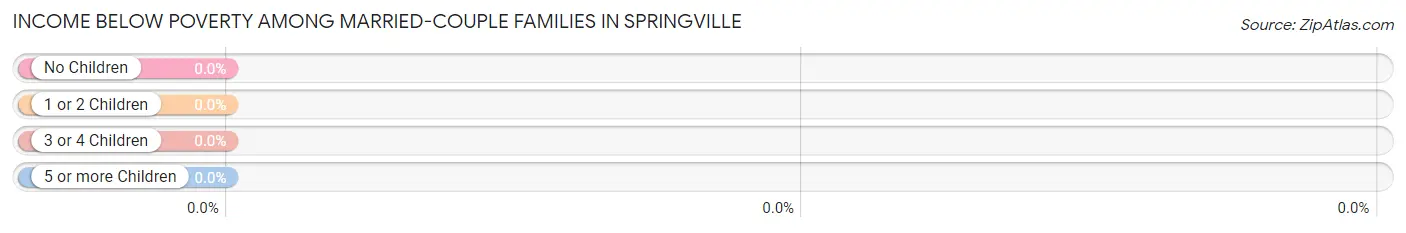
| Children | Above Poverty | Below Poverty |
| No Children | 45 (100.0%) | 0 (0.0%) |
| 1 or 2 Children | 18 (100.0%) | 0 (0.0%) |
| 3 or 4 Children | 0 (0.0%) | 0 (0.0%) |
| 5 or more Children | 0 (0.0%) | 0 (0.0%) |
| Total | 63 (100.0%) | 0 (0.0%) |
Income Below Poverty Among Single-Parent Households in Springville
| Children | Single Father | Single Mother |
| No Children | 0 (0.0%) | 0 (0.0%) |
| 1 or 2 Children | 0 (0.0%) | 0 (0.0%) |
| 3 or 4 Children | 0 (0.0%) | 0 (0.0%) |
| 5 or more Children | 0 (0.0%) | 0 (0.0%) |
| Total | 0 (0.0%) | 0 (0.0%) |
Income Below Poverty Among Married-Couple vs Single-Parent Households in Springville
| Children | Married-Couple Families | Single-Parent Households |
| No Children | 0 (0.0%) | 0 (0.0%) |
| 1 or 2 Children | 0 (0.0%) | 0 (0.0%) |
| 3 or 4 Children | 0 (0.0%) | 0 (0.0%) |
| 5 or more Children | 0 (0.0%) | 0 (0.0%) |
| Total | 0 (0.0%) | 0 (0.0%) |
Race in Springville
The most populous races in Springville are White / Caucasian (374 | 73.6%), Two or more Races (97 | 19.1%), and Hawaiian / Pacific (37 | 7.3%).
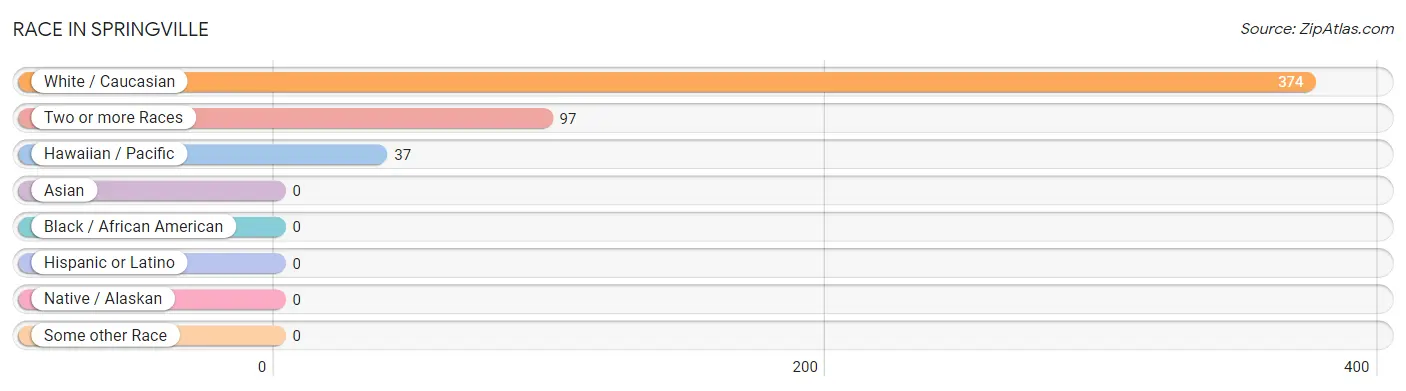
| Race | # Population | % Population |
| Asian | 0 | 0.0% |
| Black / African American | 0 | 0.0% |
| Hawaiian / Pacific | 37 | 7.3% |
| Hispanic or Latino | 0 | 0.0% |
| Native / Alaskan | 0 | 0.0% |
| White / Caucasian | 374 | 73.6% |
| Two or more Races | 97 | 19.1% |
| Some other Race | 0 | 0.0% |
| Total | 508 | 100.0% |
Ancestry in Springville
The most populous ancestries reported in Springville are English (124 | 24.4%), Sioux (97 | 19.1%), Irish (60 | 11.8%), Scandinavian (43 | 8.5%), and German (41 | 8.1%), together accounting for 71.8% of all Springville residents.
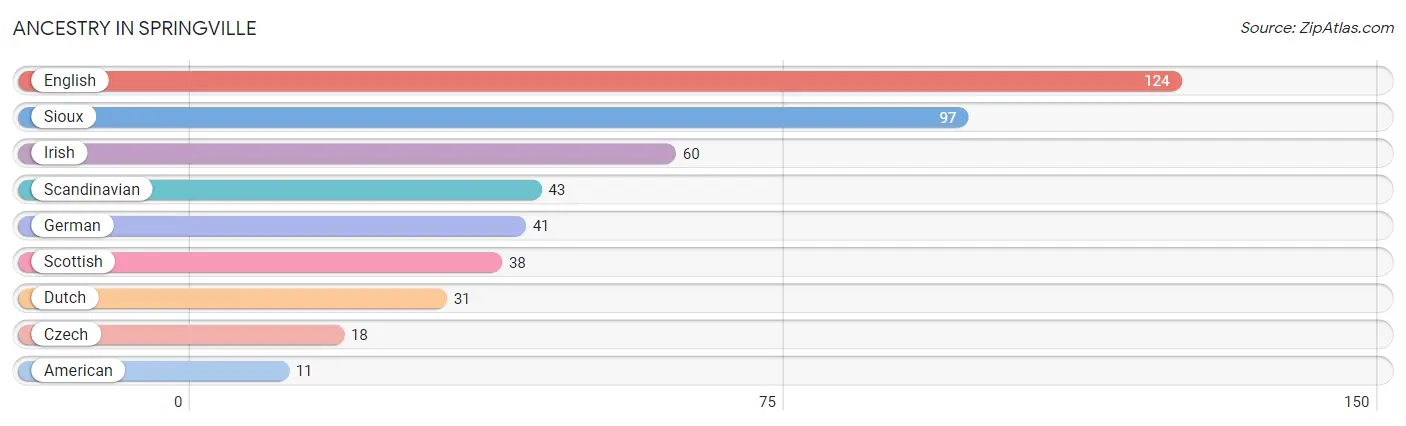
| Ancestry | # Population | % Population |
| American | 11 | 2.2% |
| Czech | 18 | 3.5% |
| Dutch | 31 | 6.1% |
| English | 124 | 24.4% |
| German | 41 | 8.1% |
| Irish | 60 | 11.8% |
| Scandinavian | 43 | 8.5% |
| Scottish | 38 | 7.5% |
| Sioux | 97 | 19.1% | View All 9 Rows |
Immigrants in Springville

| Immigration Origin | # Population | % Population | View All 0 Rows |
Sex and Age in Springville
Sex and Age in Springville
The most populous age groups in Springville are 30 to 34 Years (99 | 28.6%) for men and 30 to 34 Years (97 | 59.9%) for women.
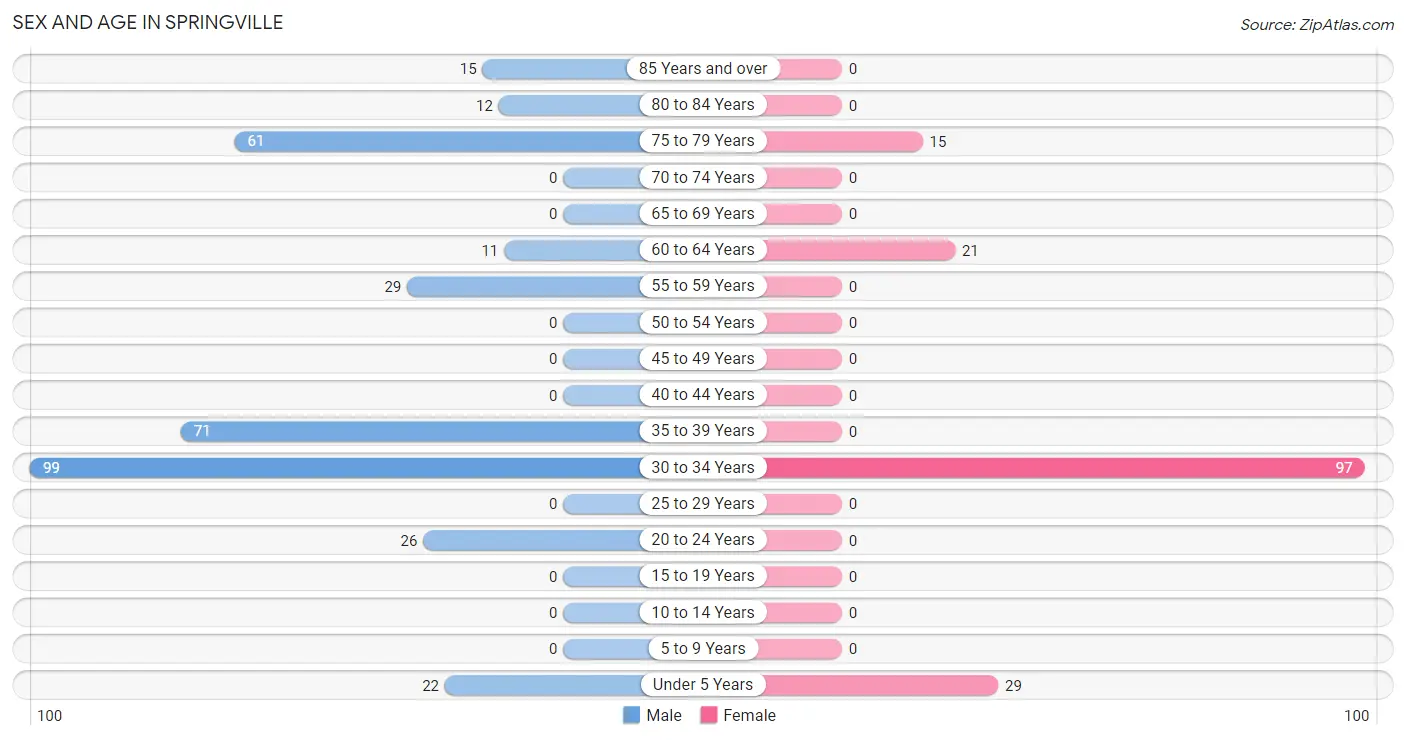
| Age Bracket | Male | Female |
| Under 5 Years | 22 (6.4%) | 29 (17.9%) |
| 5 to 9 Years | 0 (0.0%) | 0 (0.0%) |
| 10 to 14 Years | 0 (0.0%) | 0 (0.0%) |
| 15 to 19 Years | 0 (0.0%) | 0 (0.0%) |
| 20 to 24 Years | 26 (7.5%) | 0 (0.0%) |
| 25 to 29 Years | 0 (0.0%) | 0 (0.0%) |
| 30 to 34 Years | 99 (28.6%) | 97 (59.9%) |
| 35 to 39 Years | 71 (20.5%) | 0 (0.0%) |
| 40 to 44 Years | 0 (0.0%) | 0 (0.0%) |
| 45 to 49 Years | 0 (0.0%) | 0 (0.0%) |
| 50 to 54 Years | 0 (0.0%) | 0 (0.0%) |
| 55 to 59 Years | 29 (8.4%) | 0 (0.0%) |
| 60 to 64 Years | 11 (3.2%) | 21 (13.0%) |
| 65 to 69 Years | 0 (0.0%) | 0 (0.0%) |
| 70 to 74 Years | 0 (0.0%) | 0 (0.0%) |
| 75 to 79 Years | 61 (17.6%) | 15 (9.3%) |
| 80 to 84 Years | 12 (3.5%) | 0 (0.0%) |
| 85 Years and over | 15 (4.3%) | 0 (0.0%) |
| Total | 346 (100.0%) | 162 (100.0%) |
Families and Households in Springville
Median Family Size in Springville
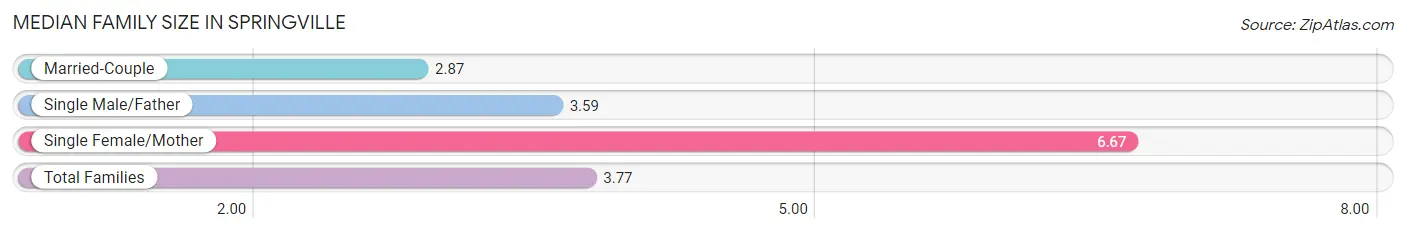
The median family size in Springville is 3.77 persons per family, with single female/mother families (21 | 19.8%) accounting for the largest median family size of 6.67 persons per family. On the other hand, married-couple families (63 | 59.4%) represent the smallest median family size with 2.87 persons per family.
| Family Type | # Families | Family Size |
| Married-Couple | 63 (59.4%) | 2.87 |
| Single Male/Father | 22 (20.7%) | 3.59 |
| Single Female/Mother | 21 (19.8%) | 6.67 |
| Total Families | 106 (100.0%) | 3.77 |
Median Household Size in Springville
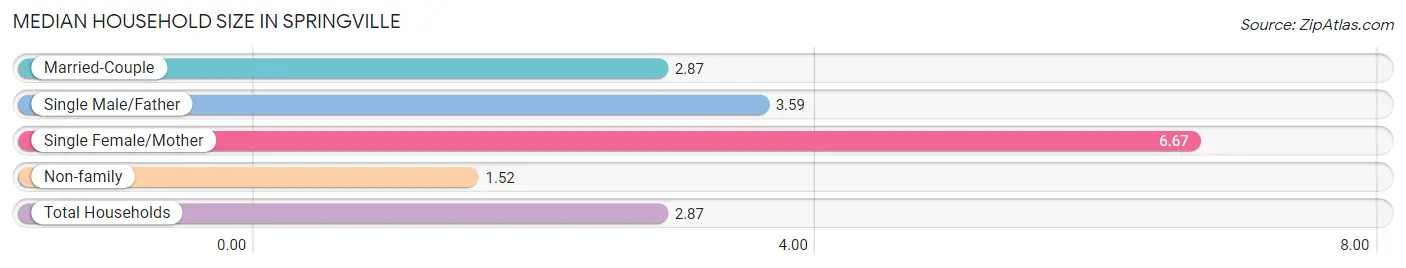
The median household size in Springville is 2.87 persons per household, with single female/mother households (21 | 11.9%) accounting for the largest median household size of 6.67 persons per household. non-family households (71 | 40.1%) represent the smallest median household size with 1.52 persons per household.
| Household Type | # Households | Household Size |
| Married-Couple | 63 (35.6%) | 2.87 |
| Single Male/Father | 22 (12.4%) | 3.59 |
| Single Female/Mother | 21 (11.9%) | 6.67 |
| Non-family | 71 (40.1%) | 1.52 |
| Total Households | 177 (100.0%) | 2.87 |
Household Size by Marriage Status in Springville
Out of a total of 177 households in Springville, 106 (59.9%) are family households, while 71 (40.1%) are nonfamily households. The most numerous type of family households are 2-person households, comprising 45, and the most common type of nonfamily households are 1-person households, comprising 53.
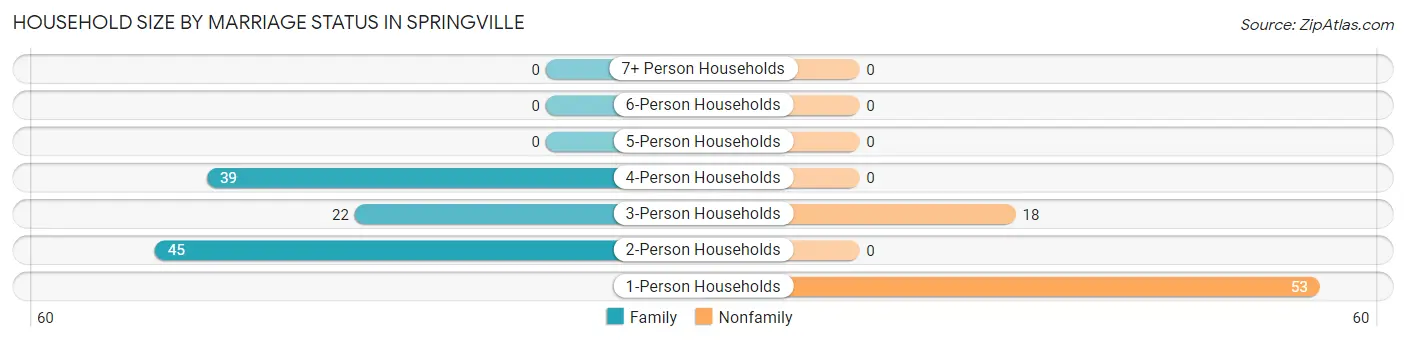
| Household Size | Family Households | Nonfamily Households |
| 1-Person Households | - | 53 (29.9%) |
| 2-Person Households | 45 (25.4%) | 0 (0.0%) |
| 3-Person Households | 22 (12.4%) | 18 (10.2%) |
| 4-Person Households | 39 (22.0%) | 0 (0.0%) |
| 5-Person Households | 0 (0.0%) | 0 (0.0%) |
| 6-Person Households | 0 (0.0%) | 0 (0.0%) |
| 7+ Person Households | 0 (0.0%) | 0 (0.0%) |
| Total | 106 (59.9%) | 71 (40.1%) |
Female Fertility in Springville
Fertility by Age in Springville
| Age Bracket | Women with Births | Births / 1,000 Women |
| 15 to 19 years | 0 (0.0%) | 0.0 |
| 20 to 34 years | 0 (0.0%) | 0.0 |
| 35 to 50 years | 0 (0.0%) | 0.0 |
| Total | 0 (0.0%) | 0.0 |
Fertility by Age by Marriage Status in Springville
| Age Bracket | Married | Unmarried |
| 15 to 19 years | 0 (0.0%) | 0 (0.0%) |
| 20 to 34 years | 0 (0.0%) | 0 (0.0%) |
| 35 to 50 years | 0 (0.0%) | 0 (0.0%) |
| Total | 0 (0.0%) | 0 (0.0%) |
Fertility by Education in Springville
| Educational Attainment | Women with Births | Births / 1,000 Women |
| Less than High School | 0 (0.0%) | 0.0 |
| High School Diploma | 0 (0.0%) | 0.0 |
| College or Associate's Degree | 0 (0.0%) | 0.0 |
| Bachelor's Degree | 0 (0.0%) | 0.0 |
| Graduate Degree | 0 (0.0%) | 0.0 |
| Total | 0 (0.0%) | 0.0 |
Fertility by Education by Marriage Status in Springville
| Educational Attainment | Married | Unmarried |
| Less than High School | 0 (0.0%) | 0 (0.0%) |
| High School Diploma | 0 (0.0%) | 0 (0.0%) |
| College or Associate's Degree | 0 (0.0%) | 0 (0.0%) |
| Bachelor's Degree | 0 (0.0%) | 0 (0.0%) |
| Graduate Degree | 0 (0.0%) | 0 (0.0%) |
| Total | 0 (0.0%) | 0 (0.0%) |
Employment Characteristics in Springville
Employment by Class of Employer in Springville
Among the 244 employed individuals in Springville, private company employees (98 | 40.2%), local government employees (87 | 35.7%), and self-employed (not incorporated) (40 | 16.4%) make up the most common classes of employment.
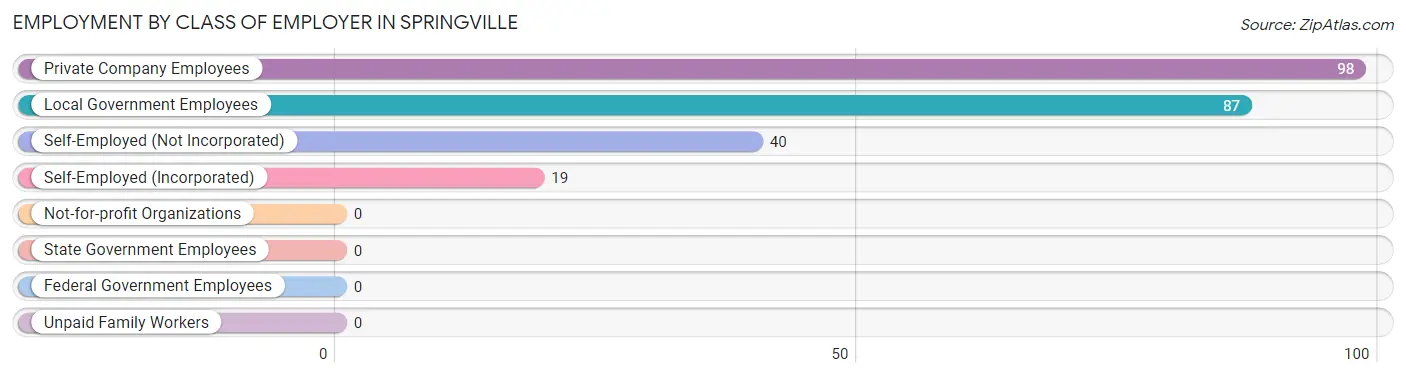
| Employer Class | # Employees | % Employees |
| Private Company Employees | 98 | 40.2% |
| Self-Employed (Incorporated) | 19 | 7.8% |
| Self-Employed (Not Incorporated) | 40 | 16.4% |
| Not-for-profit Organizations | 0 | 0.0% |
| Local Government Employees | 87 | 35.7% |
| State Government Employees | 0 | 0.0% |
| Federal Government Employees | 0 | 0.0% |
| Unpaid Family Workers | 0 | 0.0% |
| Total | 244 | 100.0% |
Employment Status by Age in Springville
According to the labor force statistics for Springville, out of the total population over 16 years of age (457), 57.3% or 262 individuals are in the labor force, with 6.9% or 18 of them unemployed. The age group with the highest labor force participation rate is 20 to 24 years, with 100.0% or 26 individuals in the labor force. Within the labor force, the 55 to 59 years age range has the highest percentage of unemployed individuals, with 62.1% or 18 of them being unemployed.
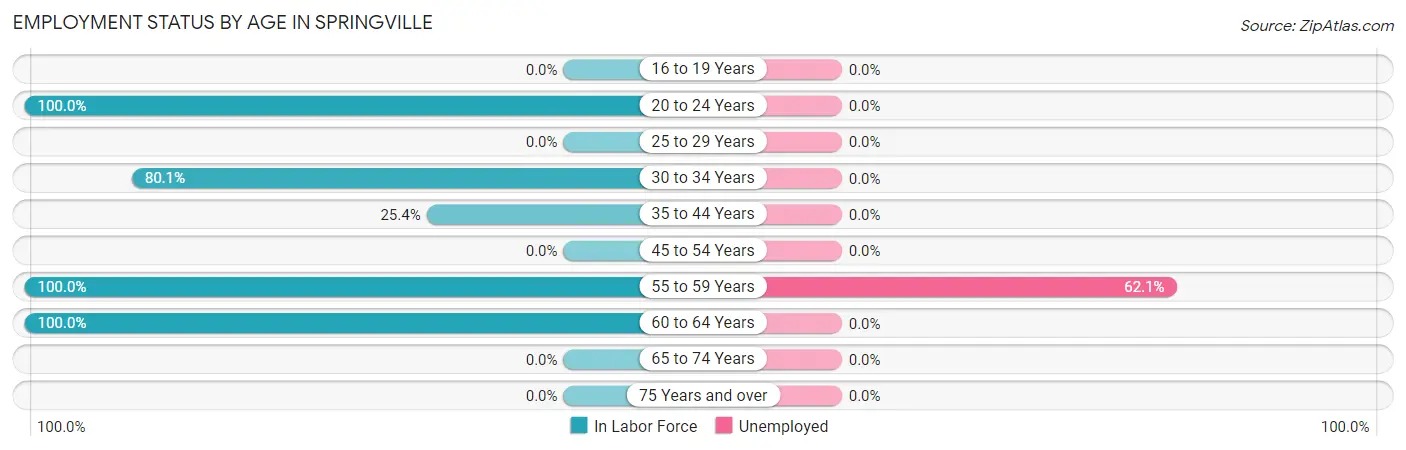
| Age Bracket | In Labor Force | Unemployed |
| 16 to 19 Years | 0 (0.0%) | 0 (0.0%) |
| 20 to 24 Years | 26 (100.0%) | 0 (0.0%) |
| 25 to 29 Years | 0 (0.0%) | 0 (0.0%) |
| 30 to 34 Years | 157 (80.1%) | 0 (0.0%) |
| 35 to 44 Years | 18 (25.4%) | 0 (0.0%) |
| 45 to 54 Years | 0 (0.0%) | 0 (0.0%) |
| 55 to 59 Years | 29 (100.0%) | 18 (62.1%) |
| 60 to 64 Years | 32 (100.0%) | 0 (0.0%) |
| 65 to 74 Years | 0 (0.0%) | 0 (0.0%) |
| 75 Years and over | 0 (0.0%) | 0 (0.0%) |
| Total | 262 (57.3%) | 18 (6.9%) |
Employment Status by Educational Attainment in Springville
According to labor force statistics for Springville, 72.0% of individuals (236) out of the total population between 25 and 64 years of age (328) are in the labor force, with 7.6% or 18 of them being unemployed. The group with the highest labor force participation rate are those with the educational attainment of high school diploma, with 100.0% or 54 individuals in the labor force. Within the labor force, individuals with college / associate degree education have the highest percentage of unemployment, with 23.4% or 18 of them being unemployed.
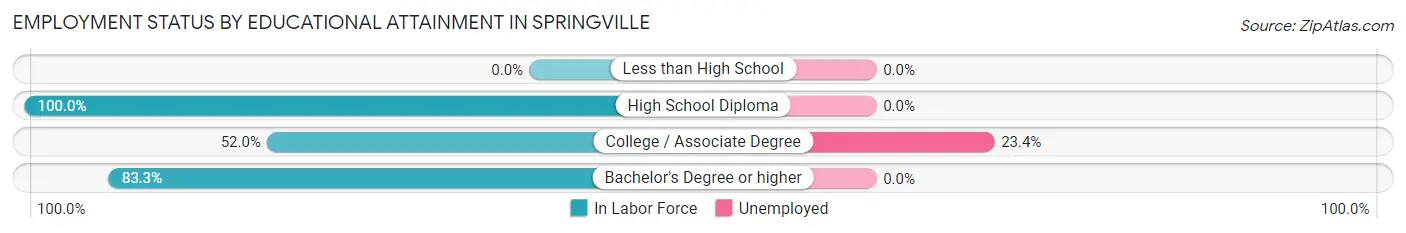
| Educational Attainment | In Labor Force | Unemployed |
| Less than High School | 0 (0.0%) | 0 (0.0%) |
| High School Diploma | 54 (100.0%) | 0 (0.0%) |
| College / Associate Degree | 77 (52.0%) | 35 (23.4%) |
| Bachelor's Degree or higher | 105 (83.3%) | 0 (0.0%) |
| Total | 236 (72.0%) | 25 (7.6%) |
Employment Occupations by Sex in Springville
Management, Business, Science and Arts Occupations
The most common Management, Business, Science and Arts occupations in Springville are Management (30 | 12.3%), Computers, Engineering & Science (19 | 7.8%), Architecture & Engineering (19 | 7.8%), and Business & Financial (18 | 7.4%).
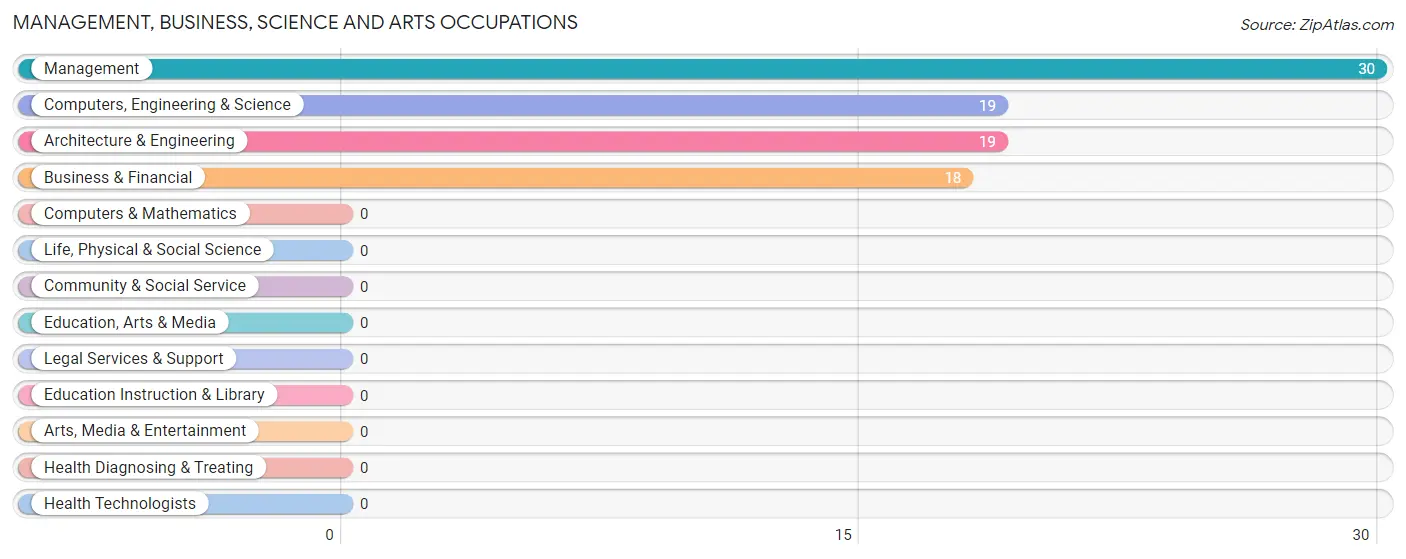
Management, Business, Science and Arts Occupations by Sex
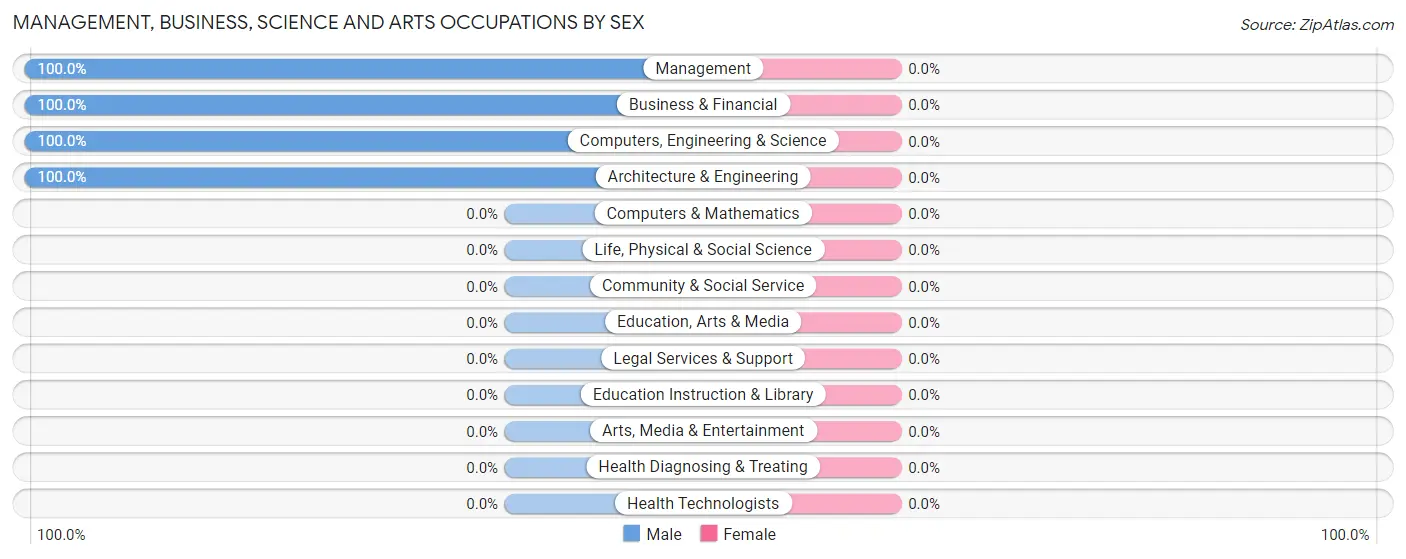
| Occupation | Male | Female |
| Management | 30 (100.0%) | 0 (0.0%) |
| Business & Financial | 18 (100.0%) | 0 (0.0%) |
| Computers, Engineering & Science | 19 (100.0%) | 0 (0.0%) |
| Computers & Mathematics | 0 (0.0%) | 0 (0.0%) |
| Architecture & Engineering | 19 (100.0%) | 0 (0.0%) |
| Life, Physical & Social Science | 0 (0.0%) | 0 (0.0%) |
| Community & Social Service | 0 (0.0%) | 0 (0.0%) |
| Education, Arts & Media | 0 (0.0%) | 0 (0.0%) |
| Legal Services & Support | 0 (0.0%) | 0 (0.0%) |
| Education Instruction & Library | 0 (0.0%) | 0 (0.0%) |
| Arts, Media & Entertainment | 0 (0.0%) | 0 (0.0%) |
| Health Diagnosing & Treating | 0 (0.0%) | 0 (0.0%) |
| Health Technologists | 0 (0.0%) | 0 (0.0%) |
| Total (Category) | 67 (100.0%) | 0 (0.0%) |
| Total (Overall) | 147 (60.3%) | 97 (39.8%) |
Services Occupations
The most common Services occupations in Springville are Personal Care & Service (38 | 15.6%), and Healthcare Support (21 | 8.6%).
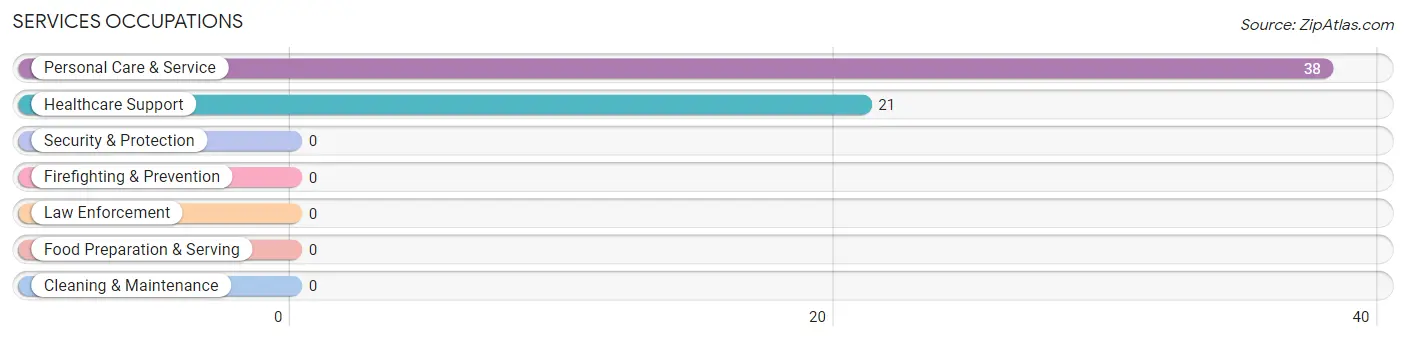
Services Occupations by Sex
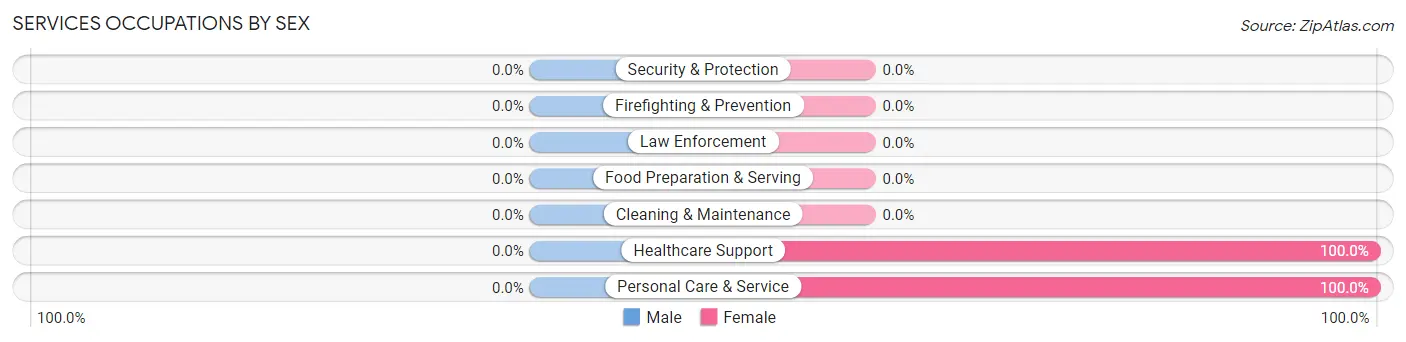
| Occupation | Male | Female |
| Healthcare Support | 0 (0.0%) | 21 (100.0%) |
| Security & Protection | 0 (0.0%) | 0 (0.0%) |
| Firefighting & Prevention | 0 (0.0%) | 0 (0.0%) |
| Law Enforcement | 0 (0.0%) | 0 (0.0%) |
| Food Preparation & Serving | 0 (0.0%) | 0 (0.0%) |
| Cleaning & Maintenance | 0 (0.0%) | 0 (0.0%) |
| Personal Care & Service | 0 (0.0%) | 38 (100.0%) |
| Total (Category) | 0 (0.0%) | 59 (100.0%) |
| Total (Overall) | 147 (60.3%) | 97 (39.8%) |
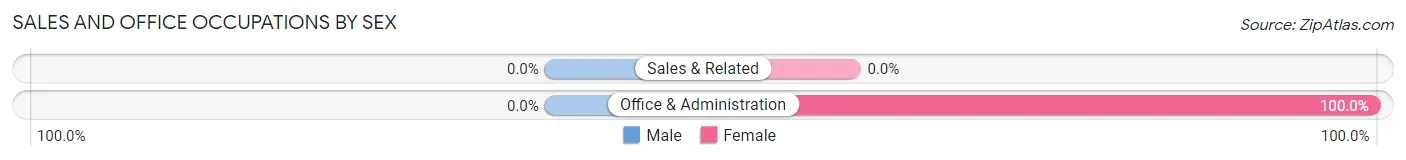
Sales and Office Occupations
The most common Sales and Office occupations in Springville are , and Office & Administration (38 | 15.6%).
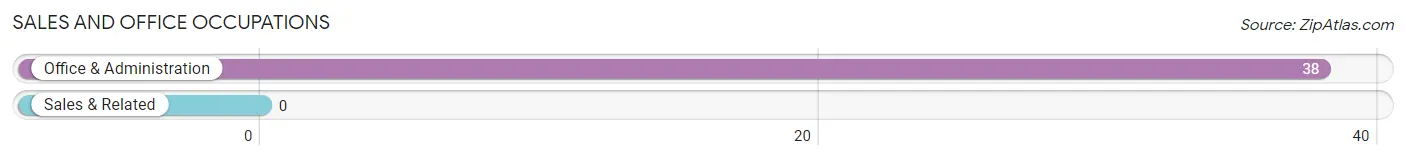
Sales and Office Occupations by Sex
| Occupation | Male | Female |
| Sales & Related | 0 (0.0%) | 0 (0.0%) |
| Office & Administration | 0 (0.0%) | 38 (100.0%) |
| Total (Category) | 0 (0.0%) | 38 (100.0%) |
| Total (Overall) | 147 (60.3%) | 97 (39.8%) |
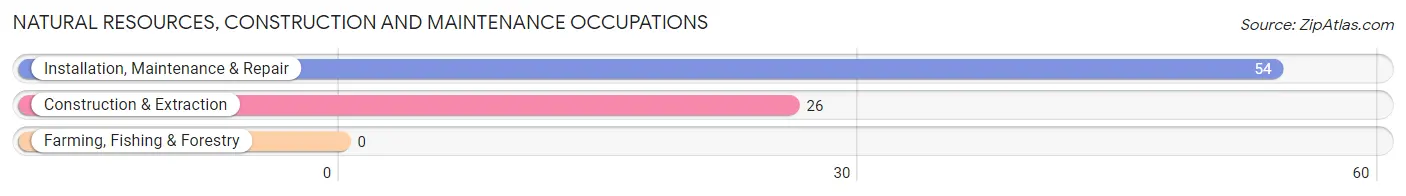
Natural Resources, Construction and Maintenance Occupations
The most common Natural Resources, Construction and Maintenance occupations in Springville are Installation, Maintenance & Repair (54 | 22.1%), and Construction & Extraction (26 | 10.7%).
Natural Resources, Construction and Maintenance Occupations by Sex
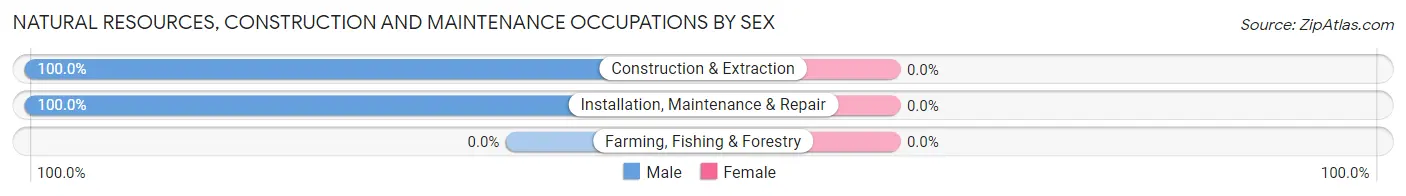
| Occupation | Male | Female |
| Farming, Fishing & Forestry | 0 (0.0%) | 0 (0.0%) |
| Construction & Extraction | 26 (100.0%) | 0 (0.0%) |
| Installation, Maintenance & Repair | 54 (100.0%) | 0 (0.0%) |
| Total (Category) | 80 (100.0%) | 0 (0.0%) |
| Total (Overall) | 147 (60.3%) | 97 (39.8%) |
Production, Transportation and Moving Occupations
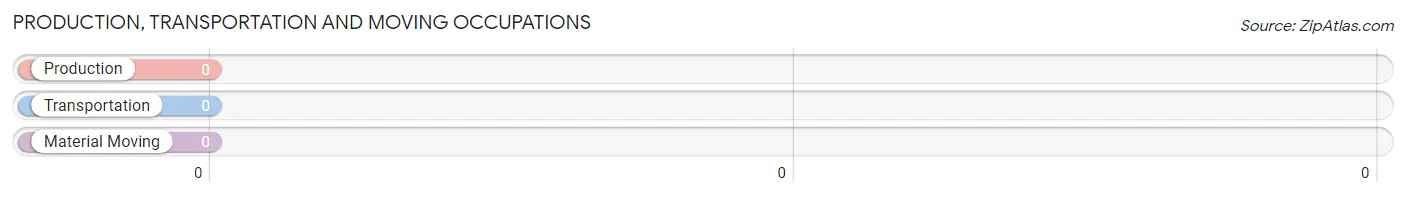
Production, Transportation and Moving Occupations by Sex
| Occupation | Male | Female |
| Production | 0 (0.0%) | 0 (0.0%) |
| Transportation | 0 (0.0%) | 0 (0.0%) |
| Material Moving | 0 (0.0%) | 0 (0.0%) |
| Total (Category) | 0 (0.0%) | 0 (0.0%) |
| Total (Overall) | 147 (60.3%) | 97 (39.8%) |
Employment Industries by Sex in Springville
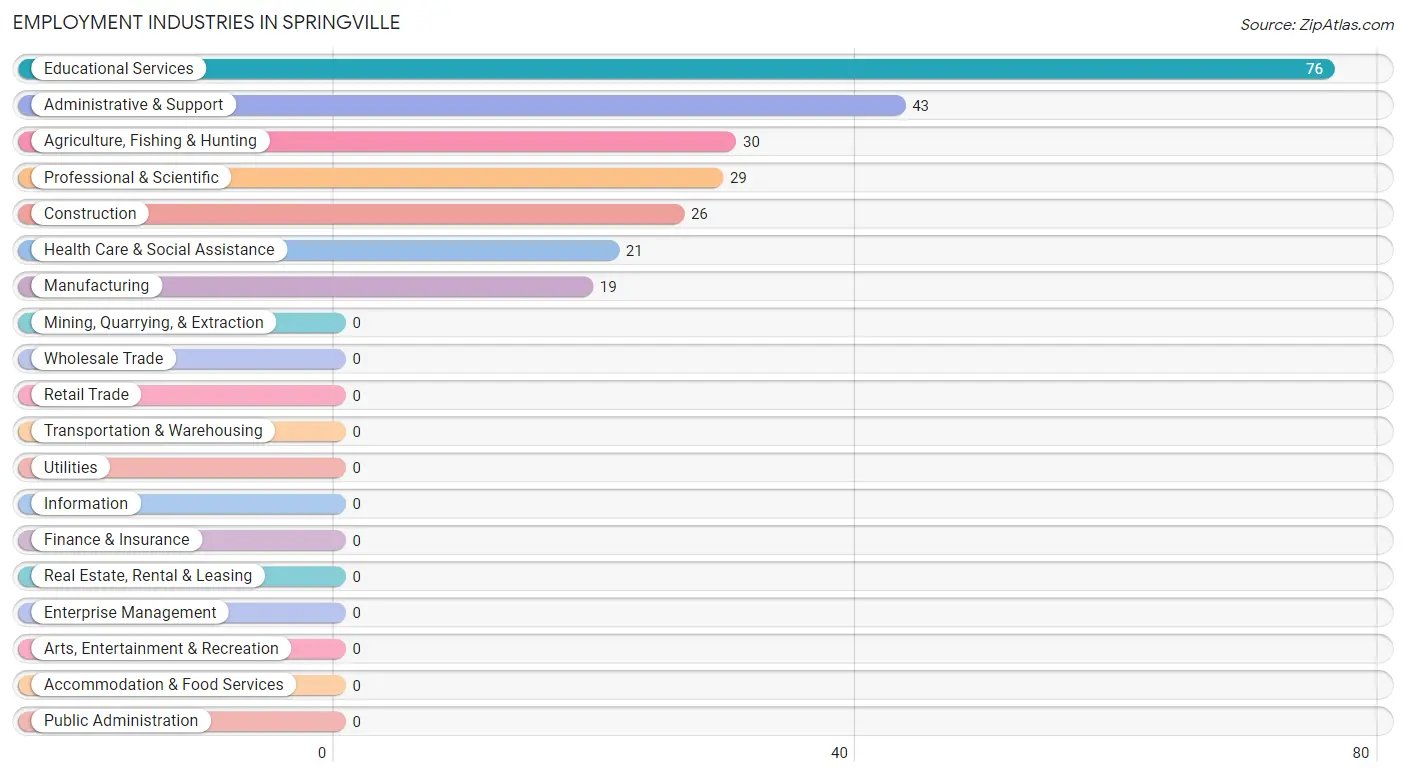
Employment Industries in Springville
The major employment industries in Springville include Educational Services (76 | 31.1%), Administrative & Support (43 | 17.6%), Agriculture, Fishing & Hunting (30 | 12.3%), Professional & Scientific (29 | 11.9%), and Construction (26 | 10.7%).
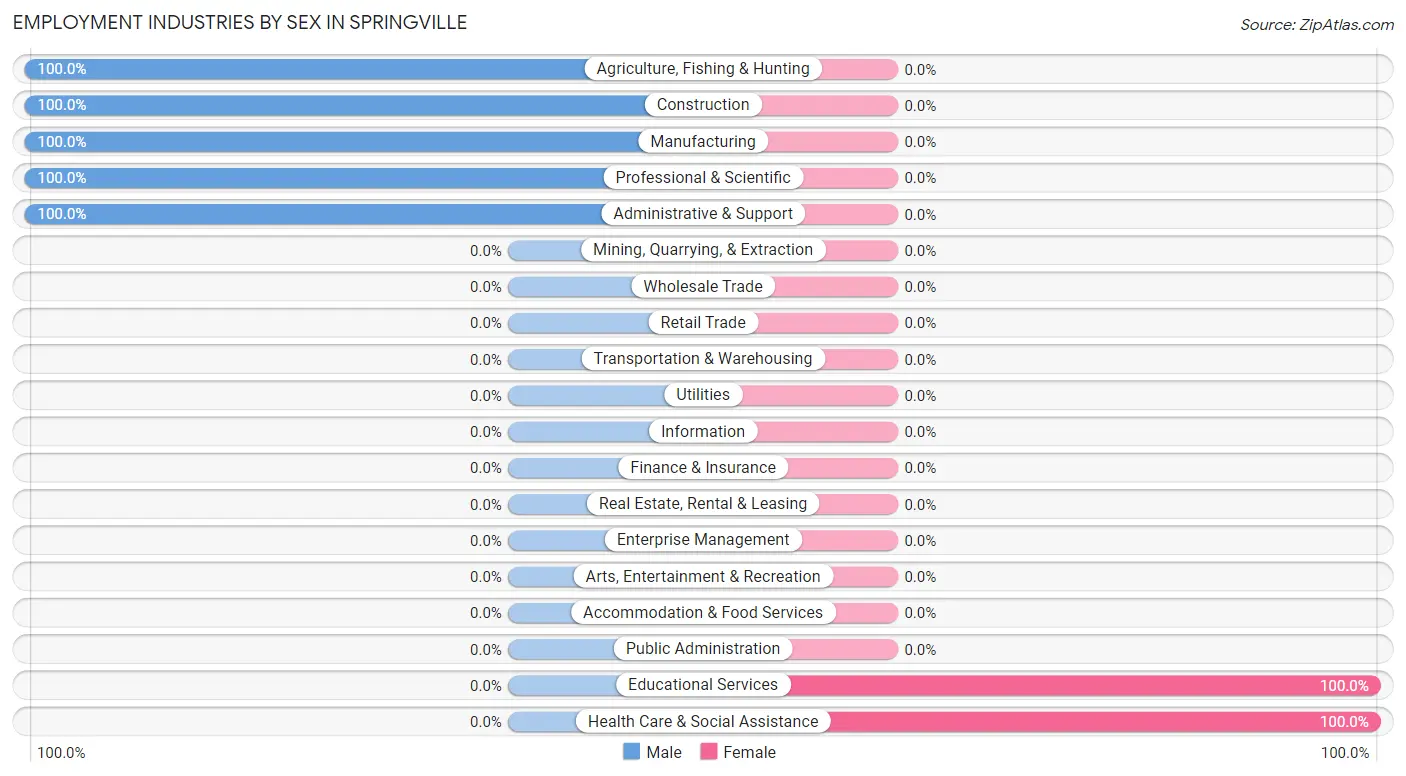
Employment Industries by Sex in Springville
The Springville industries that see more men than women are Agriculture, Fishing & Hunting (100.0%), Construction (100.0%), and Manufacturing (100.0%), whereas the industries that tend to have a higher number of women are Educational Services (100.0%), and Health Care & Social Assistance (100.0%).
| Industry | Male | Female |
| Agriculture, Fishing & Hunting | 30 (100.0%) | 0 (0.0%) |
| Mining, Quarrying, & Extraction | 0 (0.0%) | 0 (0.0%) |
| Construction | 26 (100.0%) | 0 (0.0%) |
| Manufacturing | 19 (100.0%) | 0 (0.0%) |
| Wholesale Trade | 0 (0.0%) | 0 (0.0%) |
| Retail Trade | 0 (0.0%) | 0 (0.0%) |
| Transportation & Warehousing | 0 (0.0%) | 0 (0.0%) |
| Utilities | 0 (0.0%) | 0 (0.0%) |
| Information | 0 (0.0%) | 0 (0.0%) |
| Finance & Insurance | 0 (0.0%) | 0 (0.0%) |
| Real Estate, Rental & Leasing | 0 (0.0%) | 0 (0.0%) |
| Professional & Scientific | 29 (100.0%) | 0 (0.0%) |
| Enterprise Management | 0 (0.0%) | 0 (0.0%) |
| Administrative & Support | 43 (100.0%) | 0 (0.0%) |
| Educational Services | 0 (0.0%) | 76 (100.0%) |
| Health Care & Social Assistance | 0 (0.0%) | 21 (100.0%) |
| Arts, Entertainment & Recreation | 0 (0.0%) | 0 (0.0%) |
| Accommodation & Food Services | 0 (0.0%) | 0 (0.0%) |
| Public Administration | 0 (0.0%) | 0 (0.0%) |
| Total | 147 (60.3%) | 97 (39.8%) |
Education in Springville
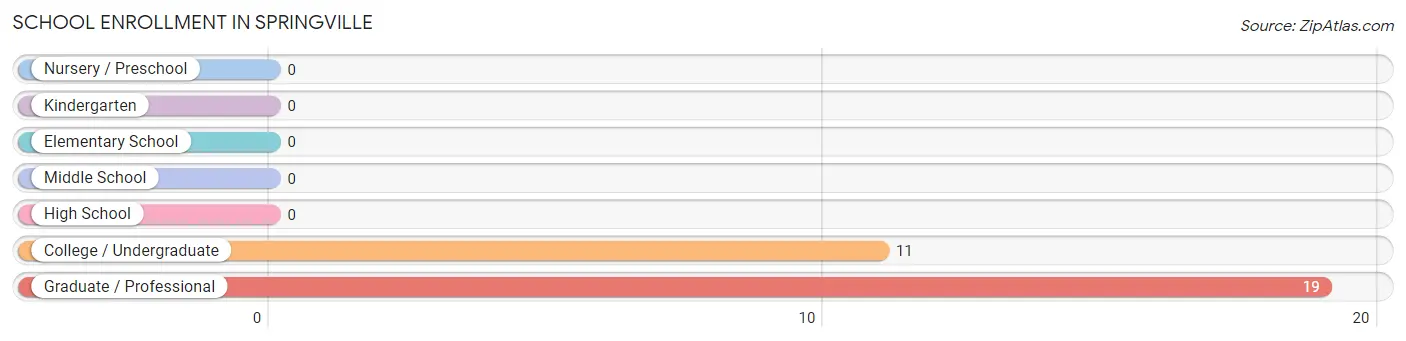
School Enrollment in Springville
The most common levels of schooling among the 30 students in Springville are graduate / professional (19 | 63.3%), and college / undergraduate (11 | 36.7%).
| School Level | # Students | % Students |
| Nursery / Preschool | 0 | 0.0% |
| Kindergarten | 0 | 0.0% |
| Elementary School | 0 | 0.0% |
| Middle School | 0 | 0.0% |
| High School | 0 | 0.0% |
| College / Undergraduate | 11 | 36.7% |
| Graduate / Professional | 19 | 63.3% |
| Total | 30 | 100.0% |
School Enrollment by Age by Funding Source in Springville
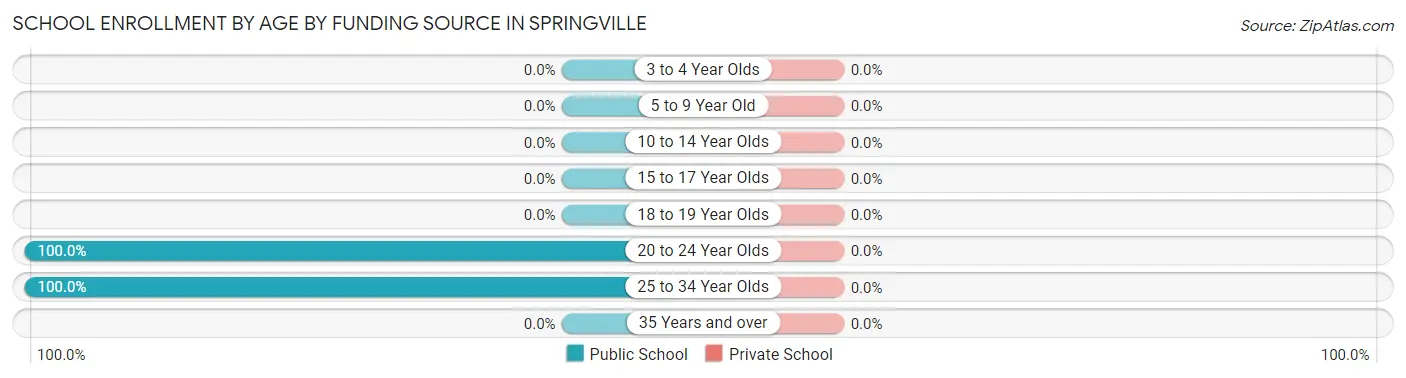
| Age Bracket | Public School | Private School |
| 3 to 4 Year Olds | 0 (0.0%) | 0 (0.0%) |
| 5 to 9 Year Old | 0 (0.0%) | 0 (0.0%) |
| 10 to 14 Year Olds | 0 (0.0%) | 0 (0.0%) |
| 15 to 17 Year Olds | 0 (0.0%) | 0 (0.0%) |
| 18 to 19 Year Olds | 0 (0.0%) | 0 (0.0%) |
| 20 to 24 Year Olds | 11 (100.0%) | 0 (0.0%) |
| 25 to 34 Year Olds | 19 (100.0%) | 0 (0.0%) |
| 35 Years and over | 0 (0.0%) | 0 (0.0%) |
| Total | 30 (100.0%) | 0 (0.0%) |
Educational Attainment by Field of Study in Springville
Science & technology (45 | 26.3%), arts & humanities (38 | 22.2%), bio, nature & agricultural (37 | 21.6%), computers & mathematics (30 | 17.5%), and business (21 | 12.3%) are the most common fields of study among 171 individuals in Springville who have obtained a bachelor's degree or higher.
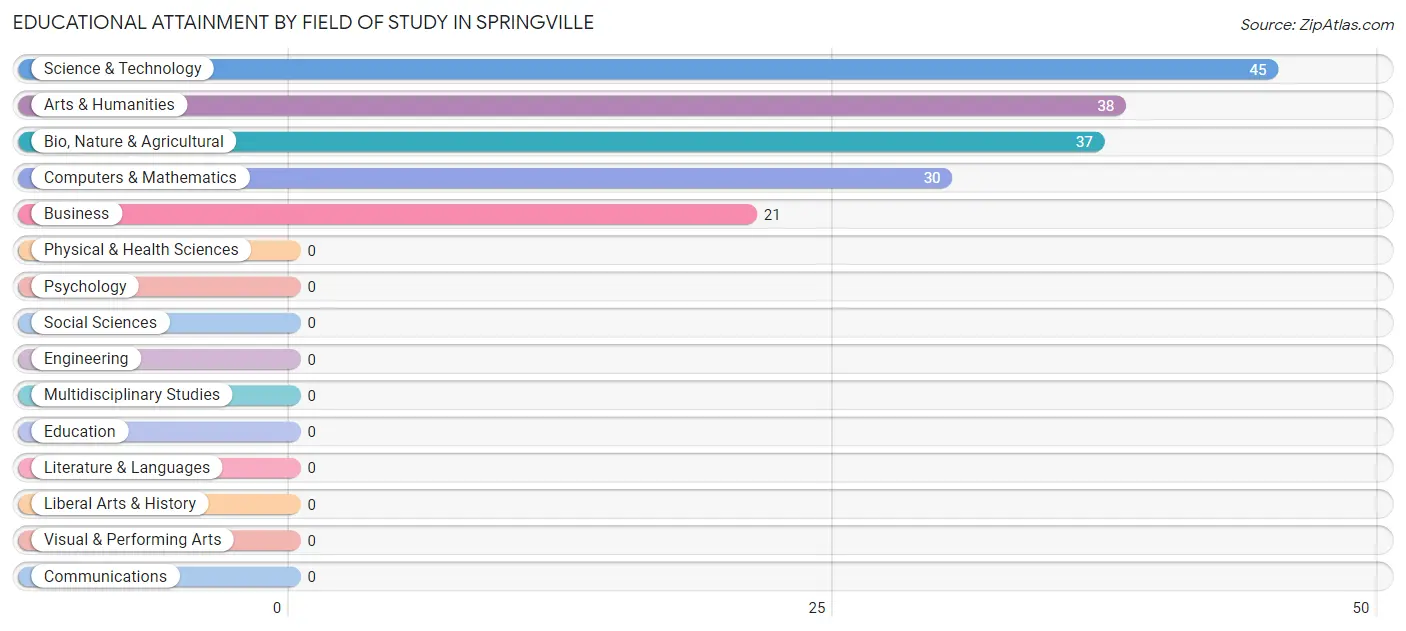
| Field of Study | # Graduates | % Graduates |
| Computers & Mathematics | 30 | 17.5% |
| Bio, Nature & Agricultural | 37 | 21.6% |
| Physical & Health Sciences | 0 | 0.0% |
| Psychology | 0 | 0.0% |
| Social Sciences | 0 | 0.0% |
| Engineering | 0 | 0.0% |
| Multidisciplinary Studies | 0 | 0.0% |
| Science & Technology | 45 | 26.3% |
| Business | 21 | 12.3% |
| Education | 0 | 0.0% |
| Literature & Languages | 0 | 0.0% |
| Liberal Arts & History | 0 | 0.0% |
| Visual & Performing Arts | 0 | 0.0% |
| Communications | 0 | 0.0% |
| Arts & Humanities | 38 | 22.2% |
| Total | 171 | 100.0% |
Transportation & Commute in Springville
Vehicle Availability by Sex in Springville
The most prevalent vehicle ownership categories in Springville are males with 3 vehicles (85, accounting for 57.8%) and females with 3 vehicles (0, making up 87.6%).
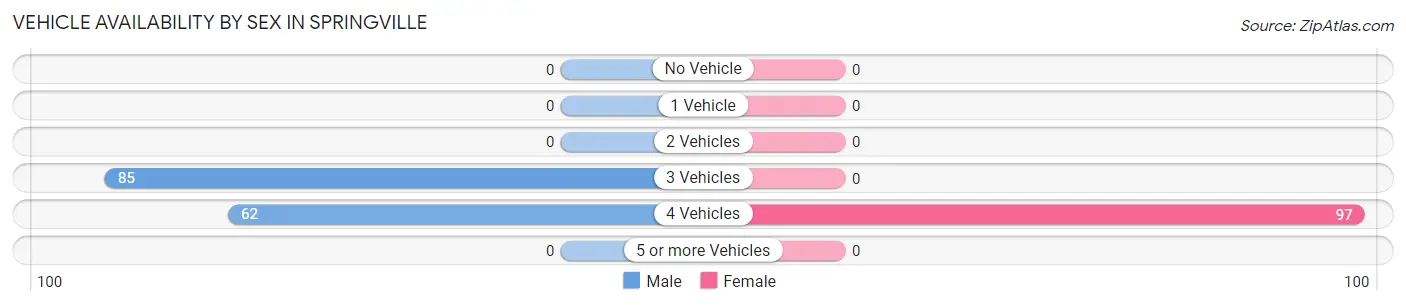
| Vehicles Available | Male | Female |
| No Vehicle | 0 (0.0%) | 0 (0.0%) |
| 1 Vehicle | 0 (0.0%) | 0 (0.0%) |
| 2 Vehicles | 0 (0.0%) | 0 (0.0%) |
| 3 Vehicles | 85 (57.8%) | 0 (0.0%) |
| 4 Vehicles | 62 (42.2%) | 97 (100.0%) |
| 5 or more Vehicles | 0 (0.0%) | 0 (0.0%) |
| Total | 147 (100.0%) | 97 (100.0%) |
Commute Time in Springville
The most frequently occuring commute durations in Springville are 20 to 24 minutes (97 commuters, 39.8%), 30 to 34 minutes (73 commuters, 29.9%), and 15 to 19 minutes (44 commuters, 18.0%).
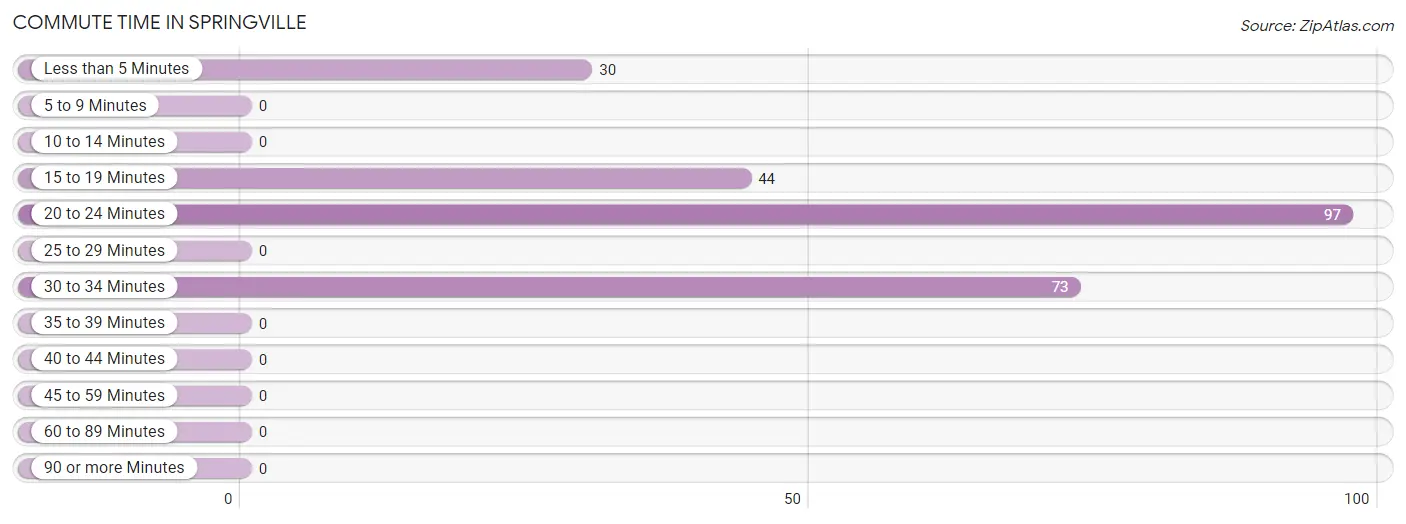
| Commute Time | # Commuters | % Commuters |
| Less than 5 Minutes | 30 | 12.3% |
| 5 to 9 Minutes | 0 | 0.0% |
| 10 to 14 Minutes | 0 | 0.0% |
| 15 to 19 Minutes | 44 | 18.0% |
| 20 to 24 Minutes | 97 | 39.8% |
| 25 to 29 Minutes | 0 | 0.0% |
| 30 to 34 Minutes | 73 | 29.9% |
| 35 to 39 Minutes | 0 | 0.0% |
| 40 to 44 Minutes | 0 | 0.0% |
| 45 to 59 Minutes | 0 | 0.0% |
| 60 to 89 Minutes | 0 | 0.0% |
| 90 or more Minutes | 0 | 0.0% |
Commute Time by Sex in Springville
The most common commute times in Springville are 30 to 34 minutes (73 commuters, 49.7%) for males and 20 to 24 minutes (97 commuters, 100.0%) for females.
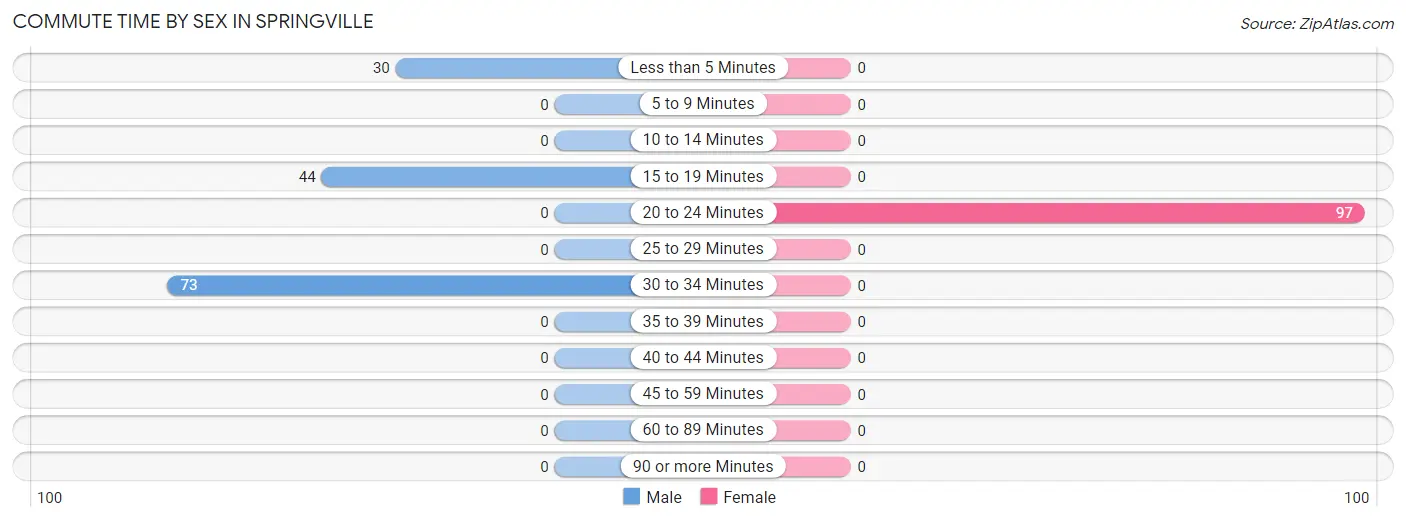
| Commute Time | Male | Female |
| Less than 5 Minutes | 30 (20.4%) | 0 (0.0%) |
| 5 to 9 Minutes | 0 (0.0%) | 0 (0.0%) |
| 10 to 14 Minutes | 0 (0.0%) | 0 (0.0%) |
| 15 to 19 Minutes | 44 (29.9%) | 0 (0.0%) |
| 20 to 24 Minutes | 0 (0.0%) | 97 (100.0%) |
| 25 to 29 Minutes | 0 (0.0%) | 0 (0.0%) |
| 30 to 34 Minutes | 73 (49.7%) | 0 (0.0%) |
| 35 to 39 Minutes | 0 (0.0%) | 0 (0.0%) |
| 40 to 44 Minutes | 0 (0.0%) | 0 (0.0%) |
| 45 to 59 Minutes | 0 (0.0%) | 0 (0.0%) |
| 60 to 89 Minutes | 0 (0.0%) | 0 (0.0%) |
| 90 or more Minutes | 0 (0.0%) | 0 (0.0%) |
Time of Departure to Work by Sex in Springville
The most frequent times of departure to work in Springville are 7:00 AM to 7:29 AM (77, 52.4%) for males and 7:30 AM to 7:59 AM (38, 39.2%) for females.
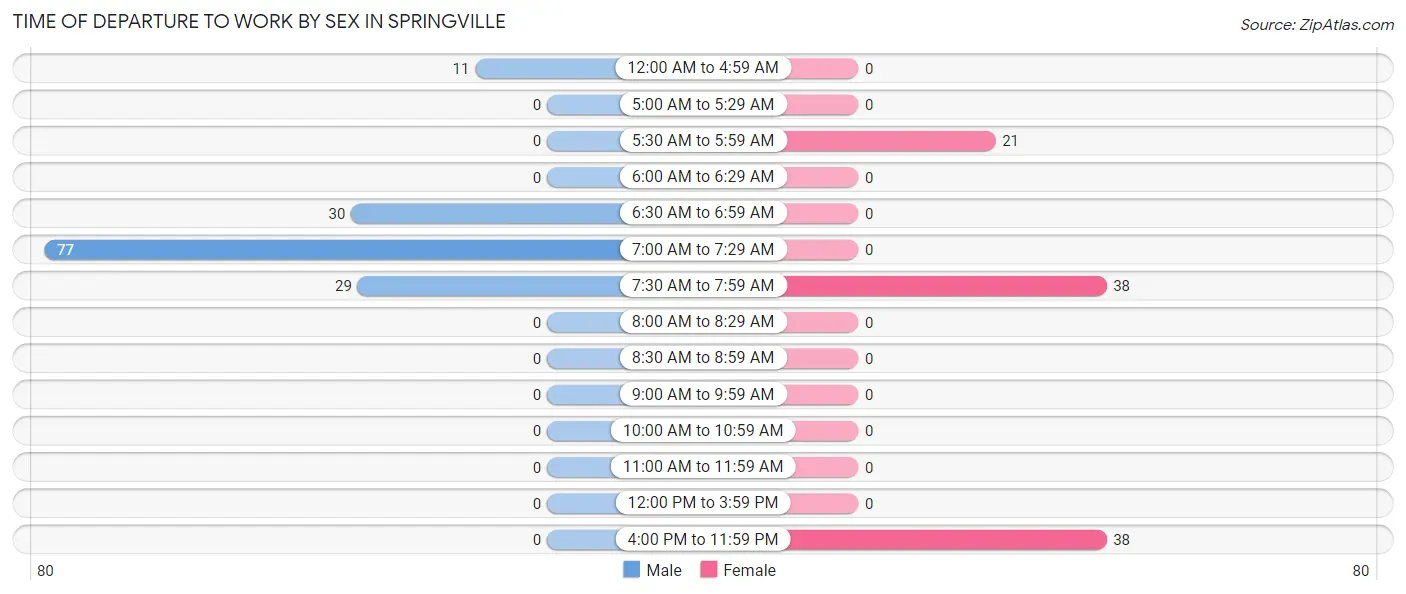
| Time of Departure | Male | Female |
| 12:00 AM to 4:59 AM | 11 (7.5%) | 0 (0.0%) |
| 5:00 AM to 5:29 AM | 0 (0.0%) | 0 (0.0%) |
| 5:30 AM to 5:59 AM | 0 (0.0%) | 21 (21.6%) |
| 6:00 AM to 6:29 AM | 0 (0.0%) | 0 (0.0%) |
| 6:30 AM to 6:59 AM | 30 (20.4%) | 0 (0.0%) |
| 7:00 AM to 7:29 AM | 77 (52.4%) | 0 (0.0%) |
| 7:30 AM to 7:59 AM | 29 (19.7%) | 38 (39.2%) |
| 8:00 AM to 8:29 AM | 0 (0.0%) | 0 (0.0%) |
| 8:30 AM to 8:59 AM | 0 (0.0%) | 0 (0.0%) |
| 9:00 AM to 9:59 AM | 0 (0.0%) | 0 (0.0%) |
| 10:00 AM to 10:59 AM | 0 (0.0%) | 0 (0.0%) |
| 11:00 AM to 11:59 AM | 0 (0.0%) | 0 (0.0%) |
| 12:00 PM to 3:59 PM | 0 (0.0%) | 0 (0.0%) |
| 4:00 PM to 11:59 PM | 0 (0.0%) | 38 (39.2%) |
| Total | 147 (100.0%) | 97 (100.0%) |
Housing Occupancy in Springville
Occupancy by Ownership in Springville
Of the total 177 dwellings in Springville, owner-occupied units account for 177 (100.0%), while renter-occupied units make up 0 (0.0%).
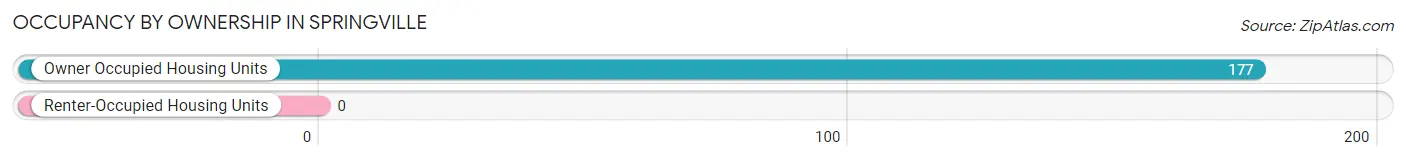
| Occupancy | # Housing Units | % Housing Units |
| Owner Occupied Housing Units | 177 | 100.0% |
| Renter-Occupied Housing Units | 0 | 0.0% |
| Total Occupied Housing Units | 177 | 100.0% |
Occupancy by Household Size in Springville
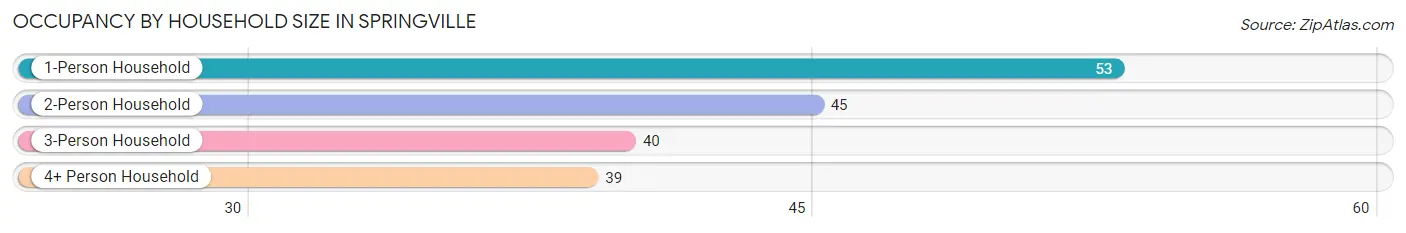
| Household Size | # Housing Units | % Housing Units |
| 1-Person Household | 53 | 29.9% |
| 2-Person Household | 45 | 25.4% |
| 3-Person Household | 40 | 22.6% |
| 4+ Person Household | 39 | 22.0% |
| Total Housing Units | 177 | 100.0% |
Occupancy by Ownership by Household Size in Springville
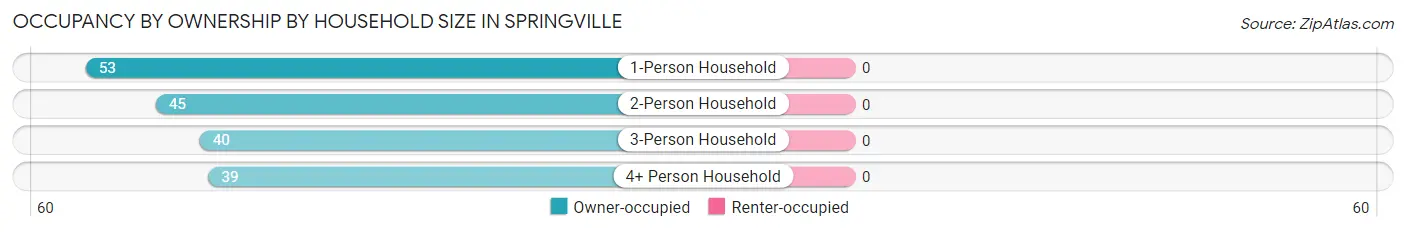
| Household Size | Owner-occupied | Renter-occupied |
| 1-Person Household | 53 (100.0%) | 0 (0.0%) |
| 2-Person Household | 45 (100.0%) | 0 (0.0%) |
| 3-Person Household | 40 (100.0%) | 0 (0.0%) |
| 4+ Person Household | 39 (100.0%) | 0 (0.0%) |
| Total Housing Units | 177 (100.0%) | 0 (0.0%) |
Occupancy by Educational Attainment in Springville
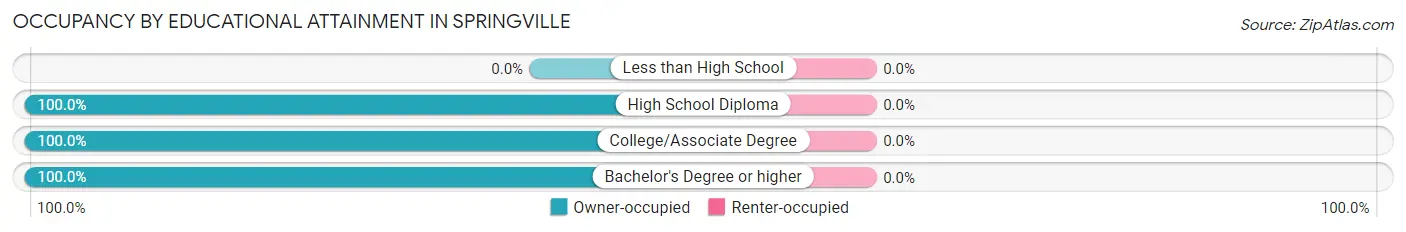
| Household Size | Owner-occupied | Renter-occupied |
| Less than High School | 0 (0.0%) | 0 (0.0%) |
| High School Diploma | 11 (100.0%) | 0 (0.0%) |
| College/Associate Degree | 107 (100.0%) | 0 (0.0%) |
| Bachelor's Degree or higher | 59 (100.0%) | 0 (0.0%) |
Occupancy by Age of Householder in Springville
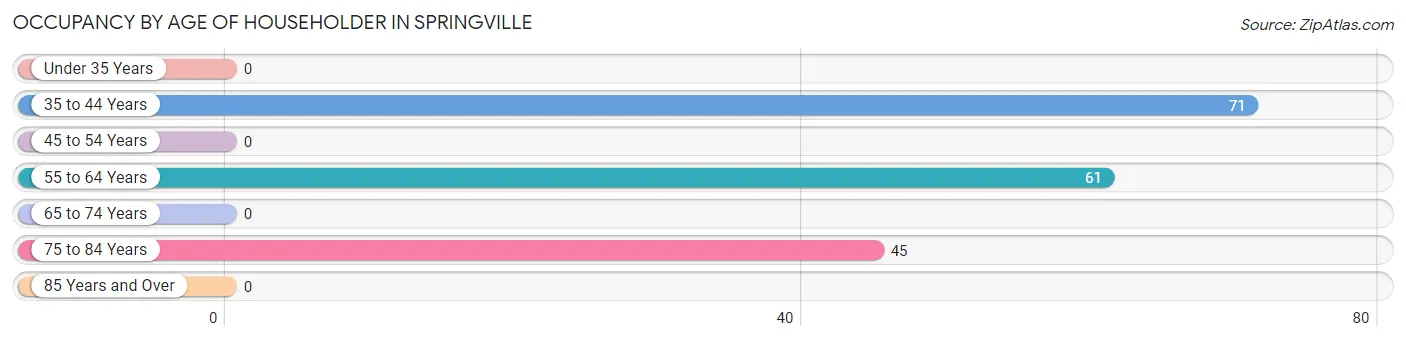
| Age Bracket | # Households | % Households |
| Under 35 Years | 0 | 0.0% |
| 35 to 44 Years | 71 | 40.1% |
| 45 to 54 Years | 0 | 0.0% |
| 55 to 64 Years | 61 | 34.5% |
| 65 to 74 Years | 0 | 0.0% |
| 75 to 84 Years | 45 | 25.4% |
| 85 Years and Over | 0 | 0.0% |
| Total | 177 | 100.0% |
Housing Finances in Springville
Median Income by Occupancy in Springville
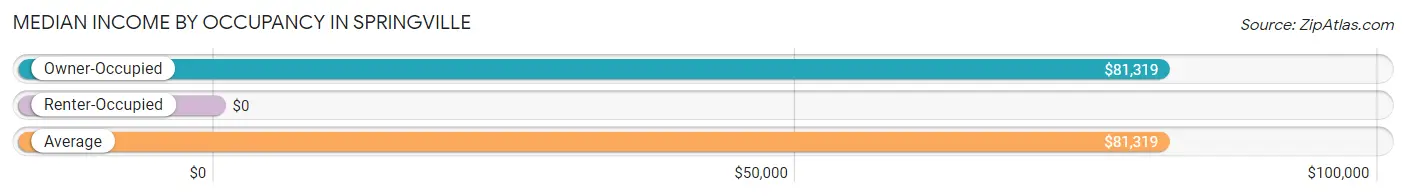
| Occupancy Type | # Households | Median Income |
| Owner-Occupied | 177 (100.0%) | $81,319 |
| Renter-Occupied | 0 (0.0%) | $0 |
| Average | 177 (100.0%) | $81,319 |
Occupancy by Householder Income Bracket in Springville
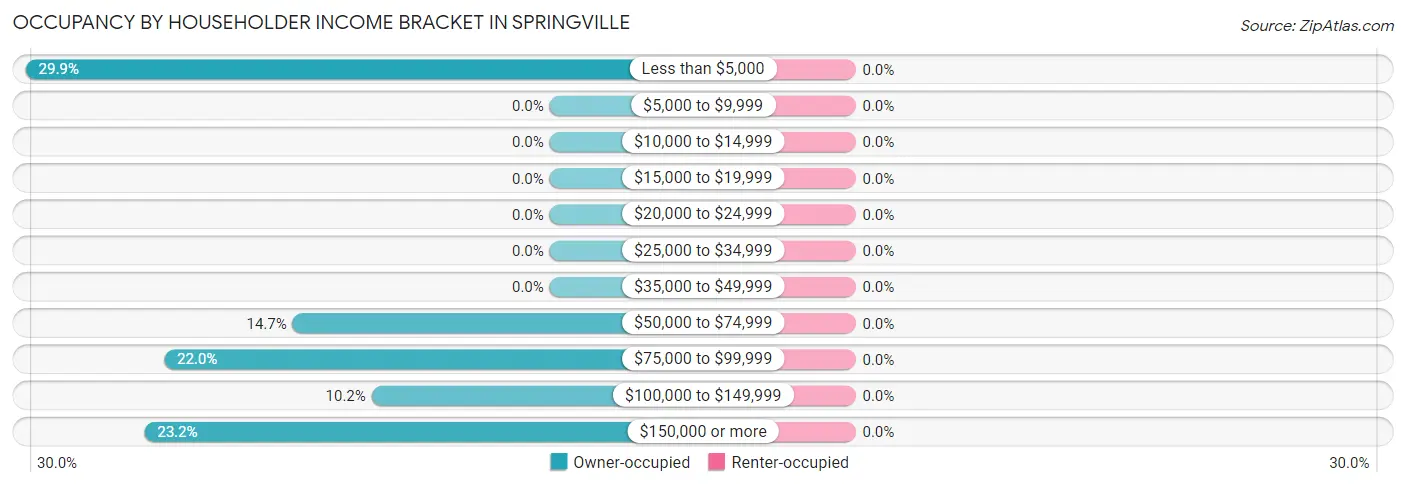
| Income Bracket | Owner-occupied | Renter-occupied |
| Less than $5,000 | 53 (29.9%) | 0 (0.0%) |
| $5,000 to $9,999 | 0 (0.0%) | 0 (0.0%) |
| $10,000 to $14,999 | 0 (0.0%) | 0 (0.0%) |
| $15,000 to $19,999 | 0 (0.0%) | 0 (0.0%) |
| $20,000 to $24,999 | 0 (0.0%) | 0 (0.0%) |
| $25,000 to $34,999 | 0 (0.0%) | 0 (0.0%) |
| $35,000 to $49,999 | 0 (0.0%) | 0 (0.0%) |
| $50,000 to $74,999 | 26 (14.7%) | 0 (0.0%) |
| $75,000 to $99,999 | 39 (22.0%) | 0 (0.0%) |
| $100,000 to $149,999 | 18 (10.2%) | 0 (0.0%) |
| $150,000 or more | 41 (23.2%) | 0 (0.0%) |
| Total | 177 (100.0%) | 0 (0.0%) |
Monthly Housing Cost Tiers in Springville
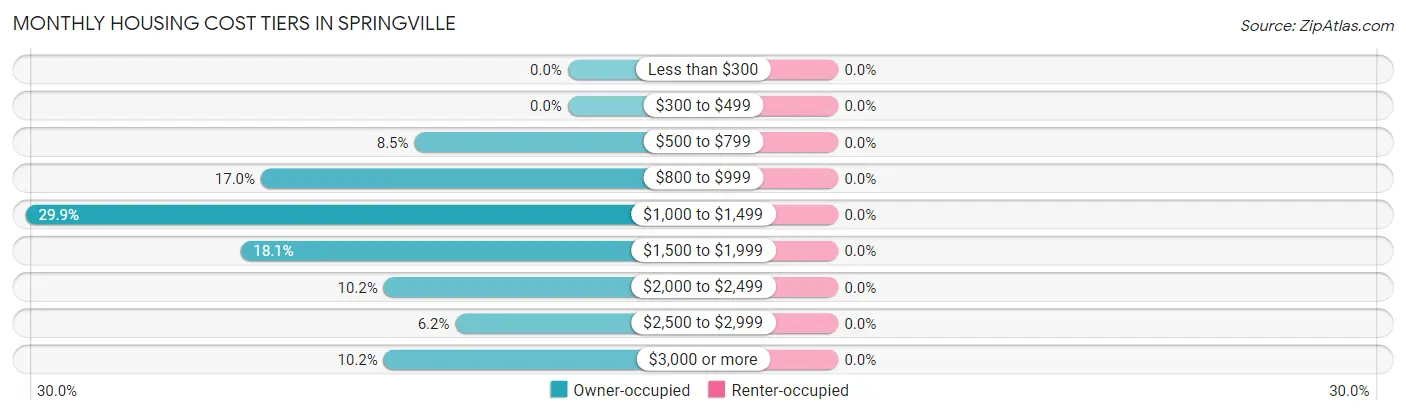
| Monthly Cost | Owner-occupied | Renter-occupied |
| Less than $300 | 0 (0.0%) | 0 (0.0%) |
| $300 to $499 | 0 (0.0%) | 0 (0.0%) |
| $500 to $799 | 15 (8.5%) | 0 (0.0%) |
| $800 to $999 | 30 (17.0%) | 0 (0.0%) |
| $1,000 to $1,499 | 53 (29.9%) | 0 (0.0%) |
| $1,500 to $1,999 | 32 (18.1%) | 0 (0.0%) |
| $2,000 to $2,499 | 18 (10.2%) | 0 (0.0%) |
| $2,500 to $2,999 | 11 (6.2%) | 0 (0.0%) |
| $3,000 or more | 18 (10.2%) | 0 (0.0%) |
| Total | 177 (100.0%) | 0 (0.0%) |
Physical Housing Characteristics in Springville
Housing Structures in Springville
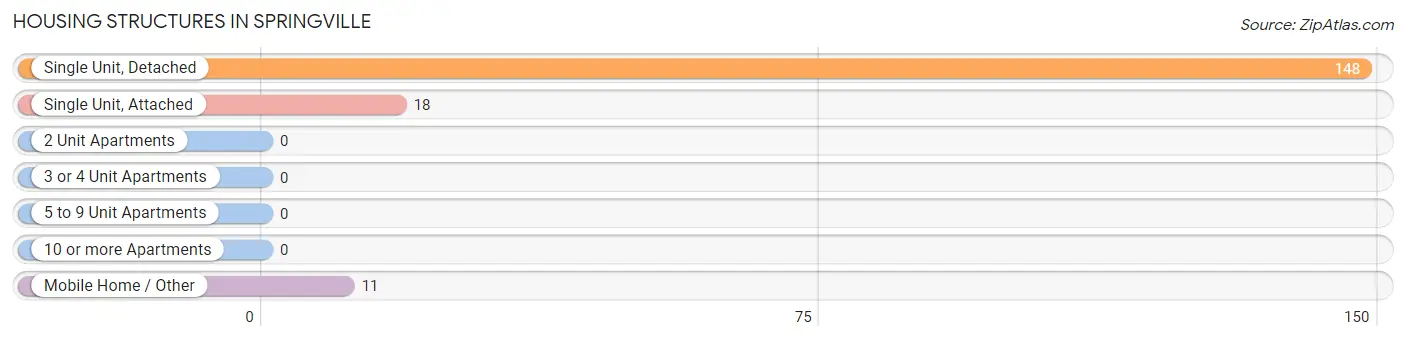
| Structure Type | # Housing Units | % Housing Units |
| Single Unit, Detached | 148 | 83.6% |
| Single Unit, Attached | 18 | 10.2% |
| 2 Unit Apartments | 0 | 0.0% |
| 3 or 4 Unit Apartments | 0 | 0.0% |
| 5 to 9 Unit Apartments | 0 | 0.0% |
| 10 or more Apartments | 0 | 0.0% |
| Mobile Home / Other | 11 | 6.2% |
| Total | 177 | 100.0% |
Housing Structures by Occupancy in Springville
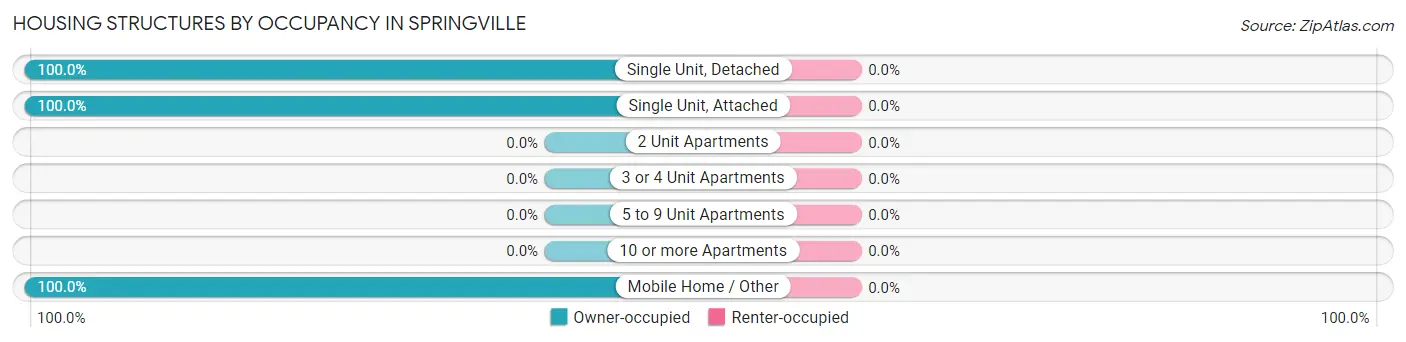
| Structure Type | Owner-occupied | Renter-occupied |
| Single Unit, Detached | 148 (100.0%) | 0 (0.0%) |
| Single Unit, Attached | 18 (100.0%) | 0 (0.0%) |
| 2 Unit Apartments | 0 (0.0%) | 0 (0.0%) |
| 3 or 4 Unit Apartments | 0 (0.0%) | 0 (0.0%) |
| 5 to 9 Unit Apartments | 0 (0.0%) | 0 (0.0%) |
| 10 or more Apartments | 0 (0.0%) | 0 (0.0%) |
| Mobile Home / Other | 11 (100.0%) | 0 (0.0%) |
| Total | 177 (100.0%) | 0 (0.0%) |
Housing Structures by Number of Rooms in Springville
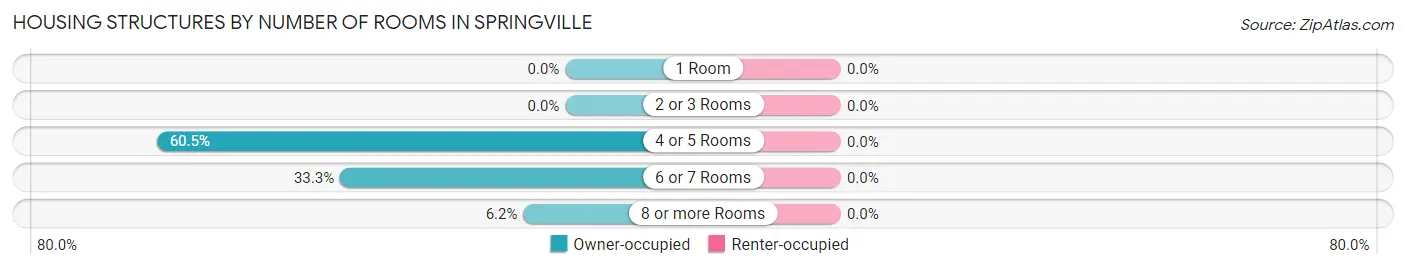
| Number of Rooms | Owner-occupied | Renter-occupied |
| 1 Room | 0 (0.0%) | 0 (0.0%) |
| 2 or 3 Rooms | 0 (0.0%) | 0 (0.0%) |
| 4 or 5 Rooms | 107 (60.5%) | 0 (0.0%) |
| 6 or 7 Rooms | 59 (33.3%) | 0 (0.0%) |
| 8 or more Rooms | 11 (6.2%) | 0 (0.0%) |
| Total | 177 (100.0%) | 0 (0.0%) |
Housing Structure by Heating Type in Springville
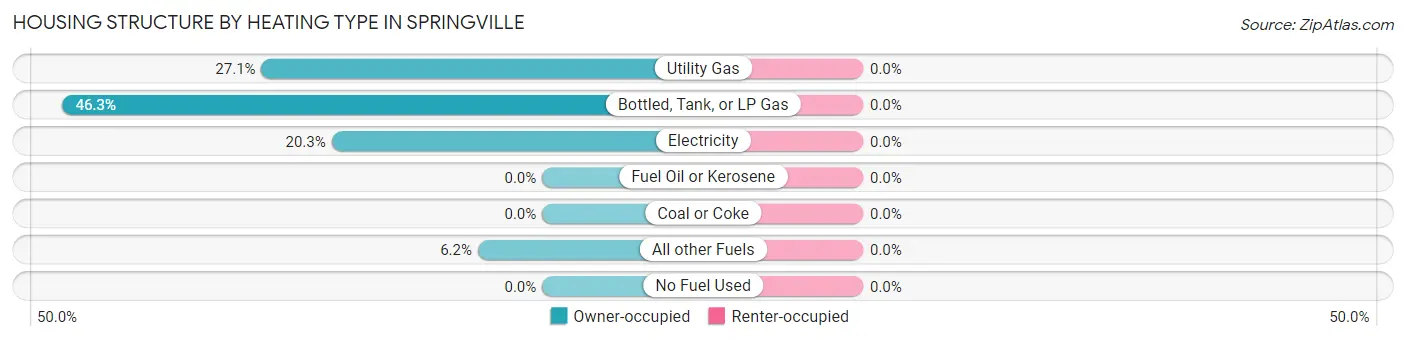
| Heating Type | Owner-occupied | Renter-occupied |
| Utility Gas | 48 (27.1%) | 0 (0.0%) |
| Bottled, Tank, or LP Gas | 82 (46.3%) | 0 (0.0%) |
| Electricity | 36 (20.3%) | 0 (0.0%) |
| Fuel Oil or Kerosene | 0 (0.0%) | 0 (0.0%) |
| Coal or Coke | 0 (0.0%) | 0 (0.0%) |
| All other Fuels | 11 (6.2%) | 0 (0.0%) |
| No Fuel Used | 0 (0.0%) | 0 (0.0%) |
| Total | 177 (100.0%) | 0 (0.0%) |
Household Vehicle Usage in Springville
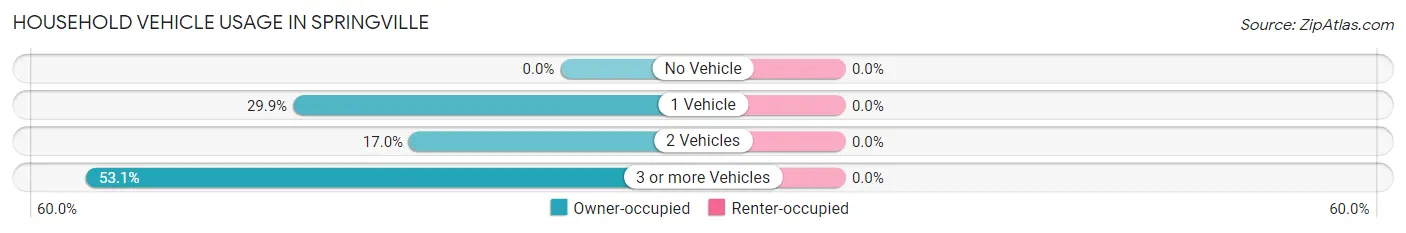
| Vehicles per Household | Owner-occupied | Renter-occupied |
| No Vehicle | 0 (0.0%) | 0 (0.0%) |
| 1 Vehicle | 53 (29.9%) | 0 (0.0%) |
| 2 Vehicles | 30 (17.0%) | 0 (0.0%) |
| 3 or more Vehicles | 94 (53.1%) | 0 (0.0%) |
| Total | 177 (100.0%) | 0 (0.0%) |
Real Estate & Mortgages in Springville
Real Estate and Mortgage Overview in Springville
| Characteristic | Without Mortgage | With Mortgage |
| Housing Units | 45 | 132 |
| Median Property Value | - | - |
| Median Household Income | - | - |
| Monthly Housing Costs | - | - |
| Real Estate Taxes | - | - |
Property Value by Mortgage Status in Springville
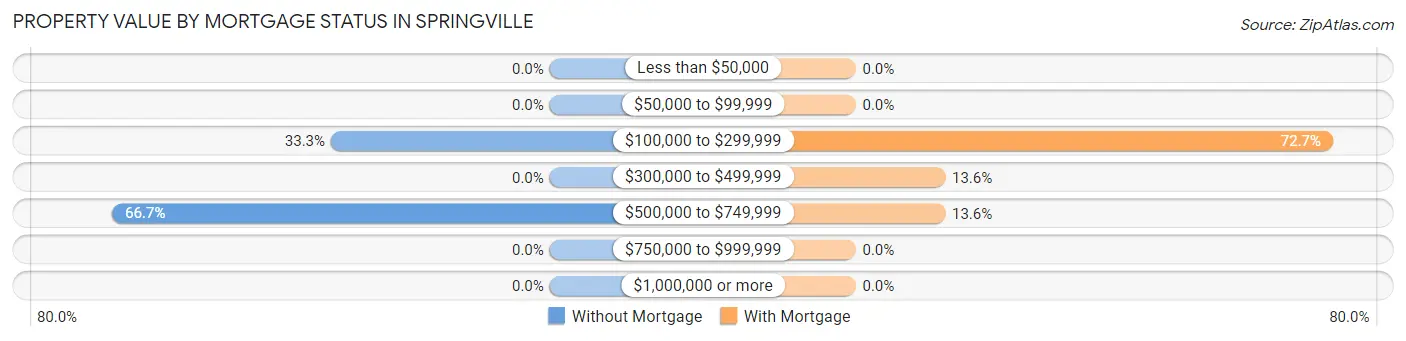
| Property Value | Without Mortgage | With Mortgage |
| Less than $50,000 | 0 (0.0%) | 0 (0.0%) |
| $50,000 to $99,999 | 0 (0.0%) | 0 (0.0%) |
| $100,000 to $299,999 | 15 (33.3%) | 96 (72.7%) |
| $300,000 to $499,999 | 0 (0.0%) | 18 (13.6%) |
| $500,000 to $749,999 | 30 (66.7%) | 18 (13.6%) |
| $750,000 to $999,999 | 0 (0.0%) | 0 (0.0%) |
| $1,000,000 or more | 0 (0.0%) | 0 (0.0%) |
| Total | 45 (100.0%) | 132 (100.0%) |
Household Income by Mortgage Status in Springville
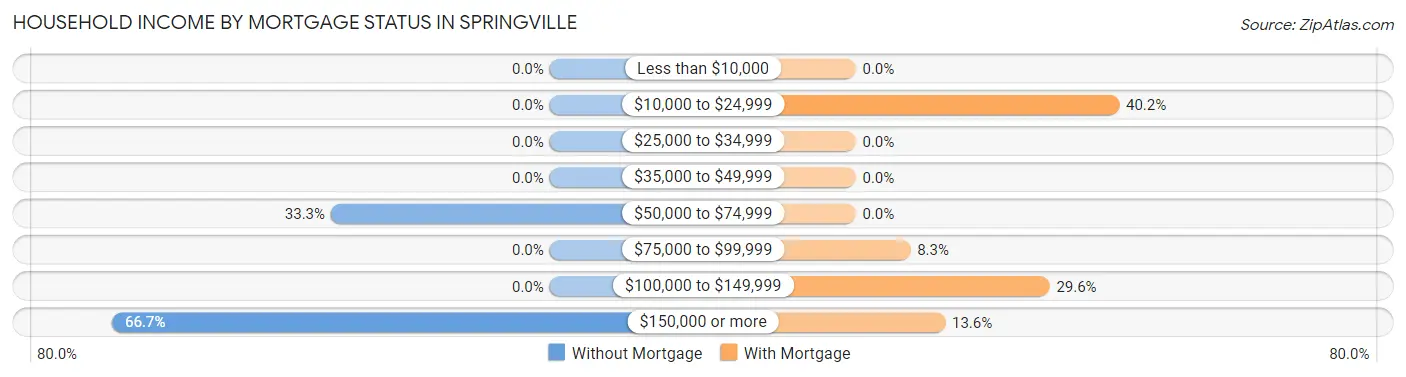
| Household Income | Without Mortgage | With Mortgage |
| Less than $10,000 | 0 (0.0%) | 0 (0.0%) |
| $10,000 to $24,999 | 0 (0.0%) | 53 (40.2%) |
| $25,000 to $34,999 | 0 (0.0%) | 0 (0.0%) |
| $35,000 to $49,999 | 0 (0.0%) | 0 (0.0%) |
| $50,000 to $74,999 | 15 (33.3%) | 0 (0.0%) |
| $75,000 to $99,999 | 0 (0.0%) | 11 (8.3%) |
| $100,000 to $149,999 | 0 (0.0%) | 39 (29.5%) |
| $150,000 or more | 30 (66.7%) | 18 (13.6%) |
| Total | 45 (100.0%) | 132 (100.0%) |
Property Value to Household Income Ratio in Springville
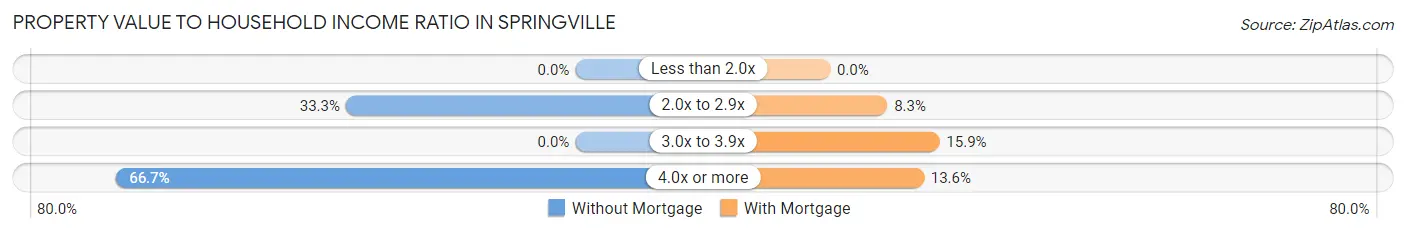
| Value-to-Income Ratio | Without Mortgage | With Mortgage |
| Less than 2.0x | 0 (0.0%) | 0 (0.0%) |
| 2.0x to 2.9x | 15 (33.3%) | 11 (8.3%) |
| 3.0x to 3.9x | 0 (0.0%) | 21 (15.9%) |
| 4.0x or more | 30 (66.7%) | 18 (13.6%) |
| Total | 45 (100.0%) | 132 (100.0%) |
Real Estate Taxes by Mortgage Status in Springville
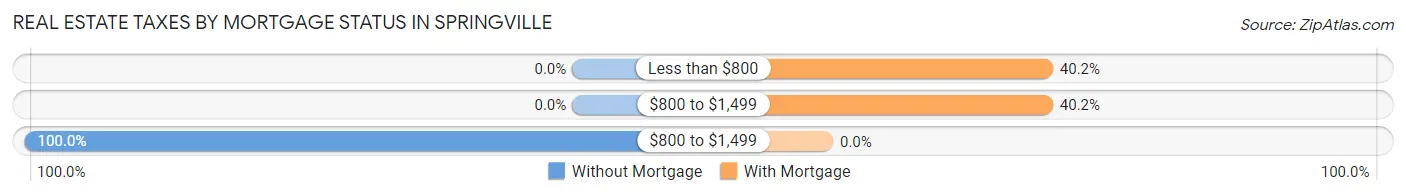
| Property Taxes | Without Mortgage | With Mortgage |
| Less than $800 | 0 (0.0%) | 53 (40.2%) |
| $800 to $1,499 | 0 (0.0%) | 53 (40.2%) |
| $800 to $1,499 | 45 (100.0%) | 0 (0.0%) |
| Total | 45 (100.0%) | 132 (100.0%) |
Health & Disability in Springville
Health Insurance Coverage by Age in Springville
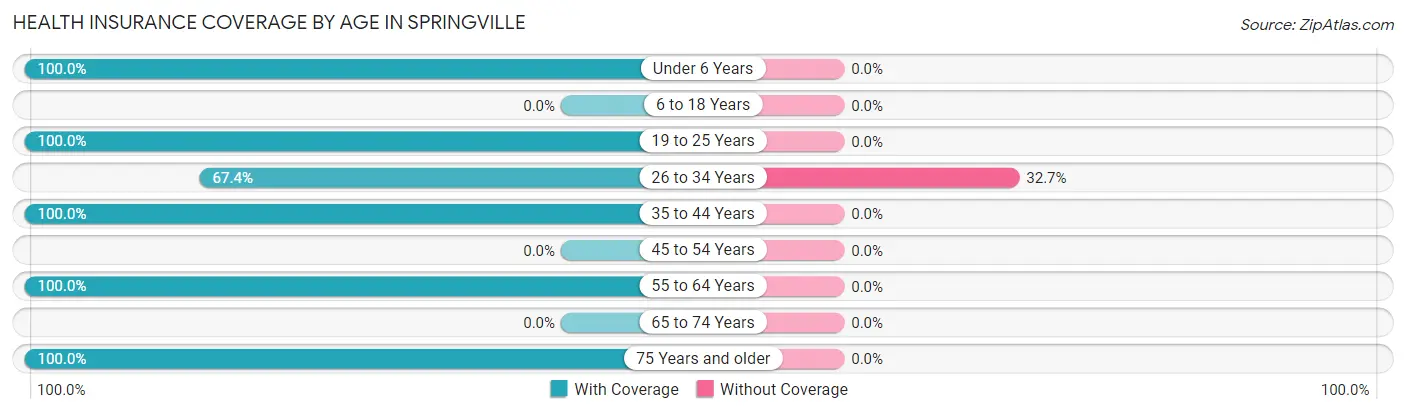
| Age Bracket | With Coverage | Without Coverage |
| Under 6 Years | 51 (100.0%) | 0 (0.0%) |
| 6 to 18 Years | 0 (0.0%) | 0 (0.0%) |
| 19 to 25 Years | 26 (100.0%) | 0 (0.0%) |
| 26 to 34 Years | 132 (67.3%) | 64 (32.7%) |
| 35 to 44 Years | 71 (100.0%) | 0 (0.0%) |
| 45 to 54 Years | 0 (0.0%) | 0 (0.0%) |
| 55 to 64 Years | 61 (100.0%) | 0 (0.0%) |
| 65 to 74 Years | 0 (0.0%) | 0 (0.0%) |
| 75 Years and older | 103 (100.0%) | 0 (0.0%) |
| Total | 444 (87.4%) | 64 (12.6%) |
Health Insurance Coverage by Citizenship Status in Springville
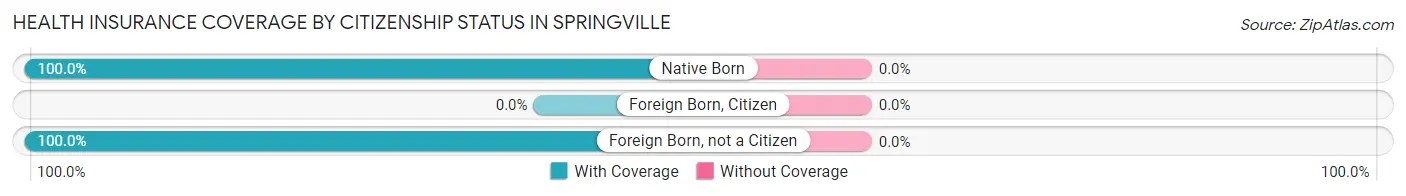
| Citizenship Status | With Coverage | Without Coverage |
| Native Born | 51 (100.0%) | 0 (0.0%) |
| Foreign Born, Citizen | 0 (0.0%) | 0 (0.0%) |
| Foreign Born, not a Citizen | 26 (100.0%) | 0 (0.0%) |
Health Insurance Coverage by Household Income in Springville
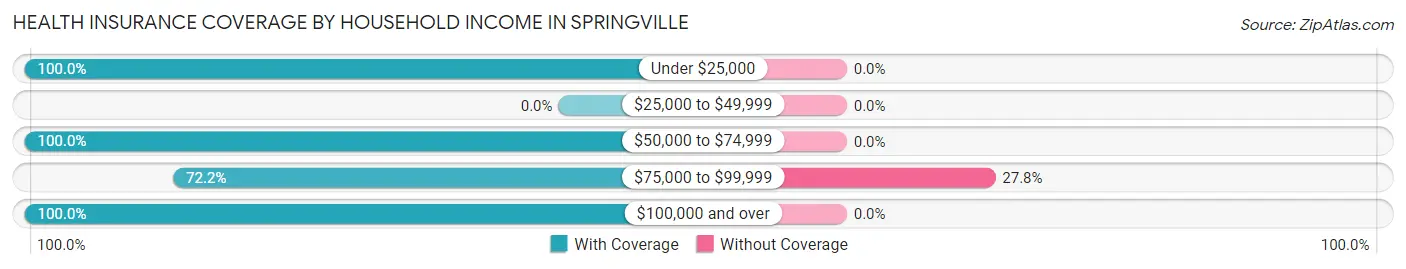
| Household Income | With Coverage | Without Coverage |
| Under $25,000 | 53 (100.0%) | 0 (0.0%) |
| $25,000 to $49,999 | 0 (0.0%) | 0 (0.0%) |
| $50,000 to $74,999 | 68 (100.0%) | 0 (0.0%) |
| $75,000 to $99,999 | 166 (72.2%) | 64 (27.8%) |
| $100,000 and over | 157 (100.0%) | 0 (0.0%) |
Public vs Private Health Insurance Coverage by Age in Springville
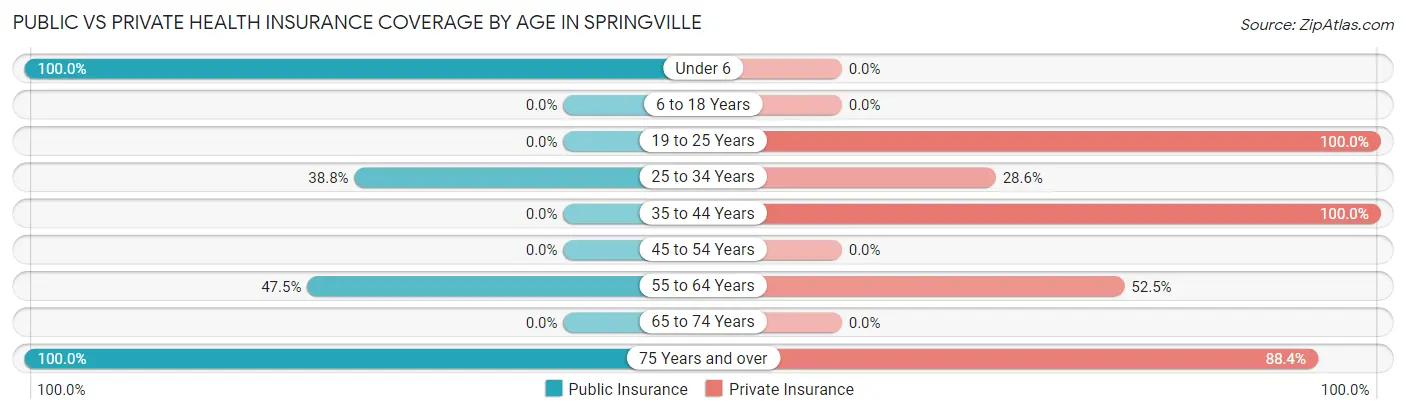
| Age Bracket | Public Insurance | Private Insurance |
| Under 6 | 51 (100.0%) | 0 (0.0%) |
| 6 to 18 Years | 0 (0.0%) | 0 (0.0%) |
| 19 to 25 Years | 0 (0.0%) | 26 (100.0%) |
| 25 to 34 Years | 76 (38.8%) | 56 (28.6%) |
| 35 to 44 Years | 0 (0.0%) | 71 (100.0%) |
| 45 to 54 Years | 0 (0.0%) | 0 (0.0%) |
| 55 to 64 Years | 29 (47.5%) | 32 (52.5%) |
| 65 to 74 Years | 0 (0.0%) | 0 (0.0%) |
| 75 Years and over | 103 (100.0%) | 91 (88.3%) |
| Total | 259 (51.0%) | 276 (54.3%) |
Disability Status by Sex by Age in Springville
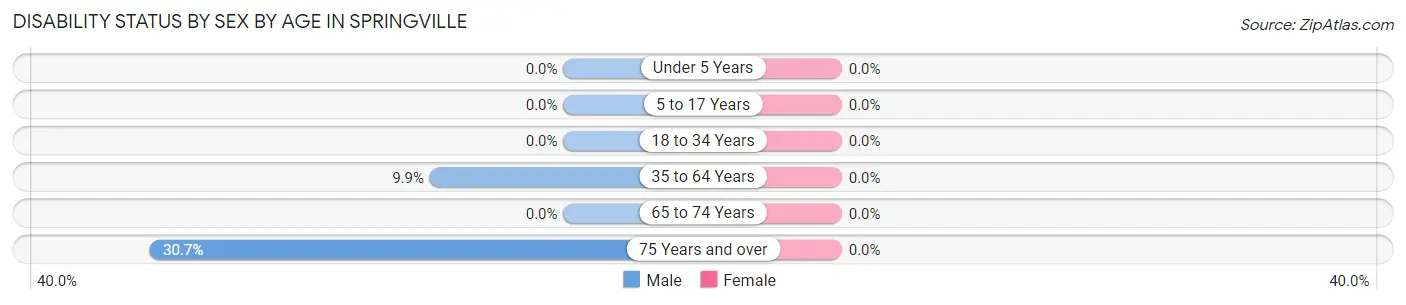
| Age Bracket | Male | Female |
| Under 5 Years | 0 (0.0%) | 0 (0.0%) |
| 5 to 17 Years | 0 (0.0%) | 0 (0.0%) |
| 18 to 34 Years | 0 (0.0%) | 0 (0.0%) |
| 35 to 64 Years | 11 (9.9%) | 0 (0.0%) |
| 65 to 74 Years | 0 (0.0%) | 0 (0.0%) |
| 75 Years and over | 27 (30.7%) | 0 (0.0%) |
Disability Class by Sex by Age in Springville
Disability Class: Hearing Difficulty
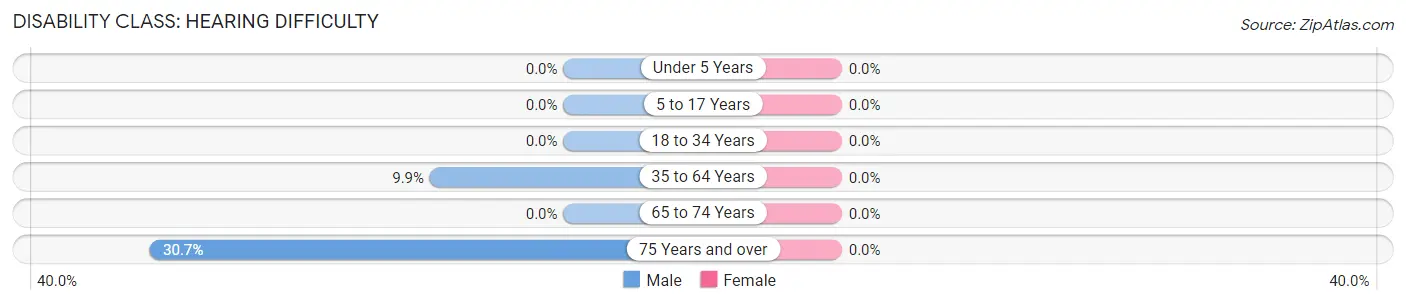
| Age Bracket | Male | Female |
| Under 5 Years | 0 (0.0%) | 0 (0.0%) |
| 5 to 17 Years | 0 (0.0%) | 0 (0.0%) |
| 18 to 34 Years | 0 (0.0%) | 0 (0.0%) |
| 35 to 64 Years | 11 (9.9%) | 0 (0.0%) |
| 65 to 74 Years | 0 (0.0%) | 0 (0.0%) |
| 75 Years and over | 27 (30.7%) | 0 (0.0%) |
Disability Class: Vision Difficulty
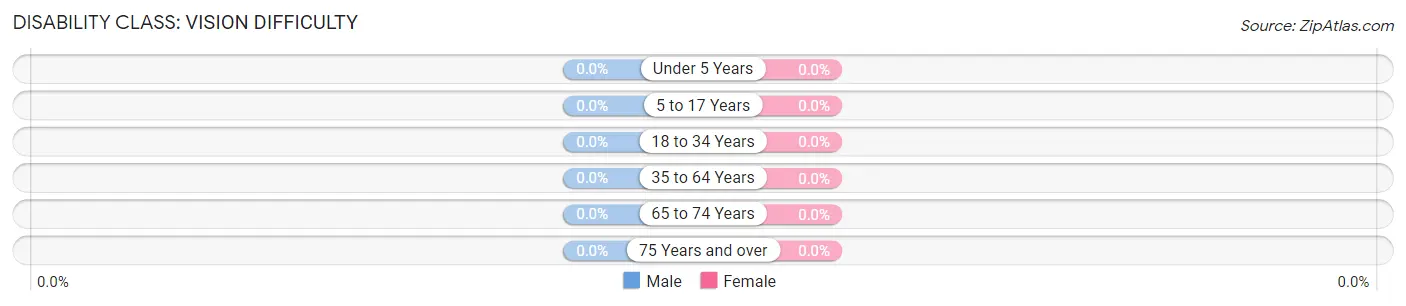
| Age Bracket | Male | Female |
| Under 5 Years | 0 (0.0%) | 0 (0.0%) |
| 5 to 17 Years | 0 (0.0%) | 0 (0.0%) |
| 18 to 34 Years | 0 (0.0%) | 0 (0.0%) |
| 35 to 64 Years | 0 (0.0%) | 0 (0.0%) |
| 65 to 74 Years | 0 (0.0%) | 0 (0.0%) |
| 75 Years and over | 0 (0.0%) | 0 (0.0%) |
Disability Class: Cognitive Difficulty

| Age Bracket | Male | Female |
| 5 to 17 Years | 0 (0.0%) | 0 (0.0%) |
| 18 to 34 Years | 0 (0.0%) | 0 (0.0%) |
| 35 to 64 Years | 0 (0.0%) | 0 (0.0%) |
| 65 to 74 Years | 0 (0.0%) | 0 (0.0%) |
| 75 Years and over | 15 (17.1%) | 0 (0.0%) |
Disability Class: Ambulatory Difficulty
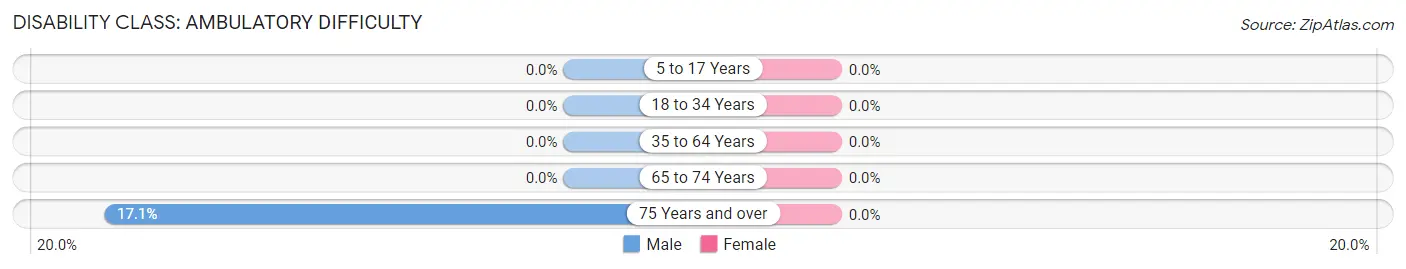
| Age Bracket | Male | Female |
| 5 to 17 Years | 0 (0.0%) | 0 (0.0%) |
| 18 to 34 Years | 0 (0.0%) | 0 (0.0%) |
| 35 to 64 Years | 0 (0.0%) | 0 (0.0%) |
| 65 to 74 Years | 0 (0.0%) | 0 (0.0%) |
| 75 Years and over | 15 (17.1%) | 0 (0.0%) |
Disability Class: Self-Care Difficulty
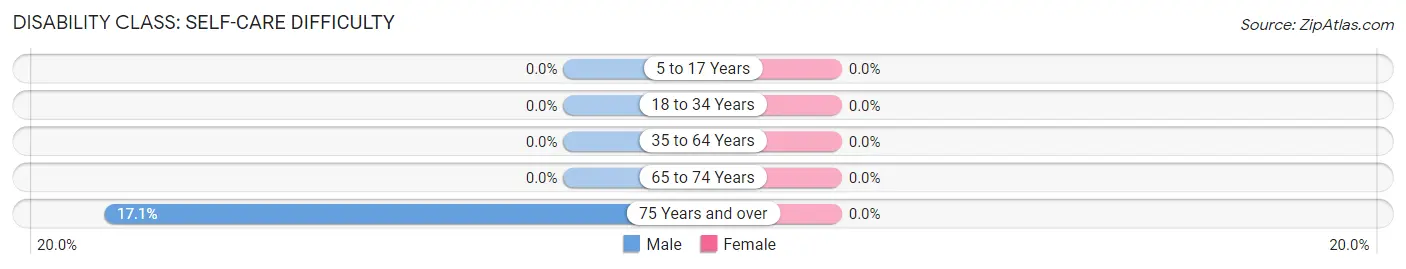
| Age Bracket | Male | Female |
| 5 to 17 Years | 0 (0.0%) | 0 (0.0%) |
| 18 to 34 Years | 0 (0.0%) | 0 (0.0%) |
| 35 to 64 Years | 0 (0.0%) | 0 (0.0%) |
| 65 to 74 Years | 0 (0.0%) | 0 (0.0%) |
| 75 Years and over | 15 (17.1%) | 0 (0.0%) |
Technology Access in Springville
Computing Device Access in Springville
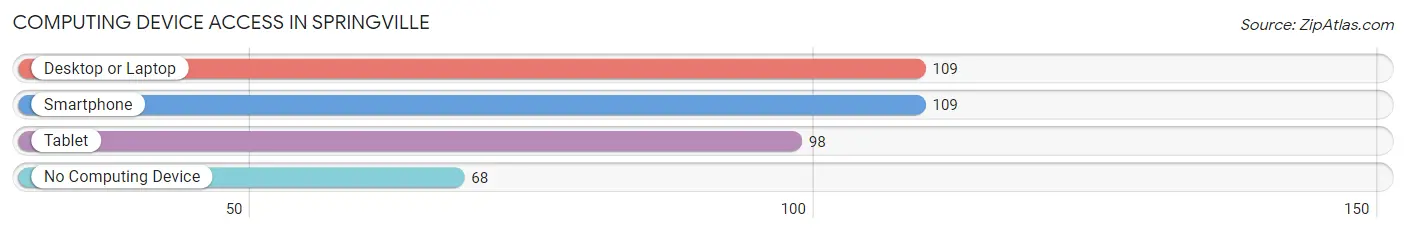
| Device Type | # Households | % Households |
| Desktop or Laptop | 109 | 61.6% |
| Smartphone | 109 | 61.6% |
| Tablet | 98 | 55.4% |
| No Computing Device | 68 | 38.4% |
| Total | 177 | 100.0% |
Internet Access in Springville
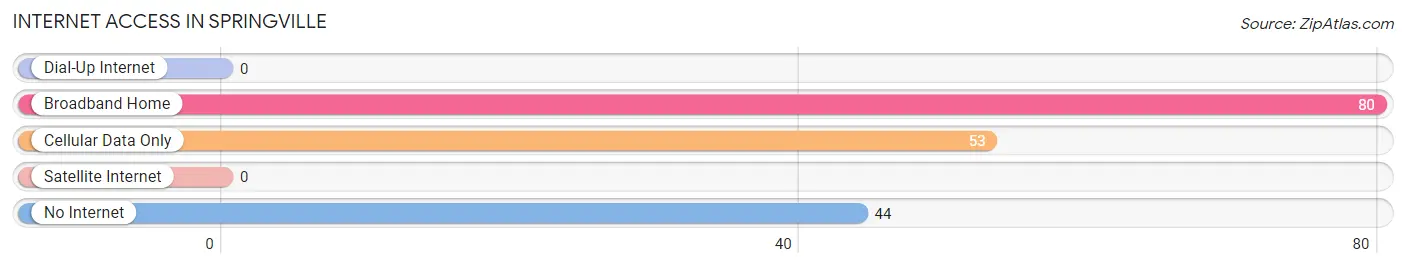
| Internet Type | # Households | % Households |
| Dial-Up Internet | 0 | 0.0% |
| Broadband Home | 80 | 45.2% |
| Cellular Data Only | 53 | 29.9% |
| Satellite Internet | 0 | 0.0% |
| No Internet | 44 | 24.9% |
| Total | 177 | 100.0% |
Springville Summary
History
The small town of Springville, California is located in Tulare County, in the southern part of the state. It is situated in the foothills of the Sierra Nevada Mountains, and is surrounded by the Sequoia National Forest. The town was founded in 1852 by a group of settlers from the Midwest, who were looking for a place to settle and start a new life. The town was originally called “Springville Station”, and was a stop on the stagecoach line that ran between Visalia and Fresno.
The town was officially incorporated in 1891, and the name was changed to Springville. The town was a popular destination for tourists, and was known for its hot springs, which were believed to have healing properties. The town also had a thriving agricultural industry, with many of the local farmers growing grapes, olives, and other crops.
In the early 1900s, the town began to experience a decline in population, as many of the settlers moved away to larger cities. However, the town was able to remain a popular tourist destination, and in the 1950s, the town began to experience a resurgence in population. This was due to the construction of the nearby Lake Success Dam, which provided a steady source of water for the town.
Today, Springville is a small, rural town with a population of just over 1,000 people. The town is still a popular tourist destination, and is known for its hot springs, as well as its proximity to the Sequoia National Forest.
Geography
Springville is located in the foothills of the Sierra Nevada Mountains, in Tulare County, California. The town is situated at an elevation of 1,845 feet, and is surrounded by the Sequoia National Forest. The town is located approximately 40 miles south of Fresno, and is accessible via State Route 190.
The town is located in a semi-arid climate, with hot summers and mild winters. The average annual temperature is around 65 degrees Fahrenheit, and the average annual precipitation is around 10 inches.
Economy
The economy of Springville is largely based on tourism and agriculture. The town is a popular destination for tourists, who come to enjoy the hot springs and the nearby Sequoia National Forest. The town also has a thriving agricultural industry, with many of the local farmers growing grapes, olives, and other crops.
The town also has a few small businesses, including a few restaurants, a grocery store, and a few other retail stores.
Demographics
As of the 2010 census, the population of Springville was 1,072. The racial makeup of the town was 94.3% White, 0.7% African American, 0.3% Native American, 0.7% Asian, 0.1% Pacific Islander, and 3.0% from other races. The median household income was $37,500, and the median age was 39.7 years.
Common Questions
What is Per Capita Income in Springville?
Per Capita income in Springville is $31,261.
What is the Median Family Income in Springville?
Median Family Income in Springville is $93,571.
What is the Median Household income in Springville?
Median Household Income in Springville is $81,319.
What is Income or Wage Gap in Springville?
Income or Wage Gap in Springville is 49.5%.
Women in Springville earn 50.5 cents for every dollar earned by a man.
What is Inequality or Gini Index in Springville?
Inequality or Gini Index in Springville is 0.45.
What is the Total Population of Springville?
Total Population of Springville is 508.
What is the Total Male Population of Springville?
Total Male Population of Springville is 346.
What is the Total Female Population of Springville?
Total Female Population of Springville is 162.
What is the Ratio of Males per 100 Females in Springville?
There are 213.58 Males per 100 Females in Springville.
What is the Ratio of Females per 100 Males in Springville?
There are 46.82 Females per 100 Males in Springville.
What is the Median Population Age in Springville?
Median Population Age in Springville is 34.5 Years.
What is the Average Family Size in Springville
Average Family Size in Springville is 3.8 People.
What is the Average Household Size in Springville
Average Household Size in Springville is 2.9 People.
How Large is the Labor Force in Springville?
There are 262 People in the Labor Forcein in Springville.
What is the Percentage of People in the Labor Force in Springville?
57.3% of People are in the Labor Force in Springville.
What is the Unemployment Rate in Springville?
Unemployment Rate in Springville is 6.9%.