Cities with the Highest Percentage of Households Heated without Fuel in California
RELATED REPORTS & OPTIONS
Fuel-less Heating
California
Compare Cities
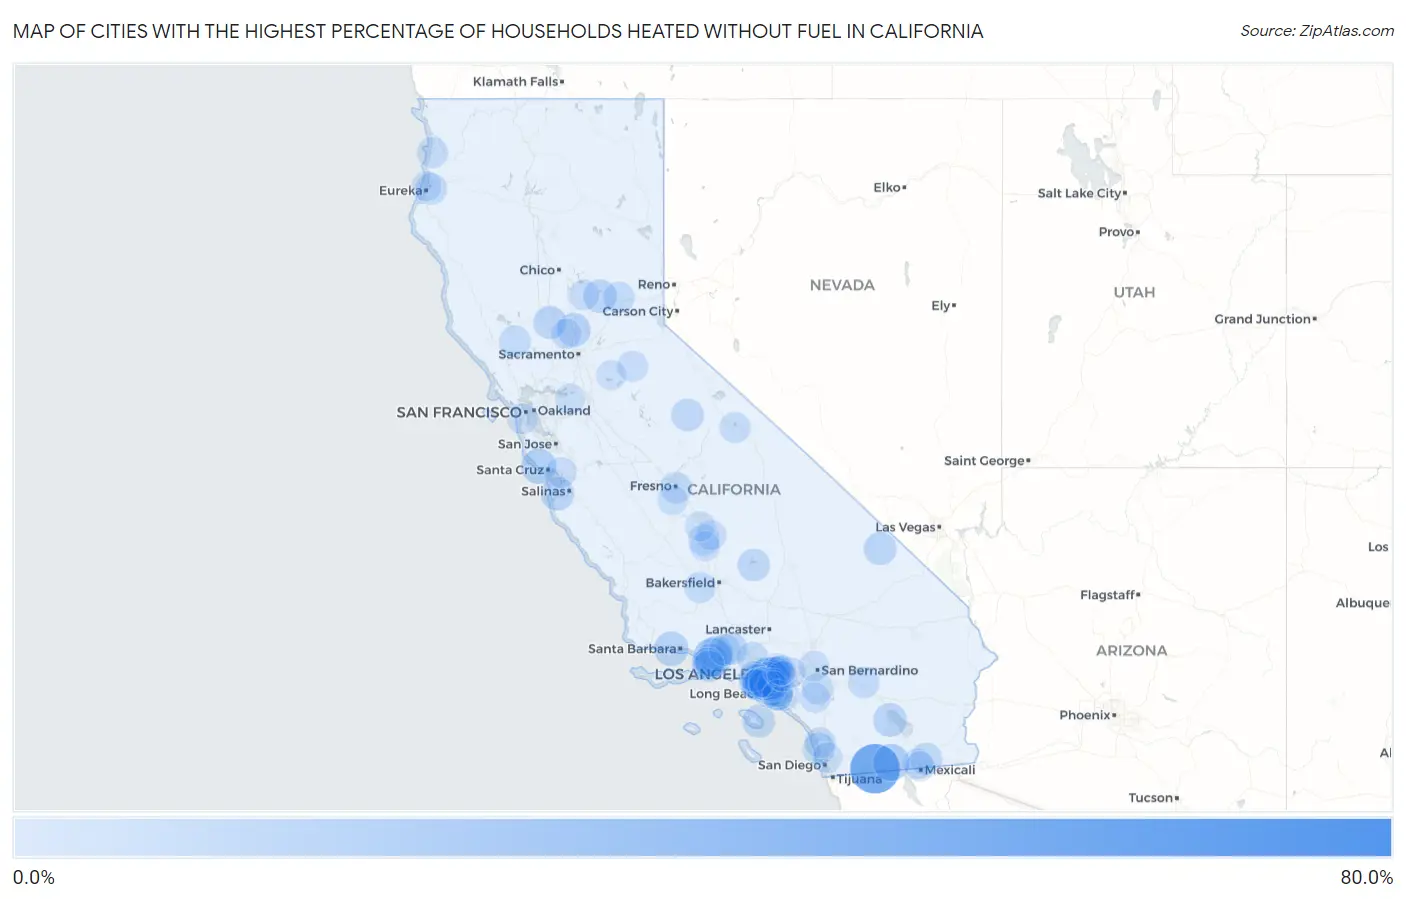
Map of Cities with the Highest Percentage of Households Heated without Fuel in California
0.0%
80.0%
Cities with the Highest Percentage of Households Heated without Fuel in California
| City | Fuel-less Heating | vs State | vs National | |
| 1. | Strawberry Cdp Tuolumne County | 75.4% | 3.1%(+72.3)#1 | 1.2%(+74.2)#322 |
| 2. | Boulevard | 54.8% | 3.1%(+51.7)#2 | 1.2%(+53.6)#404 |
| 3. | Bell Gardens | 38.0% | 3.1%(+34.9)#3 | 1.2%(+36.8)#455 |
| 4. | Bell | 31.3% | 3.1%(+28.2)#4 | 1.2%(+30.1)#467 |
| 5. | Cudahy | 30.9% | 3.1%(+27.8)#5 | 1.2%(+29.7)#470 |
| 6. | Saticoy | 27.1% | 3.1%(+24.0)#6 | 1.2%(+25.9)#480 |
| 7. | Maywood | 25.3% | 3.1%(+22.2)#7 | 1.2%(+24.1)#487 |
| 8. | Ocotillo | 22.2% | 3.1%(+19.1)#8 | 1.2%(+21.0)#495 |
| 9. | East Los Angeles | 20.2% | 3.1%(+17.1)#9 | 1.2%(+19.0)#510 |
| 10. | Huntington Park | 18.4% | 3.1%(+15.3)#10 | 1.2%(+17.2)#520 |
| 11. | Davenport | 18.3% | 3.1%(+15.2)#11 | 1.2%(+17.1)#522 |
| 12. | El Adobe | 18.0% | 3.1%(+14.9)#12 | 1.2%(+16.8)#525 |
| 13. | Florence Graham | 17.7% | 3.1%(+14.6)#13 | 1.2%(+16.5)#527 |
| 14. | Lennox | 17.6% | 3.1%(+14.5)#14 | 1.2%(+16.4)#528 |
| 15. | Isla Vista | 16.8% | 3.1%(+13.7)#15 | 1.2%(+15.6)#536 |
| 16. | South El Monte | 15.9% | 3.1%(+12.8)#16 | 1.2%(+14.7)#542 |
| 17. | Hawaiian Gardens | 15.9% | 3.1%(+12.8)#17 | 1.2%(+14.7)#543 |
| 18. | Di Giorgio | 15.9% | 3.1%(+12.8)#18 | 1.2%(+14.7)#545 |
| 19. | Nicolaus | 14.9% | 3.1%(+11.8)#19 | 1.2%(+13.7)#552 |
| 20. | Salton Sea Beach | 14.6% | 3.1%(+11.5)#20 | 1.2%(+13.4)#553 |
| 21. | North San Juan | 14.4% | 3.1%(+11.3)#21 | 1.2%(+13.2)#555 |
| 22. | Sand City | 14.0% | 3.1%(+10.9)#22 | 1.2%(+12.8)#563 |
| 23. | Walnut Park | 13.9% | 3.1%(+10.8)#23 | 1.2%(+12.7)#564 |
| 24. | Paramount | 13.5% | 3.1%(+10.4)#24 | 1.2%(+12.3)#569 |
| 25. | College City | 13.4% | 3.1%(+10.3)#25 | 1.2%(+12.2)#573 |
| 26. | Santa Paula | 13.3% | 3.1%(+10.2)#26 | 1.2%(+12.1)#574 |
| 27. | El Rio | 12.8% | 3.1%(+9.70)#27 | 1.2%(+11.6)#580 |
| 28. | South Gate | 12.6% | 3.1%(+9.50)#28 | 1.2%(+11.4)#582 |
| 29. | East Rancho Dominguez | 12.6% | 3.1%(+9.50)#29 | 1.2%(+11.4)#583 |
| 30. | Tecopa | 12.6% | 3.1%(+9.50)#30 | 1.2%(+11.4)#586 |
| 31. | Avalon | 12.4% | 3.1%(+9.30)#31 | 1.2%(+11.2)#589 |
| 32. | Yosemite Valley | 12.4% | 3.1%(+9.30)#32 | 1.2%(+11.2)#590 |
| 33. | Squirrel Mountain Valley | 12.0% | 3.1%(+8.90)#33 | 1.2%(+10.8)#596 |
| 34. | Elfin Forest | 12.0% | 3.1%(+8.90)#34 | 1.2%(+10.8)#597 |
| 35. | Piru | 11.6% | 3.1%(+8.50)#35 | 1.2%(+10.4)#604 |
| 36. | Oxnard | 11.4% | 3.1%(+8.30)#36 | 1.2%(+10.2)#609 |
| 37. | Montebello | 11.2% | 3.1%(+8.10)#37 | 1.2%(+10.00)#614 |
| 38. | Holtville | 11.0% | 3.1%(+7.90)#38 | 1.2%(+9.80)#622 |
| 39. | Del Mar | 11.0% | 3.1%(+7.90)#39 | 1.2%(+9.80)#623 |
| 40. | Port Hueneme | 10.2% | 3.1%(+7.10)#40 | 1.2%(+9.00)#637 |
| 41. | Fillmore | 10.2% | 3.1%(+7.10)#41 | 1.2%(+9.00)#638 |
| 42. | Indianola | 10.1% | 3.1%(+7.00)#42 | 1.2%(+8.90)#642 |
| 43. | Santa Ana | 10.0% | 3.1%(+6.90)#43 | 1.2%(+8.80)#643 |
| 44. | Calwa | 9.9% | 3.1%(+6.80)#44 | 1.2%(+8.70)#646 |
| 45. | Vernon | 9.9% | 3.1%(+6.80)#45 | 1.2%(+8.70)#649 |
| 46. | Middletown | 9.8% | 3.1%(+6.70)#46 | 1.2%(+8.60)#650 |
| 47. | Westmont | 9.6% | 3.1%(+6.50)#47 | 1.2%(+8.40)#656 |
| 48. | Midway City | 9.6% | 3.1%(+6.50)#48 | 1.2%(+8.40)#657 |
| 49. | Garnet | 9.5% | 3.1%(+6.40)#49 | 1.2%(+8.30)#659 |
| 50. | Lynwood | 9.3% | 3.1%(+6.20)#50 | 1.2%(+8.10)#663 |
| 51. | Washington | 9.3% | 3.1%(+6.20)#51 | 1.2%(+8.10)#665 |
| 52. | San Fernando | 9.2% | 3.1%(+6.10)#52 | 1.2%(+8.00)#666 |
| 53. | Mead Valley | 9.2% | 3.1%(+6.10)#53 | 1.2%(+8.00)#667 |
| 54. | Tupman | 9.1% | 3.1%(+6.00)#54 | 1.2%(+7.90)#670 |
| 55. | Stanton | 9.0% | 3.1%(+5.90)#55 | 1.2%(+7.80)#673 |
| 56. | Modjeska | 9.0% | 3.1%(+5.90)#56 | 1.2%(+7.80)#675 |
| 57. | Orick | 8.9% | 3.1%(+5.80)#57 | 1.2%(+7.70)#683 |
| 58. | El Monte | 8.7% | 3.1%(+5.60)#58 | 1.2%(+7.50)#690 |
| 59. | Pixley | 8.6% | 3.1%(+5.50)#59 | 1.2%(+7.40)#696 |
| 60. | Downey | 8.4% | 3.1%(+5.30)#60 | 1.2%(+7.20)#701 |
| 61. | Crowley Lake | 8.4% | 3.1%(+5.30)#61 | 1.2%(+7.20)#703 |
| 62. | Bellflower | 8.2% | 3.1%(+5.10)#62 | 1.2%(+7.00)#714 |
| 63. | Inglewood | 8.1% | 3.1%(+5.00)#63 | 1.2%(+6.90)#720 |
| 64. | Commerce | 8.1% | 3.1%(+5.00)#64 | 1.2%(+6.90)#724 |
| 65. | Alondra Park | 8.1% | 3.1%(+5.00)#65 | 1.2%(+6.90)#725 |
| 66. | West Point | 8.1% | 3.1%(+5.00)#66 | 1.2%(+6.90)#729 |
| 67. | Encinitas | 8.0% | 3.1%(+4.90)#67 | 1.2%(+6.80)#731 |
| 68. | Lawndale | 7.7% | 3.1%(+4.60)#68 | 1.2%(+6.50)#743 |
| 69. | Pomona | 7.6% | 3.1%(+4.50)#69 | 1.2%(+6.40)#753 |
| 70. | La Puente | 7.6% | 3.1%(+4.50)#70 | 1.2%(+6.40)#754 |
| 71. | Muscoy | 7.6% | 3.1%(+4.50)#71 | 1.2%(+6.40)#755 |
| 72. | Broadmoor | 7.6% | 3.1%(+4.50)#72 | 1.2%(+6.40)#756 |
| 73. | Bangor | 7.6% | 3.1%(+4.50)#73 | 1.2%(+6.40)#757 |
| 74. | Compton | 7.5% | 3.1%(+4.40)#74 | 1.2%(+6.30)#759 |
| 75. | South Monrovia Island | 7.4% | 3.1%(+4.30)#75 | 1.2%(+6.20)#762 |
| 76. | Norwalk | 7.3% | 3.1%(+4.20)#76 | 1.2%(+6.10)#767 |
| 77. | Long Beach | 7.2% | 3.1%(+4.10)#77 | 1.2%(+6.00)#769 |
| 78. | Heber | 7.2% | 3.1%(+4.10)#78 | 1.2%(+6.00)#770 |
| 79. | West Athens | 7.1% | 3.1%(+4.00)#79 | 1.2%(+5.90)#776 |
| 80. | Freedom | 7.1% | 3.1%(+4.00)#80 | 1.2%(+5.90)#777 |
| 81. | Artesia | 7.0% | 3.1%(+3.90)#81 | 1.2%(+5.80)#785 |
| 82. | Warm Springs | 7.0% | 3.1%(+3.90)#82 | 1.2%(+5.80)#788 |
| 83. | Los Angeles | 6.9% | 3.1%(+3.80)#83 | 1.2%(+5.70)#796 |
| 84. | Hawthorne | 6.9% | 3.1%(+3.80)#84 | 1.2%(+5.70)#797 |
| 85. | Poplar Cotton Center | 6.8% | 3.1%(+3.70)#85 | 1.2%(+5.60)#806 |
| 86. | Robbins | 6.8% | 3.1%(+3.70)#86 | 1.2%(+5.60)#807 |
| 87. | Willowbrook | 6.7% | 3.1%(+3.60)#87 | 1.2%(+5.50)#811 |
| 88. | Caruthers | 6.7% | 3.1%(+3.60)#88 | 1.2%(+5.50)#815 |
| 89. | San Diego | 6.6% | 3.1%(+3.50)#89 | 1.2%(+5.40)#822 |
| 90. | Manila | 6.6% | 3.1%(+3.50)#90 | 1.2%(+5.40)#835 |
| 91. | Knightsen | 6.5% | 3.1%(+3.40)#91 | 1.2%(+5.30)#840 |
| 92. | Buena Vista | 6.5% | 3.1%(+3.40)#92 | 1.2%(+5.30)#843 |
| 93. | Westminster | 6.4% | 3.1%(+3.30)#93 | 1.2%(+5.20)#846 |
| 94. | Baldwin Park | 6.4% | 3.1%(+3.30)#94 | 1.2%(+5.20)#847 |
| 95. | South San Jose Hills | 6.4% | 3.1%(+3.30)#95 | 1.2%(+5.20)#848 |
| 96. | Earlimart | 6.4% | 3.1%(+3.30)#96 | 1.2%(+5.20)#849 |
| 97. | Stebbins | 6.3% | 3.1%(+3.20)#97 | 1.2%(+5.10)#856 |
| 98. | Matheny | 6.3% | 3.1%(+3.20)#98 | 1.2%(+5.10)#857 |
| 99. | Vincent | 6.2% | 3.1%(+3.10)#99 | 1.2%(+5.00)#867 |
| 100. | Calexico | 6.1% | 3.1%(+3.00)#100 | 1.2%(+4.90)#880 |
Common Questions
What are the Top 10 Cities with the Highest Percentage of Households Heated without Fuel in California?
Top 10 Cities with the Highest Percentage of Households Heated without Fuel in California are:
#1
54.8%
#2
38.0%
#3
31.3%
#4
30.9%
#5
27.1%
#6
25.3%
#7
22.2%
#8
20.2%
#9
18.4%
#10
18.3%
What city has the Highest Percentage of Households Heated without Fuel in California?
Boulevard has the Highest Percentage of Households Heated without Fuel in California with 54.8%.
What is the Percentage of Households Heated without Fuel in the State of California?
Percentage of Households Heated without Fuel in California is 3.1%.
What is the Percentage of Households Heated without Fuel in the United States?
Percentage of Households Heated without Fuel in the United States is 1.2%.