Cities with the Highest Child Poverty Level Among Girls Under the Age of 16 in California
RELATED REPORTS & OPTIONS
Highest Poverty | Girls 0-16
California
Compare Cities
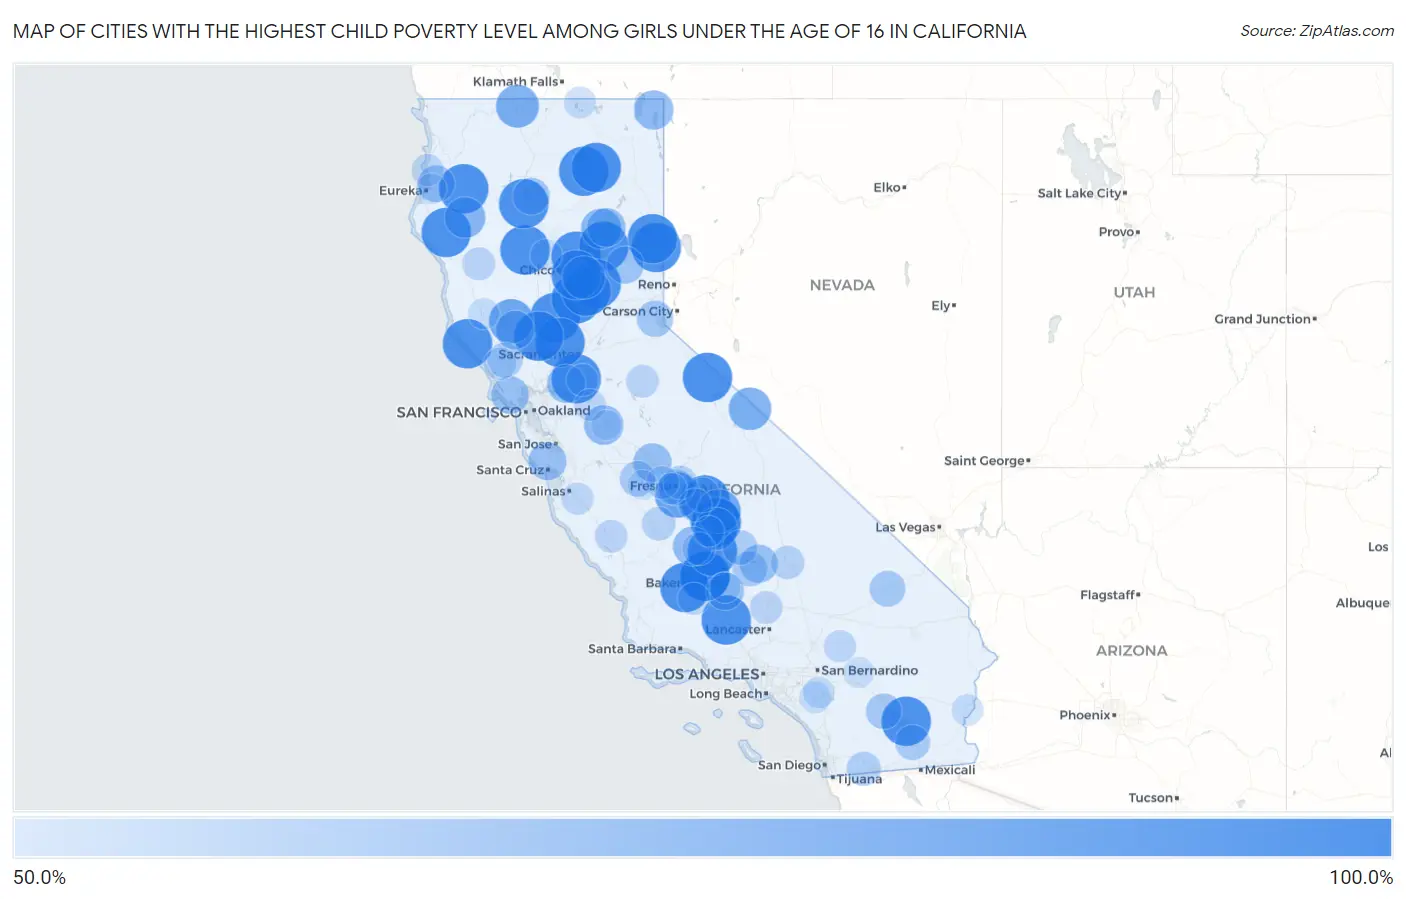
Map of Cities with the Highest Child Poverty Level Among Girls Under the Age of 16 in California
0.0%
100.0%
Cities with the Highest Child Poverty Level Among Girls Under the Age of 16 in California
| City | Child Poverty (Girls) | vs State | vs National | |
| 1. | Sea Ranch | 100.0% | 15.8%(+84.2)#1 | 17.0%(+83.0)#43 |
| 2. | Doyle | 100.0% | 15.8%(+84.2)#2 | 17.0%(+83.0)#60 |
| 3. | Lebec | 100.0% | 15.8%(+84.2)#3 | 17.0%(+83.0)#76 |
| 4. | Walnut Grove | 100.0% | 15.8%(+84.2)#4 | 17.0%(+83.0)#94 |
| 5. | Rancho Tehama Reserve | 100.0% | 15.8%(+84.2)#5 | 17.0%(+83.0)#100 |
| 6. | Patton Village | 100.0% | 15.8%(+84.2)#6 | 17.0%(+83.0)#101 |
| 7. | Miranda | 100.0% | 15.8%(+84.2)#7 | 17.0%(+83.0)#130 |
| 8. | Stirling City | 100.0% | 15.8%(+84.2)#8 | 17.0%(+83.0)#173 |
| 9. | Edison | 100.0% | 15.8%(+84.2)#9 | 17.0%(+83.0)#176 |
| 10. | Mcarthur | 100.0% | 15.8%(+84.2)#10 | 17.0%(+83.0)#199 |
| 11. | East Orosi | 100.0% | 15.8%(+84.2)#11 | 17.0%(+83.0)#201 |
| 12. | Bridgeport | 100.0% | 15.8%(+84.2)#12 | 17.0%(+83.0)#208 |
| 13. | Grimes | 100.0% | 15.8%(+84.2)#13 | 17.0%(+83.0)#230 |
| 14. | Twain | 100.0% | 15.8%(+84.2)#14 | 17.0%(+83.0)#242 |
| 15. | Clipper Mills | 100.0% | 15.8%(+84.2)#15 | 17.0%(+83.0)#247 |
| 16. | Tonyville | 100.0% | 15.8%(+84.2)#16 | 17.0%(+83.0)#248 |
| 17. | Honcut | 100.0% | 15.8%(+84.2)#17 | 17.0%(+83.0)#251 |
| 18. | Mexican Colony | 100.0% | 15.8%(+84.2)#18 | 17.0%(+83.0)#257 |
| 19. | Yolo | 100.0% | 15.8%(+84.2)#19 | 17.0%(+83.0)#278 |
| 20. | Bombay Beach | 100.0% | 15.8%(+84.2)#20 | 17.0%(+83.0)#304 |
| 21. | Burnt Ranch | 100.0% | 15.8%(+84.2)#21 | 17.0%(+83.0)#316 |
| 22. | Rackerby | 100.0% | 15.8%(+84.2)#22 | 17.0%(+83.0)#323 |
| 23. | Cherokee | 100.0% | 15.8%(+84.2)#23 | 17.0%(+83.0)#346 |
| 24. | Guinda | 100.0% | 15.8%(+84.2)#24 | 17.0%(+83.0)#359 |
| 25. | Cherokee Strip | 100.0% | 15.8%(+84.2)#25 | 17.0%(+83.0)#386 |
| 26. | Keswick | 100.0% | 15.8%(+84.2)#26 | 17.0%(+83.0)#455 |
| 27. | Mckittrick | 100.0% | 15.8%(+84.2)#27 | 17.0%(+83.0)#538 |
| 28. | El Rancho | 100.0% | 15.8%(+84.2)#28 | 17.0%(+83.0)#598 |
| 29. | Rodriguez Camp | 100.0% | 15.8%(+84.2)#29 | 17.0%(+83.0)#623 |
| 30. | Nubieber | 100.0% | 15.8%(+84.2)#30 | 17.0%(+83.0)#648 |
| 31. | Wautec | 100.0% | 15.8%(+84.2)#31 | 17.0%(+83.0)#679 |
| 32. | Bowles | 88.9% | 15.8%(+73.1)#32 | 17.0%(+71.9)#785 |
| 33. | Clearlake Oaks | 86.8% | 15.8%(+71.0)#33 | 17.0%(+69.9)#829 |
| 34. | Lemon Cove | 85.6% | 15.8%(+69.8)#34 | 17.0%(+68.6)#864 |
| 35. | Weitchpec | 85.2% | 15.8%(+69.4)#35 | 17.0%(+68.2)#875 |
| 36. | Oak Run | 83.1% | 15.8%(+67.2)#36 | 17.0%(+66.1)#934 |
| 37. | Berry Creek | 82.8% | 15.8%(+67.0)#37 | 17.0%(+65.8)#945 |
| 38. | Hornbrook | 82.8% | 15.8%(+67.0)#38 | 17.0%(+65.8)#946 |
| 39. | Benton | 81.8% | 15.8%(+66.0)#39 | 17.0%(+64.8)#969 |
| 40. | Strathmore | 81.5% | 15.8%(+65.7)#40 | 17.0%(+64.5)#981 |
| 41. | Mad River | 77.1% | 15.8%(+61.3)#41 | 17.0%(+60.2)#1,134 |
| 42. | Hamilton Branch | 76.2% | 15.8%(+60.4)#42 | 17.0%(+59.2)#1,161 |
| 43. | Riverdale Park | 73.8% | 15.8%(+58.0)#43 | 17.0%(+56.9)#1,267 |
| 44. | Fort Bidwell | 73.3% | 15.8%(+57.5)#44 | 17.0%(+56.4)#1,289 |
| 45. | Alpaugh | 72.9% | 15.8%(+57.1)#45 | 17.0%(+55.9)#1,310 |
| 46. | Westwood | 71.9% | 15.8%(+56.1)#46 | 17.0%(+55.0)#1,366 |
| 47. | Lower Lake | 71.4% | 15.8%(+55.6)#47 | 17.0%(+54.5)#1,384 |
| 48. | Rio Vista | 71.4% | 15.8%(+55.6)#48 | 17.0%(+54.4)#1,400 |
| 49. | Fairmead | 70.9% | 15.8%(+55.0)#49 | 17.0%(+53.9)#1,427 |
| 50. | Weldon | 70.3% | 15.8%(+54.5)#50 | 17.0%(+53.3)#1,446 |
| 51. | Zayante | 70.0% | 15.8%(+54.2)#51 | 17.0%(+53.0)#1,456 |
| 52. | Weedpatch | 69.5% | 15.8%(+53.7)#52 | 17.0%(+52.5)#1,487 |
| 53. | Lagunitas Forest Knolls | 69.4% | 15.8%(+53.6)#53 | 17.0%(+52.4)#1,490 |
| 54. | Plumas Eureka | 68.2% | 15.8%(+52.4)#54 | 17.0%(+51.2)#1,550 |
| 55. | Blue Lake | 67.4% | 15.8%(+51.6)#55 | 17.0%(+50.4)#1,584 |
| 56. | Mountain Gate | 67.2% | 15.8%(+51.4)#56 | 17.0%(+50.2)#1,593 |
| 57. | Tahoma | 65.7% | 15.8%(+49.9)#57 | 17.0%(+48.7)#1,713 |
| 58. | Baker | 64.4% | 15.8%(+48.6)#58 | 17.0%(+47.4)#1,771 |
| 59. | Calwa | 64.2% | 15.8%(+48.4)#59 | 17.0%(+47.2)#1,792 |
| 60. | Oasis | 64.1% | 15.8%(+48.3)#60 | 17.0%(+47.1)#1,802 |
| 61. | Firebaugh | 63.3% | 15.8%(+47.5)#61 | 17.0%(+46.3)#1,851 |
| 62. | Bodfish | 63.0% | 15.8%(+47.2)#62 | 17.0%(+46.1)#1,866 |
| 63. | Westmorland | 62.8% | 15.8%(+47.0)#63 | 17.0%(+45.9)#1,879 |
| 64. | Fulton | 62.5% | 15.8%(+46.7)#64 | 17.0%(+45.5)#1,900 |
| 65. | Orange Cove | 62.2% | 15.8%(+46.4)#65 | 17.0%(+45.3)#1,929 |
| 66. | Pine Flat | 61.9% | 15.8%(+46.1)#66 | 17.0%(+44.9)#1,955 |
| 67. | Campo | 60.0% | 15.8%(+44.2)#67 | 17.0%(+43.1)#2,078 |
| 68. | Tarpey Village | 59.1% | 15.8%(+43.3)#68 | 17.0%(+42.1)#2,151 |
| 69. | Huron | 58.9% | 15.8%(+43.1)#69 | 17.0%(+41.9)#2,179 |
| 70. | Inyokern | 58.8% | 15.8%(+43.0)#70 | 17.0%(+41.8)#2,185 |
| 71. | London | 57.8% | 15.8%(+42.0)#71 | 17.0%(+40.9)#2,272 |
| 72. | Covelo | 57.3% | 15.8%(+41.5)#72 | 17.0%(+40.3)#2,303 |
| 73. | Allensworth | 57.1% | 15.8%(+41.3)#73 | 17.0%(+40.2)#2,313 |
| 74. | Avery | 56.8% | 15.8%(+40.9)#74 | 17.0%(+39.8)#2,360 |
| 75. | Biola | 56.7% | 15.8%(+40.9)#75 | 17.0%(+39.7)#2,365 |
| 76. | Mojave | 56.7% | 15.8%(+40.9)#76 | 17.0%(+39.7)#2,366 |
| 77. | San Ardo | 56.6% | 15.8%(+40.8)#77 | 17.0%(+39.6)#2,374 |
| 78. | Graton | 55.9% | 15.8%(+40.1)#78 | 17.0%(+38.9)#2,434 |
| 79. | Chualar | 55.3% | 15.8%(+39.5)#79 | 17.0%(+38.4)#2,496 |
| 80. | Lucerne Valley | 55.3% | 15.8%(+39.5)#80 | 17.0%(+38.3)#2,499 |
| 81. | South Taft | 55.1% | 15.8%(+39.3)#81 | 17.0%(+38.2)#2,513 |
| 82. | Thornton | 55.0% | 15.8%(+39.2)#82 | 17.0%(+38.0)#2,519 |
| 83. | Trinidad | 55.0% | 15.8%(+39.2)#83 | 17.0%(+38.0)#2,521 |
| 84. | Rexland Acres | 54.9% | 15.8%(+39.1)#84 | 17.0%(+37.9)#2,528 |
| 85. | French Camp | 54.9% | 15.8%(+39.0)#85 | 17.0%(+37.9)#2,531 |
| 86. | Tulelake | 54.5% | 15.8%(+38.7)#86 | 17.0%(+37.6)#2,555 |
| 87. | Ripley | 53.8% | 15.8%(+38.0)#87 | 17.0%(+36.9)#2,631 |
| 88. | Vina | 53.8% | 15.8%(+38.0)#88 | 17.0%(+36.9)#2,637 |
| 89. | Warm Springs | 53.8% | 15.8%(+37.9)#89 | 17.0%(+36.8)#2,651 |
| 90. | Good Hope | 53.5% | 15.8%(+37.7)#90 | 17.0%(+36.5)#2,675 |
| 91. | West Park | 53.1% | 15.8%(+37.3)#91 | 17.0%(+36.1)#2,715 |
| 92. | Talmage | 52.9% | 15.8%(+37.1)#92 | 17.0%(+35.9)#2,746 |
| 93. | East Bakersfield | 52.3% | 15.8%(+36.5)#93 | 17.0%(+35.3)#2,807 |
| 94. | San Miguel Cdp San Luis Obispo County | 52.0% | 15.8%(+36.2)#94 | 17.0%(+35.0)#2,837 |
| 95. | Morongo Valley | 51.9% | 15.8%(+36.1)#95 | 17.0%(+34.9)#2,841 |
| 96. | Woodville | 51.7% | 15.8%(+35.9)#96 | 17.0%(+34.7)#2,859 |
| 97. | Indianola | 51.6% | 15.8%(+35.8)#97 | 17.0%(+34.6)#2,867 |
| 98. | Fuller Acres | 51.6% | 15.8%(+35.8)#98 | 17.0%(+34.6)#2,870 |
| 99. | Mendota | 50.4% | 15.8%(+34.6)#99 | 17.0%(+33.4)#2,963 |
| 100. | Bret Harte | 50.3% | 15.8%(+34.5)#100 | 17.0%(+33.3)#2,973 |
Common Questions
What are the Top 10 Cities with the Highest Child Poverty Level Among Girls Under the Age of 16 in California?
Top 10 Cities with the Highest Child Poverty Level Among Girls Under the Age of 16 in California are:
#1
100.0%
#2
100.0%
#3
100.0%
#4
100.0%
#5
100.0%
#6
100.0%
#7
100.0%
#8
100.0%
#9
100.0%
#10
100.0%
What city has the Highest Child Poverty Level Among Girls Under the Age of 16 in California?
Sea Ranch has the Highest Child Poverty Level Among Girls Under the Age of 16 in California with 100.0%.
What is the Poverty Level Among Girls Under the Age of 16 in the State of California?
Poverty Level Among Girls Under the Age of 16 in California is 15.8%.
What is the Poverty Level Among Girls Under the Age of 16 in the United States?
Poverty Level Among Girls Under the Age of 16 in the United States is 17.0%.