Cities with the Highest Poverty Level Among Single Males in California
RELATED REPORTS & OPTIONS
Highest Poverty | Single Male
California
Compare Cities
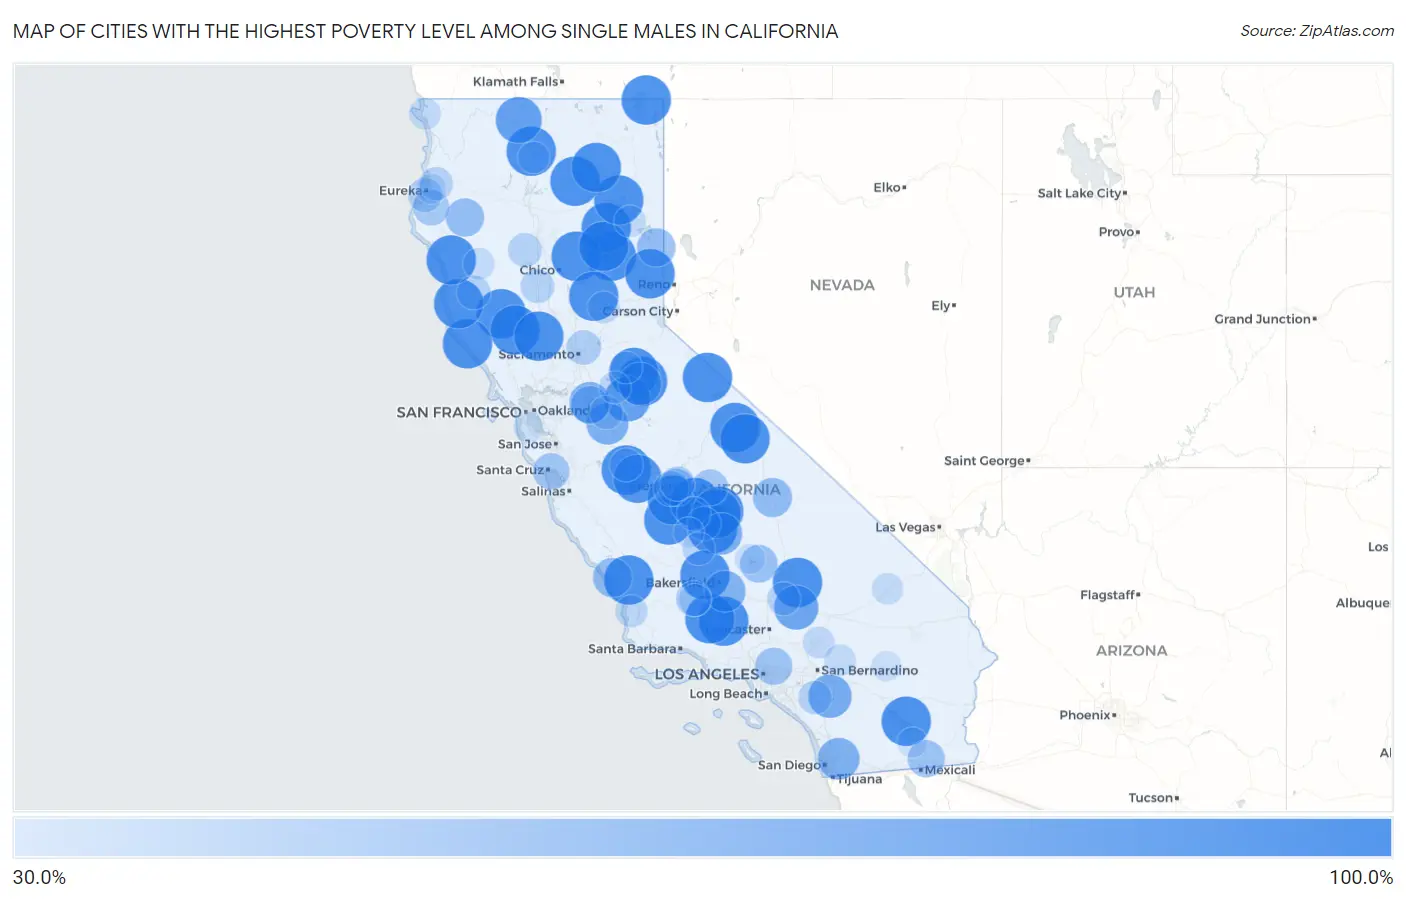
Map of Cities with the Highest Poverty Level Among Single Males in California
0.0%
100.0%
Cities with the Highest Poverty Level Among Single Males in California
| City | Single Male Poverty | vs State | vs National | |
| 1. | Lemoore Station | 100.0% | 11.1%(+88.9)#1 | 12.4%(+87.6)#5 |
| 2. | Mount Shasta | 100.0% | 11.1%(+88.9)#2 | 12.4%(+87.6)#39 |
| 3. | Frazier Park | 100.0% | 11.1%(+88.9)#3 | 12.4%(+87.6)#64 |
| 4. | East Quincy | 100.0% | 11.1%(+88.9)#4 | 12.4%(+87.6)#77 |
| 5. | Nice | 100.0% | 11.1%(+88.9)#5 | 12.4%(+87.6)#79 |
| 6. | Pine Mountain Club | 100.0% | 11.1%(+88.9)#6 | 12.4%(+87.6)#91 |
| 7. | Caruthers | 100.0% | 11.1%(+88.9)#7 | 12.4%(+87.6)#104 |
| 8. | South Dos Palos | 100.0% | 11.1%(+88.9)#8 | 12.4%(+87.6)#151 |
| 9. | Lower Lake | 100.0% | 11.1%(+88.9)#9 | 12.4%(+87.6)#169 |
| 10. | Sea Ranch | 100.0% | 11.1%(+88.9)#10 | 12.4%(+87.6)#189 |
| 11. | Westwood | 100.0% | 11.1%(+88.9)#11 | 12.4%(+87.6)#209 |
| 12. | Crowley Lake | 100.0% | 11.1%(+88.9)#12 | 12.4%(+87.6)#220 |
| 13. | Delft Colony | 100.0% | 11.1%(+88.9)#13 | 12.4%(+87.6)#229 |
| 14. | Loyalton | 100.0% | 11.1%(+88.9)#14 | 12.4%(+87.6)#238 |
| 15. | Modjeska | 100.0% | 11.1%(+88.9)#15 | 12.4%(+87.6)#307 |
| 16. | Round Valley | 100.0% | 11.1%(+88.9)#16 | 12.4%(+87.6)#315 |
| 17. | Stirling City | 100.0% | 11.1%(+88.9)#17 | 12.4%(+87.6)#412 |
| 18. | Lemon Cove | 100.0% | 11.1%(+88.9)#18 | 12.4%(+87.6)#414 |
| 19. | Avery | 100.0% | 11.1%(+88.9)#19 | 12.4%(+87.6)#454 |
| 20. | Dobbins | 100.0% | 11.1%(+88.9)#20 | 12.4%(+87.6)#455 |
| 21. | Bridgeport | 100.0% | 11.1%(+88.9)#21 | 12.4%(+87.6)#463 |
| 22. | Plainview | 100.0% | 11.1%(+88.9)#22 | 12.4%(+87.6)#482 |
| 23. | Garden Farms | 100.0% | 11.1%(+88.9)#23 | 12.4%(+87.6)#488 |
| 24. | Twain | 100.0% | 11.1%(+88.9)#24 | 12.4%(+87.6)#515 |
| 25. | Smith Corner | 100.0% | 11.1%(+88.9)#25 | 12.4%(+87.6)#520 |
| 26. | Bombay Beach | 100.0% | 11.1%(+88.9)#26 | 12.4%(+87.6)#605 |
| 27. | Lindcove | 100.0% | 11.1%(+88.9)#27 | 12.4%(+87.6)#610 |
| 28. | Spaulding | 100.0% | 11.1%(+88.9)#28 | 12.4%(+87.6)#616 |
| 29. | Cassel | 100.0% | 11.1%(+88.9)#29 | 12.4%(+87.6)#623 |
| 30. | Guinda | 100.0% | 11.1%(+88.9)#30 | 12.4%(+87.6)#672 |
| 31. | La Grange | 100.0% | 11.1%(+88.9)#31 | 12.4%(+87.6)#742 |
| 32. | Comptche | 100.0% | 11.1%(+88.9)#32 | 12.4%(+87.6)#754 |
| 33. | Johannesburg | 100.0% | 11.1%(+88.9)#33 | 12.4%(+87.6)#797 |
| 34. | Dales | 100.0% | 11.1%(+88.9)#34 | 12.4%(+87.6)#829 |
| 35. | New Pine Creek | 100.0% | 11.1%(+88.9)#35 | 12.4%(+87.6)#830 |
| 36. | Rail Road Flat | 100.0% | 11.1%(+88.9)#36 | 12.4%(+87.6)#831 |
| 37. | Leggett | 100.0% | 11.1%(+88.9)#37 | 12.4%(+87.6)#881 |
| 38. | Nubieber | 100.0% | 11.1%(+88.9)#38 | 12.4%(+87.6)#886 |
| 39. | Firebaugh | 95.9% | 11.1%(+84.9)#39 | 12.4%(+83.5)#915 |
| 40. | Montague | 88.9% | 11.1%(+77.8)#40 | 12.4%(+76.5)#956 |
| 41. | Copperopolis | 87.5% | 11.1%(+76.4)#41 | 12.4%(+75.1)#971 |
| 42. | Boron | 83.3% | 11.1%(+72.3)#42 | 12.4%(+70.9)#1,032 |
| 43. | Green Acres | 80.0% | 11.1%(+68.9)#43 | 12.4%(+67.6)#1,079 |
| 44. | Forest Meadows | 78.3% | 11.1%(+67.2)#44 | 12.4%(+65.8)#1,132 |
| 45. | East Porterville | 75.4% | 11.1%(+64.3)#45 | 12.4%(+63.0)#1,181 |
| 46. | Bystrom | 75.3% | 11.1%(+64.2)#46 | 12.4%(+62.8)#1,184 |
| 47. | Granite Hills | 75.0% | 11.1%(+63.9)#47 | 12.4%(+62.6)#1,186 |
| 48. | Weedpatch | 73.1% | 11.1%(+62.1)#48 | 12.4%(+60.7)#1,251 |
| 49. | Taft Mosswood | 73.1% | 11.1%(+62.0)#49 | 12.4%(+60.6)#1,253 |
| 50. | Oak Run | 71.4% | 11.1%(+60.3)#50 | 12.4%(+59.0)#1,291 |
| 51. | Cayucos | 66.7% | 11.1%(+55.6)#51 | 12.4%(+54.2)#1,419 |
| 52. | Lone Pine | 66.7% | 11.1%(+55.6)#52 | 12.4%(+54.2)#1,430 |
| 53. | Doyle | 64.7% | 11.1%(+53.6)#53 | 12.4%(+52.3)#1,529 |
| 54. | Mad River | 64.3% | 11.1%(+53.2)#54 | 12.4%(+51.9)#1,548 |
| 55. | French Camp | 63.0% | 11.1%(+51.9)#55 | 12.4%(+50.5)#1,596 |
| 56. | Weldon | 61.9% | 11.1%(+50.8)#56 | 12.4%(+49.4)#1,640 |
| 57. | Sierra Madre | 60.5% | 11.1%(+49.4)#57 | 12.4%(+48.1)#1,697 |
| 58. | Calwa | 60.4% | 11.1%(+49.3)#58 | 12.4%(+48.0)#1,699 |
| 59. | Holtville | 60.2% | 11.1%(+49.2)#59 | 12.4%(+47.8)#1,701 |
| 60. | Pleasure Point | 57.7% | 11.1%(+46.7)#60 | 12.4%(+45.3)#1,831 |
| 61. | Squaw Valley | 57.1% | 11.1%(+46.1)#61 | 12.4%(+44.7)#1,838 |
| 62. | Bayview Cdp Humboldt County | 56.4% | 11.1%(+45.3)#62 | 12.4%(+44.0)#1,896 |
| 63. | Hydesville | 56.0% | 11.1%(+44.9)#63 | 12.4%(+43.6)#1,912 |
| 64. | South Taft | 54.1% | 11.1%(+43.0)#64 | 12.4%(+41.6)#2,014 |
| 65. | West Park | 53.5% | 11.1%(+42.4)#65 | 12.4%(+41.1)#2,039 |
| 66. | Mcclellan Park | 52.3% | 11.1%(+41.2)#66 | 12.4%(+39.8)#2,124 |
| 67. | Mayfair | 51.9% | 11.1%(+40.8)#67 | 12.4%(+39.4)#2,136 |
| 68. | Humboldt Hill | 51.0% | 11.1%(+39.9)#68 | 12.4%(+38.6)#2,171 |
| 69. | Willits | 50.0% | 11.1%(+38.9)#69 | 12.4%(+37.6)#2,188 |
| 70. | East Tulare Villa | 50.0% | 11.1%(+38.9)#70 | 12.4%(+37.6)#2,243 |
| 71. | Rancho Tehama Reserve | 50.0% | 11.1%(+38.9)#71 | 12.4%(+37.6)#2,247 |
| 72. | West Goshen | 50.0% | 11.1%(+38.9)#72 | 12.4%(+37.6)#2,275 |
| 73. | Willows | 49.4% | 11.1%(+38.3)#73 | 12.4%(+37.0)#2,405 |
| 74. | Escalon | 48.8% | 11.1%(+37.7)#74 | 12.4%(+36.3)#2,429 |
| 75. | Blue Lake | 48.6% | 11.1%(+37.6)#75 | 12.4%(+36.2)#2,437 |
| 76. | Warm Springs | 48.2% | 11.1%(+37.1)#76 | 12.4%(+35.8)#2,455 |
| 77. | Madera Ranchos | 48.0% | 11.1%(+36.9)#77 | 12.4%(+35.6)#2,467 |
| 78. | Sage | 47.7% | 11.1%(+36.6)#78 | 12.4%(+35.3)#2,480 |
| 79. | Dos Palos Y | 47.6% | 11.1%(+36.5)#79 | 12.4%(+35.2)#2,490 |
| 80. | California City | 47.6% | 11.1%(+36.5)#80 | 12.4%(+35.1)#2,491 |
| 81. | Allensworth | 46.2% | 11.1%(+35.1)#81 | 12.4%(+33.7)#2,589 |
| 82. | Taft | 45.0% | 11.1%(+33.9)#82 | 12.4%(+32.5)#2,658 |
| 83. | Guadalupe | 44.6% | 11.1%(+33.6)#83 | 12.4%(+32.2)#2,674 |
| 84. | Rancho Calaveras | 44.2% | 11.1%(+33.1)#84 | 12.4%(+31.8)#2,709 |
| 85. | Grass Valley | 43.9% | 11.1%(+32.8)#85 | 12.4%(+31.5)#2,724 |
| 86. | Pine Grove | 43.6% | 11.1%(+32.5)#86 | 12.4%(+31.2)#2,753 |
| 87. | Spring Valley Lake | 43.2% | 11.1%(+32.1)#87 | 12.4%(+30.8)#2,771 |
| 88. | Covelo | 43.1% | 11.1%(+32.0)#88 | 12.4%(+30.6)#2,777 |
| 89. | Crescent City | 43.1% | 11.1%(+32.0)#89 | 12.4%(+30.6)#2,778 |
| 90. | Johnstonville | 42.9% | 11.1%(+31.8)#90 | 12.4%(+30.4)#2,794 |
| 91. | Baker | 42.9% | 11.1%(+31.8)#91 | 12.4%(+30.4)#2,806 |
| 92. | Dunsmuir | 42.4% | 11.1%(+31.3)#92 | 12.4%(+29.9)#2,842 |
| 93. | Big Bear Lake | 42.2% | 11.1%(+31.1)#93 | 12.4%(+29.8)#2,853 |
| 94. | Corcoran | 39.3% | 11.1%(+28.2)#94 | 12.4%(+26.8)#3,151 |
| 95. | North Fork | 39.1% | 11.1%(+28.0)#95 | 12.4%(+26.7)#3,157 |
| 96. | Twentynine Palms | 39.0% | 11.1%(+27.9)#96 | 12.4%(+26.5)#3,167 |
| 97. | Indianola | 38.9% | 11.1%(+27.8)#97 | 12.4%(+26.5)#3,177 |
| 98. | Hillsborough | 38.5% | 11.1%(+27.5)#98 | 12.4%(+26.1)#3,197 |
| 99. | Wofford Heights | 38.5% | 11.1%(+27.4)#99 | 12.4%(+26.0)#3,202 |
| 100. | Westmorland | 38.5% | 11.1%(+27.4)#100 | 12.4%(+26.0)#3,203 |
Common Questions
What are the Top 10 Cities with the Highest Poverty Level Among Single Males in California?
Top 10 Cities with the Highest Poverty Level Among Single Males in California are:
#1
100.0%
#2
100.0%
#3
100.0%
#4
100.0%
#5
100.0%
#6
100.0%
#7
100.0%
#8
100.0%
#9
100.0%
#10
100.0%
What city has the Highest Poverty Level Among Single Males in California?
Lemoore Station has the Highest Poverty Level Among Single Males in California with 100.0%.
What is the Poverty Level Among Single Males in the State of California?
Poverty Level Among Single Males in California is 11.1%.
What is the Poverty Level Among Single Males in the United States?
Poverty Level Among Single Males in the United States is 12.4%.