Cities with the Highest Percentage of Households With Three or more Vehicles in California
RELATED REPORTS & OPTIONS
Households with 3 or more Cars
California
Compare Cities
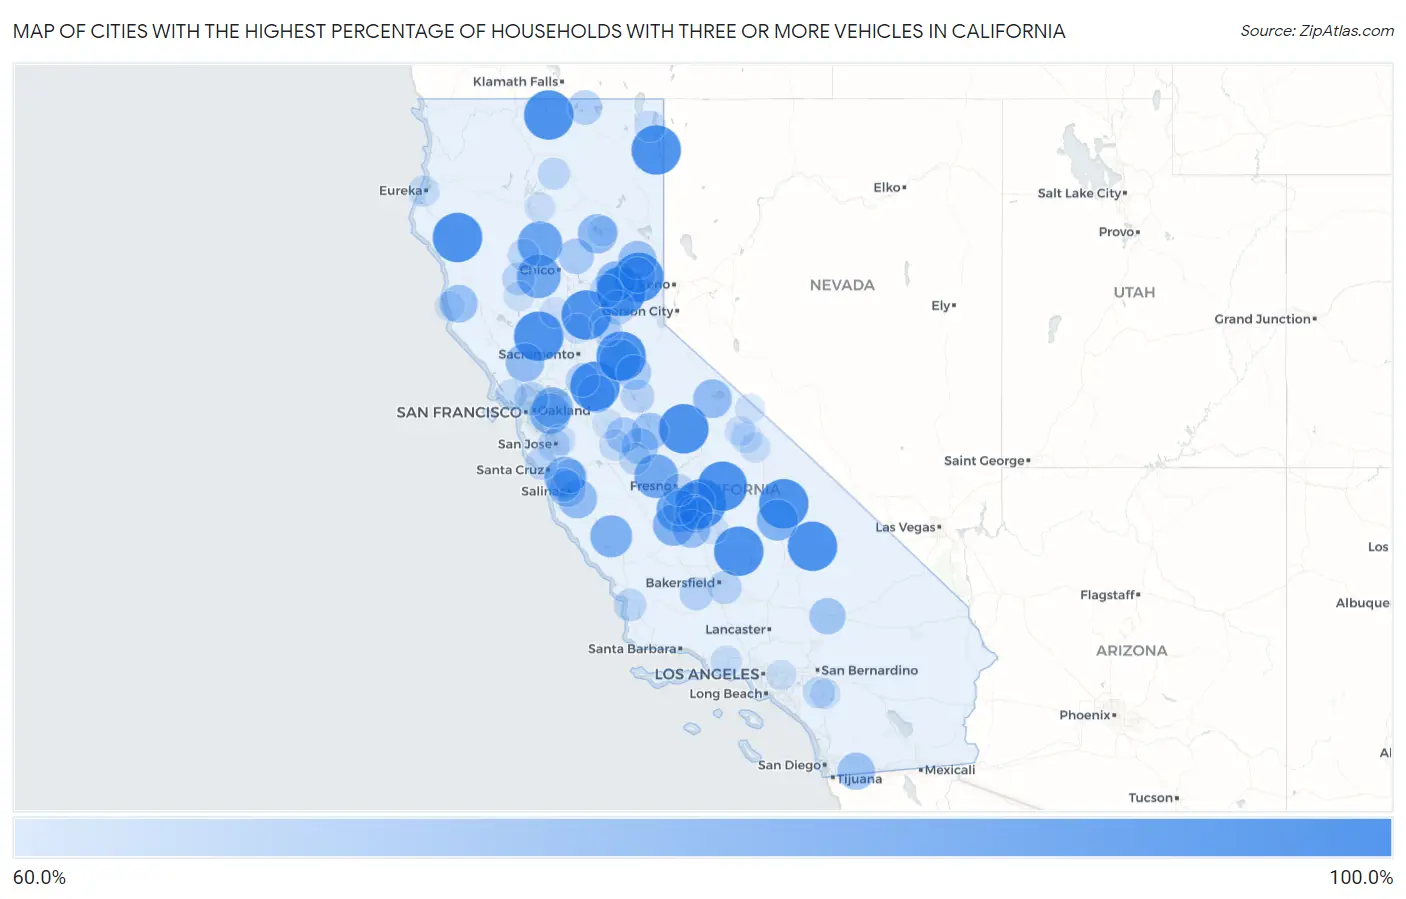
Map of Cities with the Highest Percentage of Households With Three or more Vehicles in California
0.0%
100.0%
Cities with the Highest Percentage of Households With Three or more Vehicles in California
| City | Housholds With 3+ Cars | vs State | vs National | |
| 1. | Beale Afb | 100.0% | 35.3%(+64.7)#1 | 29.0%(+71.0)#9 |
| 2. | Victor | 100.0% | 35.3%(+64.7)#2 | 29.0%(+71.0)#13 |
| 3. | Edison | 100.0% | 35.3%(+64.7)#3 | 29.0%(+71.0)#20 |
| 4. | River Pines | 100.0% | 35.3%(+64.7)#4 | 29.0%(+71.0)#21 |
| 5. | Homewood Canyon | 100.0% | 35.3%(+64.7)#5 | 29.0%(+71.0)#67 |
| 6. | Guinda | 100.0% | 35.3%(+64.7)#6 | 29.0%(+71.0)#84 |
| 7. | Monson | 100.0% | 35.3%(+64.7)#7 | 29.0%(+71.0)#117 |
| 8. | Wawona | 100.0% | 35.3%(+64.7)#8 | 29.0%(+71.0)#129 |
| 9. | Mount Hebron | 100.0% | 35.3%(+64.7)#9 | 29.0%(+71.0)#134 |
| 10. | Old River | 100.0% | 35.3%(+64.7)#10 | 29.0%(+71.0)#145 |
| 11. | Post Mountain | 100.0% | 35.3%(+64.7)#11 | 29.0%(+71.0)#150 |
| 12. | Alderpoint | 100.0% | 35.3%(+64.7)#12 | 29.0%(+71.0)#162 |
| 13. | Idlewild | 100.0% | 35.3%(+64.7)#13 | 29.0%(+71.0)#231 |
| 14. | Williams Canyon | 100.0% | 35.3%(+64.7)#14 | 29.0%(+71.0)#262 |
| 15. | Keeler | 100.0% | 35.3%(+64.7)#15 | 29.0%(+71.0)#284 |
| 16. | Sattley | 100.0% | 35.3%(+64.7)#16 | 29.0%(+71.0)#285 |
| 17. | Wilsonia | 100.0% | 35.3%(+64.7)#17 | 29.0%(+71.0)#288 |
| 18. | Eagleville | 100.0% | 35.3%(+64.7)#18 | 29.0%(+71.0)#340 |
| 19. | Graniteville | 100.0% | 35.3%(+64.7)#19 | 29.0%(+71.0)#347 |
| 20. | Proberta | 90.0% | 35.3%(+54.7)#20 | 29.0%(+61.0)#417 |
| 21. | Hardwick | 90.0% | 35.3%(+54.7)#21 | 29.0%(+61.0)#418 |
| 22. | Igo | 90.0% | 35.3%(+54.7)#22 | 29.0%(+61.0)#420 |
| 23. | La Vina | 88.2% | 35.3%(+52.9)#23 | 29.0%(+59.2)#434 |
| 24. | Artois | 88.2% | 35.3%(+52.9)#24 | 29.0%(+59.2)#437 |
| 25. | San Ardo | 84.5% | 35.3%(+49.2)#25 | 29.0%(+55.5)#497 |
| 26. | Stratford | 83.7% | 35.3%(+48.4)#26 | 29.0%(+54.7)#509 |
| 27. | Fiddletown | 83.3% | 35.3%(+48.0)#27 | 29.0%(+54.3)#516 |
| 28. | Las Lomas | 83.0% | 35.3%(+47.7)#28 | 29.0%(+54.0)#524 |
| 29. | Olancha | 83.0% | 35.3%(+47.7)#29 | 29.0%(+54.0)#526 |
| 30. | Delft Colony | 82.1% | 35.3%(+46.8)#30 | 29.0%(+53.1)#540 |
| 31. | Norris Canyon | 81.6% | 35.3%(+46.3)#31 | 29.0%(+52.6)#549 |
| 32. | Diablo | 81.6% | 35.3%(+46.3)#32 | 29.0%(+52.6)#550 |
| 33. | Downieville | 81.3% | 35.3%(+46.0)#33 | 29.0%(+52.3)#558 |
| 34. | Prattville | 79.3% | 35.3%(+44.0)#34 | 29.0%(+50.3)#604 |
| 35. | Chualar | 78.9% | 35.3%(+43.6)#35 | 29.0%(+49.9)#613 |
| 36. | Lee Vining | 77.9% | 35.3%(+42.6)#36 | 29.0%(+48.9)#639 |
| 37. | Rutherford | 77.8% | 35.3%(+42.5)#37 | 29.0%(+48.8)#645 |
| 38. | West Goshen | 77.1% | 35.3%(+41.8)#38 | 29.0%(+48.1)#661 |
| 39. | Lake Davis | 76.9% | 35.3%(+41.6)#39 | 29.0%(+47.9)#667 |
| 40. | Waukena | 76.9% | 35.3%(+41.6)#40 | 29.0%(+47.9)#668 |
| 41. | Waterloo | 76.4% | 35.3%(+41.1)#41 | 29.0%(+47.4)#683 |
| 42. | Comptche | 76.1% | 35.3%(+40.8)#42 | 29.0%(+47.1)#699 |
| 43. | Potrero | 75.4% | 35.3%(+40.1)#43 | 29.0%(+46.4)#718 |
| 44. | Hornitos | 74.4% | 35.3%(+39.1)#44 | 29.0%(+45.4)#763 |
| 45. | Boronda | 74.1% | 35.3%(+38.8)#45 | 29.0%(+45.1)#772 |
| 46. | Stones Landing | 73.8% | 35.3%(+38.5)#46 | 29.0%(+44.8)#782 |
| 47. | Lenwood | 73.3% | 35.3%(+38.0)#47 | 29.0%(+44.3)#794 |
| 48. | Bear Creek | 73.3% | 35.3%(+38.0)#48 | 29.0%(+44.3)#796 |
| 49. | Calpine | 72.2% | 35.3%(+36.9)#49 | 29.0%(+43.2)#825 |
| 50. | Stirling City | 71.7% | 35.3%(+36.4)#50 | 29.0%(+42.7)#837 |
| 51. | Ballico | 71.3% | 35.3%(+36.0)#51 | 29.0%(+42.3)#852 |
| 52. | Rail Road Flat | 70.6% | 35.3%(+35.3)#52 | 29.0%(+41.6)#870 |
| 53. | Laton | 70.3% | 35.3%(+35.0)#53 | 29.0%(+41.3)#878 |
| 54. | Newell | 69.7% | 35.3%(+34.4)#54 | 29.0%(+40.7)#903 |
| 55. | Alta | 69.1% | 35.3%(+33.8)#55 | 29.0%(+40.1)#930 |
| 56. | Aromas | 68.5% | 35.3%(+33.2)#56 | 29.0%(+39.5)#953 |
| 57. | Rollingwood | 68.1% | 35.3%(+32.8)#57 | 29.0%(+39.1)#979 |
| 58. | Castroville | 68.0% | 35.3%(+32.7)#58 | 29.0%(+39.0)#988 |
| 59. | Tuttletown | 67.9% | 35.3%(+32.6)#59 | 29.0%(+38.9)#992 |
| 60. | Thornton | 67.9% | 35.3%(+32.6)#60 | 29.0%(+38.9)#993 |
| 61. | Pike | 67.9% | 35.3%(+32.6)#61 | 29.0%(+38.9)#998 |
| 62. | Fuller Acres | 67.4% | 35.3%(+32.1)#62 | 29.0%(+38.4)#1,016 |
| 63. | Valley Acres | 67.4% | 35.3%(+32.1)#63 | 29.0%(+38.4)#1,017 |
| 64. | Goshen | 67.0% | 35.3%(+31.7)#64 | 29.0%(+38.0)#1,040 |
| 65. | Elk Creek | 66.7% | 35.3%(+31.4)#65 | 29.0%(+37.7)#1,080 |
| 66. | Oak Run | 66.4% | 35.3%(+31.1)#66 | 29.0%(+37.4)#1,098 |
| 67. | Millerton | 66.3% | 35.3%(+31.0)#67 | 29.0%(+37.3)#1,102 |
| 68. | Mountain Meadows | 66.3% | 35.3%(+31.0)#68 | 29.0%(+37.3)#1,109 |
| 69. | Callender | 65.9% | 35.3%(+30.6)#69 | 29.0%(+36.9)#1,130 |
| 70. | Fruitdale | 65.8% | 35.3%(+30.5)#70 | 29.0%(+36.8)#1,134 |
| 71. | Malaga | 65.3% | 35.3%(+30.0)#71 | 29.0%(+36.3)#1,161 |
| 72. | El Nido | 65.2% | 35.3%(+29.9)#72 | 29.0%(+36.2)#1,166 |
| 73. | Bonny Doon | 65.1% | 35.3%(+29.8)#73 | 29.0%(+36.1)#1,173 |
| 74. | Big Bend | 64.9% | 35.3%(+29.6)#74 | 29.0%(+35.9)#1,184 |
| 75. | Flournoy | 64.7% | 35.3%(+29.4)#75 | 29.0%(+35.7)#1,204 |
| 76. | Good Hope | 64.3% | 35.3%(+29.0)#76 | 29.0%(+35.3)#1,224 |
| 77. | Stebbins | 64.2% | 35.3%(+28.9)#77 | 29.0%(+35.2)#1,240 |
| 78. | San Geronimo | 64.0% | 35.3%(+28.7)#78 | 29.0%(+35.0)#1,249 |
| 79. | Meadow Vista | 63.9% | 35.3%(+28.6)#79 | 29.0%(+34.9)#1,253 |
| 80. | Fairhaven | 63.8% | 35.3%(+28.5)#80 | 29.0%(+34.8)#1,266 |
| 81. | Mesa | 63.7% | 35.3%(+28.4)#81 | 29.0%(+34.7)#1,272 |
| 82. | Stevinson | 63.6% | 35.3%(+28.3)#82 | 29.0%(+34.6)#1,277 |
| 83. | Lake City | 63.6% | 35.3%(+28.3)#83 | 29.0%(+34.6)#1,283 |
| 84. | Santa Rosa Valley | 63.0% | 35.3%(+27.7)#84 | 29.0%(+34.0)#1,321 |
| 85. | Elfin Forest | 62.7% | 35.3%(+27.4)#85 | 29.0%(+33.7)#1,339 |
| 86. | East Foothills | 62.6% | 35.3%(+27.3)#86 | 29.0%(+33.6)#1,341 |
| 87. | Romoland | 62.6% | 35.3%(+27.3)#87 | 29.0%(+33.6)#1,342 |
| 88. | Plainview | 62.5% | 35.3%(+27.2)#88 | 29.0%(+33.5)#1,349 |
| 89. | East Shore | 62.5% | 35.3%(+27.2)#89 | 29.0%(+33.5)#1,353 |
| 90. | Wilkerson | 62.1% | 35.3%(+26.8)#90 | 29.0%(+33.1)#1,408 |
| 91. | Meridian | 61.8% | 35.3%(+26.5)#91 | 29.0%(+32.8)#1,431 |
| 92. | Millville | 61.7% | 35.3%(+26.4)#92 | 29.0%(+32.7)#1,441 |
| 93. | Swall Meadows | 61.7% | 35.3%(+26.4)#93 | 29.0%(+32.7)#1,443 |
| 94. | Valinda | 61.5% | 35.3%(+26.2)#94 | 29.0%(+32.5)#1,450 |
| 95. | Trowbridge | 61.5% | 35.3%(+26.2)#95 | 29.0%(+32.5)#1,457 |
| 96. | Stonyford | 61.5% | 35.3%(+26.2)#96 | 29.0%(+32.5)#1,464 |
| 97. | Parklawn | 61.4% | 35.3%(+26.1)#97 | 29.0%(+32.4)#1,469 |
| 98. | Albion | 61.4% | 35.3%(+26.1)#98 | 29.0%(+32.4)#1,473 |
| 99. | Benton | 61.2% | 35.3%(+25.9)#99 | 29.0%(+32.2)#1,490 |
| 100. | Auburn Lake Trails | 61.1% | 35.3%(+25.8)#100 | 29.0%(+32.1)#1,496 |
Common Questions
What are the Top 10 Cities with the Highest Percentage of Households With Three or more Vehicles in California?
Top 10 Cities with the Highest Percentage of Households With Three or more Vehicles in California are:
#1
100.0%
#2
100.0%
#3
100.0%
#4
100.0%
#5
100.0%
#6
100.0%
#7
100.0%
#8
100.0%
#9
100.0%
#10
100.0%
What city has the Highest Percentage of Households With Three or more Vehicles in California?
Beale AFB has the Highest Percentage of Households With Three or more Vehicles in California with 100.0%.
What is the Percentage of Households With Three or more Vehicles in the State of California?
Percentage of Households With Three or more Vehicles in California is 35.3%.
What is the Percentage of Households With Three or more Vehicles in the United States?
Percentage of Households With Three or more Vehicles in the United States is 29.0%.