Cities with the Highest Percentage of Population Employed in Agriculture, Fishing & Hunting in California
RELATED REPORTS & OPTIONS
Agriculture, Fishing & Hunting
California
Compare Cities
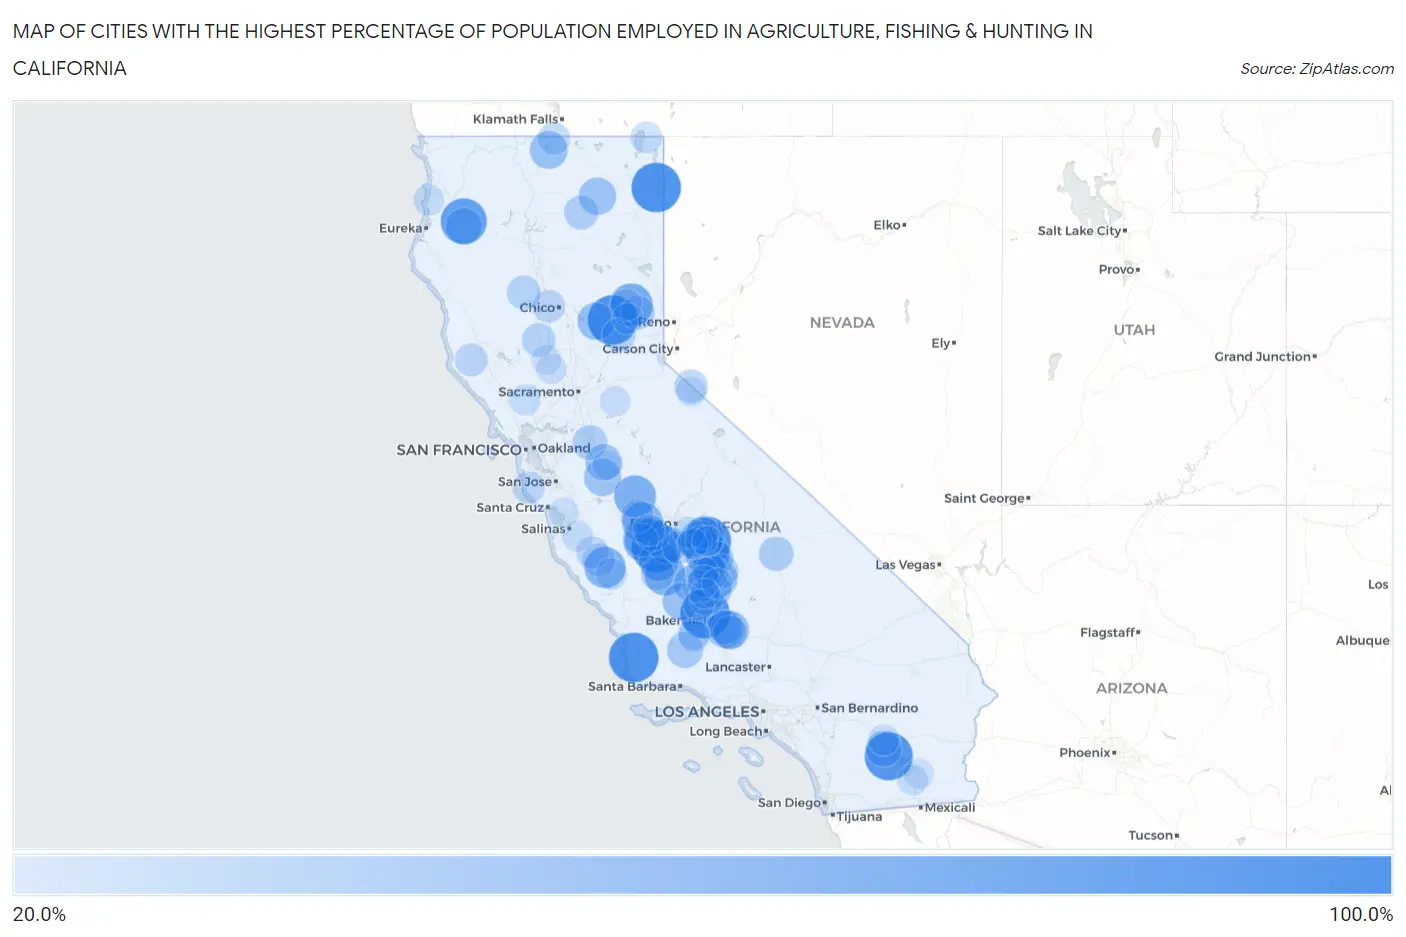
Map of Cities with the Highest Percentage of Population Employed in Agriculture, Fishing & Hunting in California
0.0%
100.0%
Cities with the Highest Percentage of Population Employed in Agriculture, Fishing & Hunting in California
| City | % Employed | vs State | vs National | |
| 1. | Westside | 100.0% | 2.0%(+98.0)#1 | 1.2%(+98.8)#6 |
| 2. | Cherokee Strip | 100.0% | 2.0%(+98.0)#2 | 1.2%(+98.8)#7 |
| 3. | Yettem | 100.0% | 2.0%(+98.0)#3 | 1.2%(+98.8)#11 |
| 4. | Post Mountain | 100.0% | 2.0%(+98.0)#4 | 1.2%(+98.8)#13 |
| 5. | Goodyears Bar | 100.0% | 2.0%(+98.0)#5 | 1.2%(+98.8)#19 |
| 6. | Casmalia | 100.0% | 2.0%(+98.0)#6 | 1.2%(+98.8)#20 |
| 7. | Jovista | 100.0% | 2.0%(+98.0)#7 | 1.2%(+98.8)#28 |
| 8. | Eagleville | 100.0% | 2.0%(+98.0)#8 | 1.2%(+98.8)#60 |
| 9. | Desert Shores | 94.8% | 2.0%(+92.8)#9 | 1.2%(+93.6)#75 |
| 10. | Woodville Farm Labor Camp | 90.4% | 2.0%(+88.5)#10 | 1.2%(+89.2)#76 |
| 11. | Trinity Village | 86.8% | 2.0%(+84.8)#11 | 1.2%(+85.6)#79 |
| 12. | Linnell Camp | 79.4% | 2.0%(+77.4)#12 | 1.2%(+78.2)#84 |
| 13. | Cantua Creek | 78.6% | 2.0%(+76.6)#13 | 1.2%(+77.4)#87 |
| 14. | C Road | 76.0% | 2.0%(+74.0)#14 | 1.2%(+74.8)#90 |
| 15. | Pumpkin Center | 72.7% | 2.0%(+70.7)#15 | 1.2%(+71.5)#96 |
| 16. | El Nido | 71.8% | 2.0%(+69.8)#16 | 1.2%(+70.6)#102 |
| 17. | San Lucas | 69.8% | 2.0%(+67.9)#17 | 1.2%(+68.6)#104 |
| 18. | Mendota | 68.3% | 2.0%(+66.3)#18 | 1.2%(+67.1)#105 |
| 19. | Kettleman City | 68.0% | 2.0%(+66.0)#19 | 1.2%(+66.8)#107 |
| 20. | Huron | 63.5% | 2.0%(+61.5)#20 | 1.2%(+62.3)#123 |
| 21. | East Orosi | 61.5% | 2.0%(+59.6)#21 | 1.2%(+60.3)#127 |
| 22. | Weedpatch | 58.2% | 2.0%(+56.2)#22 | 1.2%(+57.0)#146 |
| 23. | Edmundson Acres | 58.0% | 2.0%(+56.1)#23 | 1.2%(+56.8)#148 |
| 24. | Macdoel | 57.1% | 2.0%(+55.2)#24 | 1.2%(+55.9)#150 |
| 25. | Lanare | 56.4% | 2.0%(+54.4)#25 | 1.2%(+55.2)#158 |
| 26. | Clipper Mills | 56.4% | 2.0%(+54.4)#26 | 1.2%(+55.2)#159 |
| 27. | Terra Bella | 56.2% | 2.0%(+54.3)#27 | 1.2%(+55.1)#160 |
| 28. | Lookout | 55.6% | 2.0%(+53.6)#28 | 1.2%(+54.4)#165 |
| 29. | Alpaugh | 55.1% | 2.0%(+53.1)#29 | 1.2%(+53.9)#167 |
| 30. | Lost Hills | 54.9% | 2.0%(+52.9)#30 | 1.2%(+53.7)#171 |
| 31. | Crows Landing | 54.5% | 2.0%(+52.6)#31 | 1.2%(+53.3)#173 |
| 32. | Tonyville | 52.2% | 2.0%(+50.3)#32 | 1.2%(+51.0)#183 |
| 33. | Burnt Ranch | 51.9% | 2.0%(+50.0)#33 | 1.2%(+50.7)#186 |
| 34. | Riverdale Park | 51.7% | 2.0%(+49.7)#34 | 1.2%(+50.5)#188 |
| 35. | Oasis | 50.6% | 2.0%(+48.6)#35 | 1.2%(+49.4)#192 |
| 36. | Cuyama | 50.0% | 2.0%(+48.0)#36 | 1.2%(+48.8)#208 |
| 37. | Richgrove | 49.4% | 2.0%(+47.4)#37 | 1.2%(+48.2)#211 |
| 38. | La Grange | 47.8% | 2.0%(+45.8)#38 | 1.2%(+46.6)#221 |
| 39. | Earlimart | 47.5% | 2.0%(+45.5)#39 | 1.2%(+46.3)#223 |
| 40. | French Camp | 46.1% | 2.0%(+44.1)#40 | 1.2%(+44.9)#228 |
| 41. | Cartago | 45.7% | 2.0%(+43.7)#41 | 1.2%(+44.5)#231 |
| 42. | San Joaquin | 45.5% | 2.0%(+43.5)#42 | 1.2%(+44.3)#233 |
| 43. | East Porterville | 44.6% | 2.0%(+42.7)#43 | 1.2%(+43.4)#241 |
| 44. | Fall River Mills | 43.9% | 2.0%(+41.9)#44 | 1.2%(+42.7)#251 |
| 45. | Calpine | 43.8% | 2.0%(+41.8)#45 | 1.2%(+42.6)#252 |
| 46. | Lamont | 43.6% | 2.0%(+41.6)#46 | 1.2%(+42.4)#255 |
| 47. | Delft Colony | 43.4% | 2.0%(+41.4)#47 | 1.2%(+42.2)#257 |
| 48. | Arvin | 43.1% | 2.0%(+41.1)#48 | 1.2%(+41.9)#258 |
| 49. | Poplar Cotton Center | 42.9% | 2.0%(+40.9)#49 | 1.2%(+41.7)#259 |
| 50. | Flournoy | 42.9% | 2.0%(+40.9)#50 | 1.2%(+41.7)#261 |
| 51. | Woodville | 42.5% | 2.0%(+40.5)#51 | 1.2%(+41.3)#269 |
| 52. | Maxwell | 42.1% | 2.0%(+40.1)#52 | 1.2%(+40.9)#272 |
| 53. | Mcfarland | 42.1% | 2.0%(+40.1)#53 | 1.2%(+40.9)#274 |
| 54. | Sultana | 41.9% | 2.0%(+39.9)#54 | 1.2%(+40.7)#276 |
| 55. | Three Rocks | 41.4% | 2.0%(+39.4)#55 | 1.2%(+40.2)#282 |
| 56. | Topaz | 41.4% | 2.0%(+39.4)#56 | 1.2%(+40.2)#283 |
| 57. | London | 41.4% | 2.0%(+39.4)#57 | 1.2%(+40.2)#284 |
| 58. | Avenal | 41.3% | 2.0%(+39.3)#58 | 1.2%(+40.1)#287 |
| 59. | Washington | 40.8% | 2.0%(+38.8)#59 | 1.2%(+39.6)#293 |
| 60. | Firebaugh | 40.8% | 2.0%(+38.8)#60 | 1.2%(+39.6)#295 |
| 61. | King City | 40.3% | 2.0%(+38.3)#61 | 1.2%(+39.1)#302 |
| 62. | Hardwick | 39.7% | 2.0%(+37.8)#62 | 1.2%(+38.5)#311 |
| 63. | Allensworth | 39.6% | 2.0%(+37.6)#63 | 1.2%(+38.4)#312 |
| 64. | Hamilton City | 39.4% | 2.0%(+37.4)#64 | 1.2%(+38.2)#316 |
| 65. | Boonville | 39.2% | 2.0%(+37.2)#65 | 1.2%(+38.0)#317 |
| 66. | Greenfield | 38.5% | 2.0%(+36.5)#66 | 1.2%(+37.3)#327 |
| 67. | Monson | 38.1% | 2.0%(+36.1)#67 | 1.2%(+36.9)#333 |
| 68. | Dorris | 38.1% | 2.0%(+36.1)#68 | 1.2%(+36.9)#335 |
| 69. | Pescadero | 37.6% | 2.0%(+35.6)#69 | 1.2%(+36.4)#337 |
| 70. | Di Giorgio | 37.5% | 2.0%(+35.5)#70 | 1.2%(+36.3)#338 |
| 71. | Orange Cove | 37.2% | 2.0%(+35.3)#71 | 1.2%(+36.0)#349 |
| 72. | Tipton | 37.0% | 2.0%(+35.0)#72 | 1.2%(+35.8)#352 |
| 73. | Teviston | 36.9% | 2.0%(+34.9)#73 | 1.2%(+35.7)#353 |
| 74. | Ford City | 35.6% | 2.0%(+33.6)#74 | 1.2%(+34.4)#376 |
| 75. | Graeagle | 35.6% | 2.0%(+33.6)#75 | 1.2%(+34.4)#377 |
| 76. | Johnson Park | 35.5% | 2.0%(+33.5)#76 | 1.2%(+34.3)#379 |
| 77. | Tranquillity | 35.4% | 2.0%(+33.4)#77 | 1.2%(+34.2)#380 |
| 78. | New Pine Creek | 35.3% | 2.0%(+33.3)#78 | 1.2%(+34.1)#382 |
| 79. | San Ardo | 35.2% | 2.0%(+33.2)#79 | 1.2%(+34.0)#385 |
| 80. | South Taft | 35.1% | 2.0%(+33.1)#80 | 1.2%(+33.9)#388 |
| 81. | Parlier | 34.5% | 2.0%(+32.5)#81 | 1.2%(+33.3)#398 |
| 82. | Thermal | 33.7% | 2.0%(+31.7)#82 | 1.2%(+32.5)#409 |
| 83. | Chualar | 33.5% | 2.0%(+31.5)#83 | 1.2%(+32.3)#412 |
| 84. | Rutherford | 33.3% | 2.0%(+31.3)#84 | 1.2%(+32.1)#417 |
| 85. | Big Lagoon | 33.3% | 2.0%(+31.3)#85 | 1.2%(+32.1)#418 |
| 86. | Ducor | 33.2% | 2.0%(+31.2)#86 | 1.2%(+32.0)#432 |
| 87. | Westmorland | 32.8% | 2.0%(+30.8)#87 | 1.2%(+31.6)#446 |
| 88. | Sierra City | 32.6% | 2.0%(+30.6)#88 | 1.2%(+31.4)#450 |
| 89. | East Bakersfield | 32.2% | 2.0%(+30.2)#89 | 1.2%(+31.0)#455 |
| 90. | Drytown | 32.0% | 2.0%(+30.0)#90 | 1.2%(+30.8)#458 |
| 91. | Traver | 31.7% | 2.0%(+29.8)#91 | 1.2%(+30.5)#469 |
| 92. | Dunnigan | 31.6% | 2.0%(+29.7)#92 | 1.2%(+30.4)#471 |
| 93. | Seville | 31.5% | 2.0%(+29.5)#93 | 1.2%(+30.3)#477 |
| 94. | Wasco | 31.2% | 2.0%(+29.2)#94 | 1.2%(+30.0)#484 |
| 95. | Coleville | 31.0% | 2.0%(+29.0)#95 | 1.2%(+29.8)#492 |
| 96. | Pajaro | 30.6% | 2.0%(+28.6)#96 | 1.2%(+29.4)#516 |
| 97. | Delano | 30.3% | 2.0%(+28.3)#97 | 1.2%(+29.1)#526 |
| 98. | Cowan | 30.1% | 2.0%(+28.2)#98 | 1.2%(+28.9)#529 |
| 99. | Calipatria | 29.8% | 2.0%(+27.9)#99 | 1.2%(+28.6)#536 |
| 100. | Arbuckle | 29.8% | 2.0%(+27.9)#100 | 1.2%(+28.6)#537 |
Common Questions
What are the Top 10 Cities with the Highest Percentage of Population Employed in Agriculture, Fishing & Hunting in California?
Top 10 Cities with the Highest Percentage of Population Employed in Agriculture, Fishing & Hunting in California are:
#1
100.0%
#2
100.0%
#3
100.0%
#4
100.0%
#5
100.0%
#6
100.0%
#7
94.8%
#8
86.8%
#9
79.4%
#10
78.6%
What city has the Highest Percentage of Population Employed in Agriculture, Fishing & Hunting in California?
Westside has the Highest Percentage of Population Employed in Agriculture, Fishing & Hunting in California with 100.0%.
What is the Percentage of Population Employed in Agriculture, Fishing & Hunting in the State of California?
Percentage of Population Employed in Agriculture, Fishing & Hunting in California is 2.0%.
What is the Percentage of Population Employed in Agriculture, Fishing & Hunting in the United States?
Percentage of Population Employed in Agriculture, Fishing & Hunting in the United States is 1.2%.