Cities with the Highest Percentage of Immigrants from Eastern Europe in California
RELATED REPORTS & OPTIONS
Eastern Europe
California
Compare Cities
Map of Cities with the Highest Percentage of Immigrants from Eastern Europe in California
0.00%
20.00%
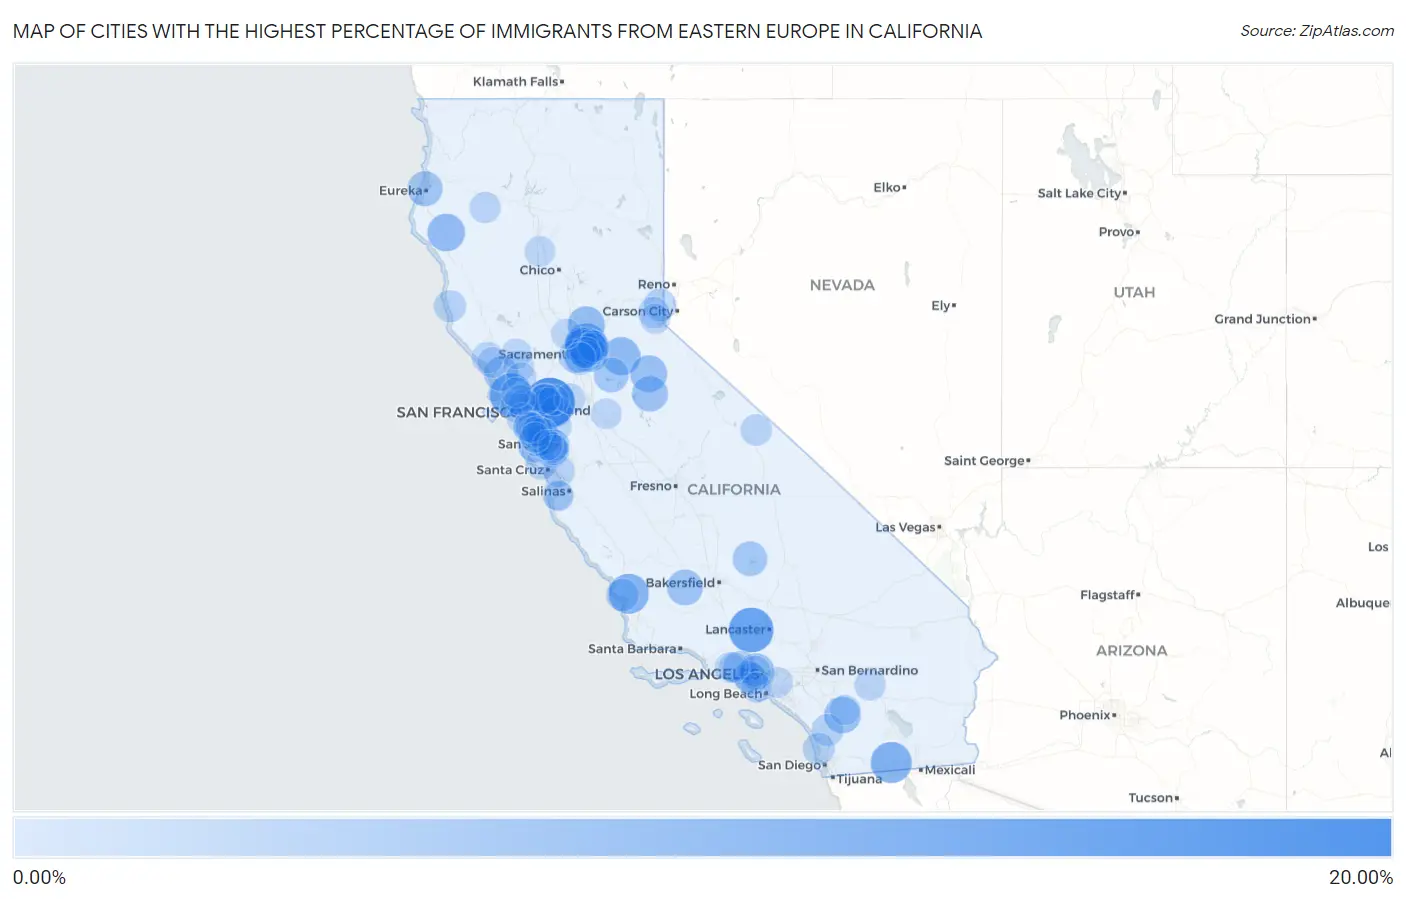
Cities with the Highest Percentage of Immigrants from Eastern Europe in California
| City | Eastern Europe | vs State | vs National | |
| 1. | North Gate | 18.56% | 0.68%(+17.9)#1 | 0.67%(+17.9)#19 |
| 2. | Lake Hughes | 14.19% | 0.68%(+13.5)#2 | 0.67%(+13.5)#34 |
| 3. | San Geronimo | 12.88% | 0.68%(+12.2)#3 | 0.67%(+12.2)#46 |
| 4. | Ocotillo | 10.96% | 0.68%(+10.3)#4 | 0.67%(+10.3)#65 |
| 5. | Antelope | 10.82% | 0.68%(+10.1)#5 | 0.67%(+10.2)#67 |
| 6. | Edna | 10.14% | 0.68%(+9.46)#6 | 0.67%(+9.47)#72 |
| 7. | North Highlands | 10.02% | 0.68%(+9.33)#7 | 0.67%(+9.35)#76 |
| 8. | River Pines | 8.42% | 0.68%(+7.74)#8 | 0.67%(+7.75)#100 |
| 9. | Foothill Farms | 8.19% | 0.68%(+7.51)#9 | 0.67%(+7.53)#105 |
| 10. | Miranda | 7.93% | 0.68%(+7.24)#10 | 0.67%(+7.26)#113 |
| 11. | Sheridan | 7.73% | 0.68%(+7.05)#11 | 0.67%(+7.06)#117 |
| 12. | Dorrington | 7.43% | 0.68%(+6.75)#12 | 0.67%(+6.76)#121 |
| 13. | Aguanga | 7.13% | 0.68%(+6.45)#13 | 0.67%(+6.46)#134 |
| 14. | West Hollywood | 6.50% | 0.68%(+5.82)#14 | 0.67%(+5.83)#161 |
| 15. | Mckittrick | 6.45% | 0.68%(+5.77)#15 | 0.67%(+5.78)#163 |
| 16. | Twain Harte | 6.41% | 0.68%(+5.72)#16 | 0.67%(+5.74)#167 |
| 17. | Samoa | 5.83% | 0.68%(+5.15)#17 | 0.67%(+5.16)#197 |
| 18. | Castle Hill | 5.74% | 0.68%(+5.06)#18 | 0.67%(+5.08)#203 |
| 19. | Buena Vista | 5.61% | 0.68%(+4.93)#19 | 0.67%(+4.94)#209 |
| 20. | Bloomfield | 5.58% | 0.68%(+4.90)#20 | 0.67%(+4.92)#213 |
| 21. | La Honda | 5.56% | 0.68%(+4.87)#21 | 0.67%(+4.89)#217 |
| 22. | Wofford Heights | 5.47% | 0.68%(+4.79)#22 | 0.67%(+4.80)#222 |
| 23. | Citrus Heights | 4.93% | 0.68%(+4.25)#23 | 0.67%(+4.26)#274 |
| 24. | Contra Costa Centre | 4.81% | 0.68%(+4.13)#24 | 0.67%(+4.14)#289 |
| 25. | Rancho Cordova | 4.51% | 0.68%(+3.83)#25 | 0.67%(+3.84)#321 |
| 26. | Rio Linda | 4.39% | 0.68%(+3.71)#26 | 0.67%(+3.73)#329 |
| 27. | Mountain Meadows | 4.33% | 0.68%(+3.65)#27 | 0.67%(+3.66)#340 |
| 28. | Carmichael | 4.31% | 0.68%(+3.63)#28 | 0.67%(+3.64)#342 |
| 29. | Calabasas | 4.16% | 0.68%(+3.48)#29 | 0.67%(+3.50)#362 |
| 30. | West Sacramento | 4.01% | 0.68%(+3.33)#30 | 0.67%(+3.34)#391 |
| 31. | Elverta | 3.94% | 0.68%(+3.26)#31 | 0.67%(+3.27)#402 |
| 32. | Pepperdine University | 3.87% | 0.68%(+3.18)#32 | 0.67%(+3.20)#416 |
| 33. | Avila Beach | 3.81% | 0.68%(+3.13)#33 | 0.67%(+3.15)#422 |
| 34. | Marina Del Rey | 3.72% | 0.68%(+3.04)#34 | 0.67%(+3.05)#436 |
| 35. | Lemon Hill | 3.65% | 0.68%(+2.97)#35 | 0.67%(+2.98)#450 |
| 36. | Tahoe Vista | 3.59% | 0.68%(+2.90)#36 | 0.67%(+2.92)#471 |
| 37. | Los Gatos | 3.37% | 0.68%(+2.69)#37 | 0.67%(+2.70)#511 |
| 38. | Mountain View | 3.28% | 0.68%(+2.60)#38 | 0.67%(+2.62)#526 |
| 39. | Hidden Meadows | 3.19% | 0.68%(+2.51)#39 | 0.67%(+2.52)#548 |
| 40. | Albion | 3.15% | 0.68%(+2.47)#40 | 0.67%(+2.49)#560 |
| 41. | Fair Oaks | 3.08% | 0.68%(+2.39)#41 | 0.67%(+2.41)#581 |
| 42. | Del Mar | 3.06% | 0.68%(+2.38)#42 | 0.67%(+2.39)#587 |
| 43. | Muir Beach | 2.95% | 0.68%(+2.27)#43 | 0.67%(+2.28)#612 |
| 44. | Burbank | 2.87% | 0.68%(+2.18)#44 | 0.67%(+2.20)#645 |
| 45. | Los Altos | 2.82% | 0.68%(+2.14)#45 | 0.67%(+2.15)#665 |
| 46. | Aptos Hills Larkin Valley | 2.81% | 0.68%(+2.12)#46 | 0.67%(+2.14)#669 |
| 47. | Bonny Doon | 2.80% | 0.68%(+2.12)#47 | 0.67%(+2.13)#672 |
| 48. | Rosemont | 2.71% | 0.68%(+2.03)#48 | 0.67%(+2.04)#699 |
| 49. | Orangevale | 2.71% | 0.68%(+2.03)#49 | 0.67%(+2.04)#703 |
| 50. | Reliez Valley | 2.66% | 0.68%(+1.98)#50 | 0.67%(+2.00)#718 |
| 51. | Walnut Creek | 2.66% | 0.68%(+1.98)#51 | 0.67%(+1.99)#721 |
| 52. | Chalfant | 2.64% | 0.68%(+1.96)#52 | 0.67%(+1.98)#727 |
| 53. | Cazadero | 2.63% | 0.68%(+1.94)#53 | 0.67%(+1.96)#740 |
| 54. | Palo Alto | 2.62% | 0.68%(+1.93)#54 | 0.67%(+1.95)#747 |
| 55. | Sunnyside Tahoe City | 2.60% | 0.68%(+1.92)#55 | 0.67%(+1.94)#754 |
| 56. | Santa Monica | 2.59% | 0.68%(+1.91)#56 | 0.67%(+1.92)#763 |
| 57. | Camino Tassajara | 2.55% | 0.68%(+1.87)#57 | 0.67%(+1.88)#777 |
| 58. | Hayfork | 2.54% | 0.68%(+1.86)#58 | 0.67%(+1.87)#780 |
| 59. | Foster City | 2.54% | 0.68%(+1.86)#59 | 0.67%(+1.87)#781 |
| 60. | Tiburon | 2.53% | 0.68%(+1.85)#60 | 0.67%(+1.87)#783 |
| 61. | Arden Arcade | 2.50% | 0.68%(+1.82)#61 | 0.67%(+1.84)#798 |
| 62. | Sky Valley | 2.47% | 0.68%(+1.79)#62 | 0.67%(+1.80)#819 |
| 63. | Broadmoor | 2.44% | 0.68%(+1.76)#63 | 0.67%(+1.78)#835 |
| 64. | Menlo Park | 2.43% | 0.68%(+1.75)#64 | 0.67%(+1.76)#842 |
| 65. | Beverly Hills | 2.43% | 0.68%(+1.75)#65 | 0.67%(+1.76)#843 |
| 66. | East Palo Alto | 2.34% | 0.68%(+1.65)#66 | 0.67%(+1.67)#891 |
| 67. | Portola Valley | 2.30% | 0.68%(+1.61)#67 | 0.67%(+1.63)#912 |
| 68. | East Whittier | 2.21% | 0.68%(+1.52)#68 | 0.67%(+1.54)#959 |
| 69. | Burlingame | 2.18% | 0.68%(+1.50)#69 | 0.67%(+1.51)#976 |
| 70. | Hillsborough | 2.14% | 0.68%(+1.46)#70 | 0.67%(+1.47)#999 |
| 71. | Richfield | 2.11% | 0.68%(+1.43)#71 | 0.67%(+1.45)#1,021 |
| 72. | San Carlos | 2.08% | 0.68%(+1.40)#72 | 0.67%(+1.42)#1,042 |
| 73. | Monte Rio | 2.08% | 0.68%(+1.39)#73 | 0.67%(+1.41)#1,048 |
| 74. | Sunol | 2.07% | 0.68%(+1.38)#74 | 0.67%(+1.40)#1,059 |
| 75. | Fruitdale | 2.05% | 0.68%(+1.37)#75 | 0.67%(+1.38)#1,067 |
| 76. | Clayton | 2.05% | 0.68%(+1.37)#76 | 0.67%(+1.38)#1,069 |
| 77. | Del Rio | 2.01% | 0.68%(+1.32)#77 | 0.67%(+1.34)#1,093 |
| 78. | Knightsen | 2.00% | 0.68%(+1.32)#78 | 0.67%(+1.34)#1,095 |
| 79. | Campbell | 1.98% | 0.68%(+1.29)#79 | 0.67%(+1.31)#1,112 |
| 80. | Kenwood | 1.97% | 0.68%(+1.29)#80 | 0.67%(+1.30)#1,116 |
| 81. | Fruitridge Pocket | 1.97% | 0.68%(+1.28)#81 | 0.67%(+1.30)#1,118 |
| 82. | Pleasant Hill | 1.91% | 0.68%(+1.23)#82 | 0.67%(+1.24)#1,161 |
| 83. | Calistoga | 1.89% | 0.68%(+1.20)#83 | 0.67%(+1.22)#1,180 |
| 84. | Cambrian Park | 1.89% | 0.68%(+1.20)#84 | 0.67%(+1.22)#1,182 |
| 85. | Redwood City | 1.87% | 0.68%(+1.19)#85 | 0.67%(+1.21)#1,196 |
| 86. | Westlake Village | 1.86% | 0.68%(+1.18)#86 | 0.67%(+1.19)#1,205 |
| 87. | Rancho Mission Viejo | 1.84% | 0.68%(+1.16)#87 | 0.67%(+1.17)#1,224 |
| 88. | Lake Riverside | 1.83% | 0.68%(+1.15)#88 | 0.67%(+1.17)#1,230 |
| 89. | Agoura Hills | 1.83% | 0.68%(+1.14)#89 | 0.67%(+1.16)#1,238 |
| 90. | Redondo Beach | 1.81% | 0.68%(+1.13)#90 | 0.67%(+1.15)#1,248 |
| 91. | San Mateo | 1.79% | 0.68%(+1.11)#91 | 0.67%(+1.12)#1,278 |
| 92. | Cupertino | 1.79% | 0.68%(+1.10)#92 | 0.67%(+1.12)#1,283 |
| 93. | Tahoma | 1.77% | 0.68%(+1.09)#93 | 0.67%(+1.11)#1,294 |
| 94. | Monterey | 1.77% | 0.68%(+1.09)#94 | 0.67%(+1.10)#1,298 |
| 95. | Robbins | 1.76% | 0.68%(+1.08)#95 | 0.67%(+1.09)#1,306 |
| 96. | Woodside | 1.75% | 0.68%(+1.07)#96 | 0.67%(+1.08)#1,318 |
| 97. | Temelec | 1.71% | 0.68%(+1.03)#97 | 0.67%(+1.05)#1,348 |
| 98. | Larkspur | 1.70% | 0.68%(+1.02)#98 | 0.67%(+1.04)#1,364 |
| 99. | Del Rey Oaks | 1.68% | 0.68%(+0.993)#99 | 0.67%(+1.01)#1,389 |
| 100. | Lucas Valley Marinwood | 1.66% | 0.68%(+0.975)#100 | 0.67%(+0.991)#1,408 |
Common Questions
What are the Top 10 Cities with the Highest Percentage of Immigrants from Eastern Europe in California?
Top 10 Cities with the Highest Percentage of Immigrants from Eastern Europe in California are:
#1
18.56%
#2
14.19%
#3
12.88%
#4
10.96%
#5
10.82%
#6
10.14%
#7
10.02%
#8
8.42%
#9
8.19%
#10
7.93%
What city has the Highest Percentage of Immigrants from Eastern Europe in California?
North Gate has the Highest Percentage of Immigrants from Eastern Europe in California with 18.56%.
What is the Percentage of Immigrants from Eastern Europe in the State of California?
Percentage of Immigrants from Eastern Europe in California is 0.68%.
What is the Percentage of Immigrants from Eastern Europe in the United States?
Percentage of Immigrants from Eastern Europe in the United States is 0.67%.