Colorado Map & Demographics
Colorado Map
Colorado Overview
Aug 1, 1876
INCORPORATED
104,094
TOTAL AREA [ SQ MI ]
103,641
LAND AREA [ SQ MI ]
454
WATER AREA [ SQ MI ]
6,800
ELEVATION AVG [ FT ]
14,440
ELEVATION HIGH [ FT ]
3,315
ELEVATION LOW [ FT ]
55.7
POP DENSITY [ PPL / SQ MI ]
$47,346
PER CAPITA INCOME
$108,664
AVG FAMILY INCOME
$87,598
AVG HOUSEHOLD INCOME
28.4%
WAGE / INCOME GAP [ % ]
71.6¢/ $1
WAGE / INCOME GAP [ $ ]
$11,245
FAMILY INCOME DEFICIT
0.46
INEQUALITY / GINI INDEX
80134
LARGEST ZIP CODE
Denver
LARGEST CITY
El Paso County
LARGEST COUNTY
5,770,790
TOTAL POPULATION
2,927,588
MALE POPULATION
2,843,202
FEMALE POPULATION
102.97
MALES / 100 FEMALES
97.12
FEMALES / 100 MALES
37.3
MEDIAN AGE
3.1
AVG FAMILY SIZE
2.5
AVG HOUSEHOLD SIZE
3,207,091
LABOR FORCE [ PEOPLE ]
68.6%
PERCENT IN LABOR FORCE
4.5%
UNEMPLOYMENT RATE
Income in Colorado
Income Overview in Colorado
Per Capita Income in Colorado is $47,346, while median incomes of families and households are $108,664 and $87,598 respectively.
| Characteristic | Number | Measure |
| Per Capita Income | 5,770,790 | $47,346 |
| Median Family Income | 1,427,813 | $108,664 |
| Mean Family Income | 1,427,813 | $139,321 |
| Median Household Income | 2,278,044 | $87,598 |
| Mean Household Income | 2,278,044 | $117,508 |
| Income Deficit | 1,427,813 | $11,245 |
| Wage / Income Gap (%) | 5,770,790 | 28.44% |
| Wage / Income Gap ($) | 5,770,790 | 71.56¢ per $1 |
| Gini / Inequality Index | 5,770,790 | 0.46 |
Earnings by Sex in Colorado
Average Earnings in Colorado are $46,709, $54,888 for men and $39,279 for women, a difference of 28.4%.
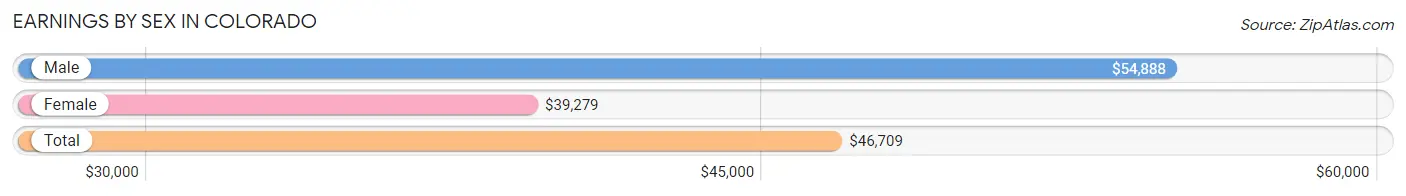
| Sex | Number | Average Earnings |
| Male | 1,816,877 (54.1%) | $54,888 |
| Female | 1,540,904 (45.9%) | $39,279 |
| Total | 3,357,781 (100.0%) | $46,709 |
Earnings by Sex by Income Bracket in Colorado
The most common earnings brackets in Colorado are $100,000+ for men (420,225 | 23.1%) and $100,000+ for women (179,687 | 11.7%).
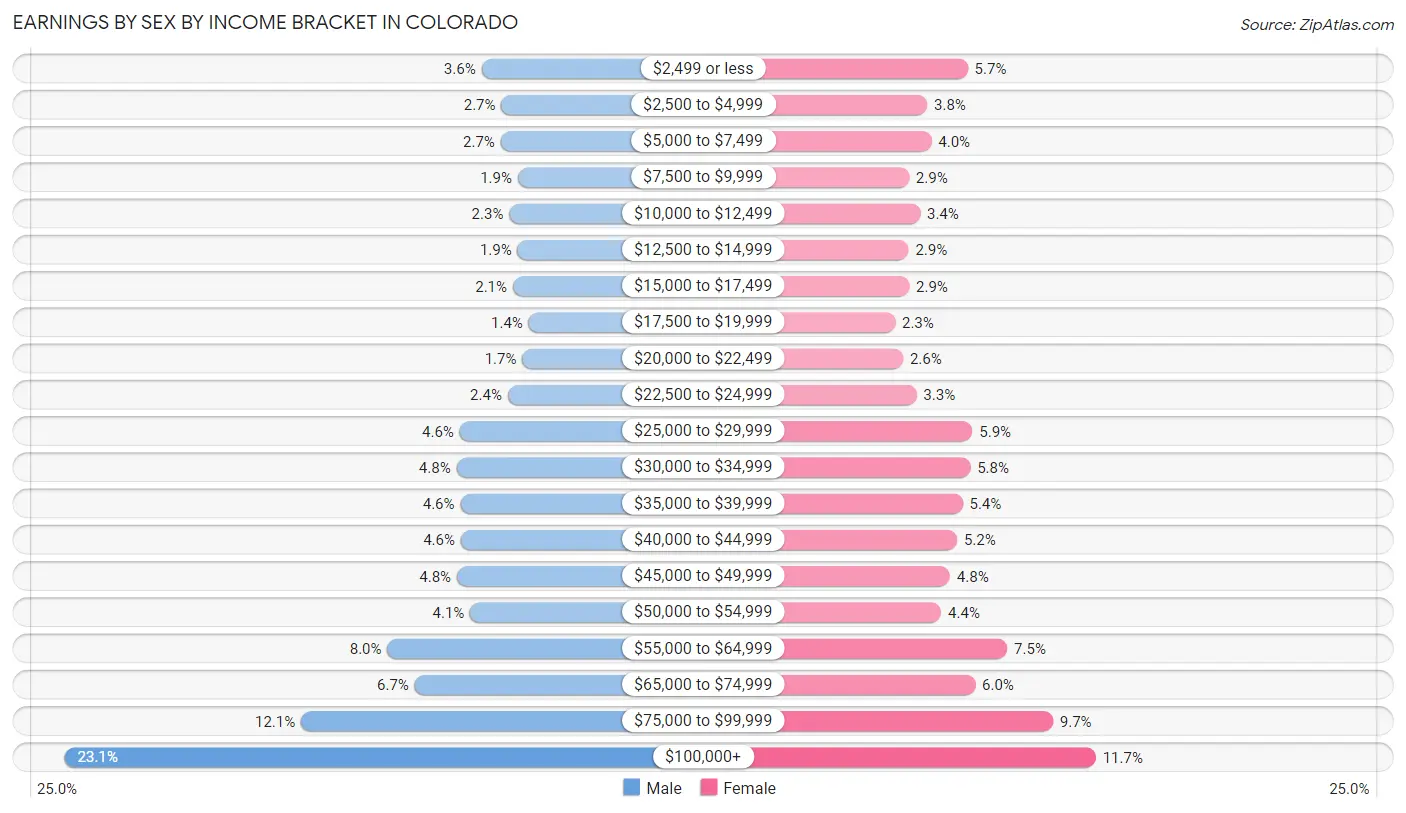
| Income | Male | Female |
| $2,499 or less | 65,350 (3.6%) | 87,221 (5.7%) |
| $2,500 to $4,999 | 48,427 (2.7%) | 57,996 (3.8%) |
| $5,000 to $7,499 | 49,037 (2.7%) | 61,017 (4.0%) |
| $7,500 to $9,999 | 34,558 (1.9%) | 44,777 (2.9%) |
| $10,000 to $12,499 | 41,869 (2.3%) | 52,841 (3.4%) |
| $12,500 to $14,999 | 34,771 (1.9%) | 44,585 (2.9%) |
| $15,000 to $17,499 | 38,720 (2.1%) | 44,940 (2.9%) |
| $17,500 to $19,999 | 25,222 (1.4%) | 34,839 (2.3%) |
| $20,000 to $22,499 | 30,639 (1.7%) | 40,549 (2.6%) |
| $22,500 to $24,999 | 42,989 (2.4%) | 50,212 (3.3%) |
| $25,000 to $29,999 | 84,024 (4.6%) | 90,616 (5.9%) |
| $30,000 to $34,999 | 86,743 (4.8%) | 89,102 (5.8%) |
| $35,000 to $39,999 | 83,329 (4.6%) | 83,553 (5.4%) |
| $40,000 to $44,999 | 83,023 (4.6%) | 79,502 (5.2%) |
| $45,000 to $49,999 | 86,276 (4.8%) | 74,396 (4.8%) |
| $50,000 to $54,999 | 75,025 (4.1%) | 68,046 (4.4%) |
| $55,000 to $64,999 | 145,558 (8.0%) | 115,702 (7.5%) |
| $65,000 to $74,999 | 122,214 (6.7%) | 92,645 (6.0%) |
| $75,000 to $99,999 | 218,878 (12.0%) | 148,678 (9.7%) |
| $100,000+ | 420,225 (23.1%) | 179,687 (11.7%) |
| Total | 1,816,877 (100.0%) | 1,540,904 (100.0%) |
Earnings by Sex by Educational Attainment in Colorado
Average earnings in Colorado are $62,940 for men and $45,754 for women, a difference of 27.3%. Men with an educational attainment of graduate degree enjoy the highest average annual earnings of $103,599, while those with less than high school education earn the least with $41,871. Women with an educational attainment of graduate degree earn the most with the average annual earnings of $69,883, while those with less than high school education have the smallest earnings of $25,333.
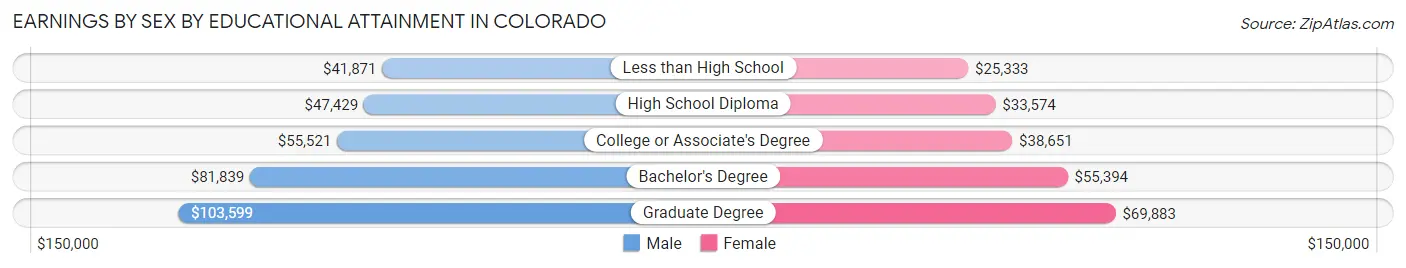
| Educational Attainment | Male Income | Female Income |
| Less than High School | $41,871 | $25,333 |
| High School Diploma | $47,429 | $33,574 |
| College or Associate's Degree | $55,521 | $38,651 |
| Bachelor's Degree | $81,839 | $55,394 |
| Graduate Degree | $103,599 | $69,883 |
| Total | $62,940 | $45,754 |
Family Income in Colorado
Family Income Brackets in Colorado
According to the Colorado family income data, there are 318,402 families falling into the $100,000 to $149,999 income range, which is the most common income bracket and makes up 22.3% of all families. Conversely, the $10,000 to $14,999 income bracket is the least frequent group with only 17,134 families (1.2%) belonging to this category.
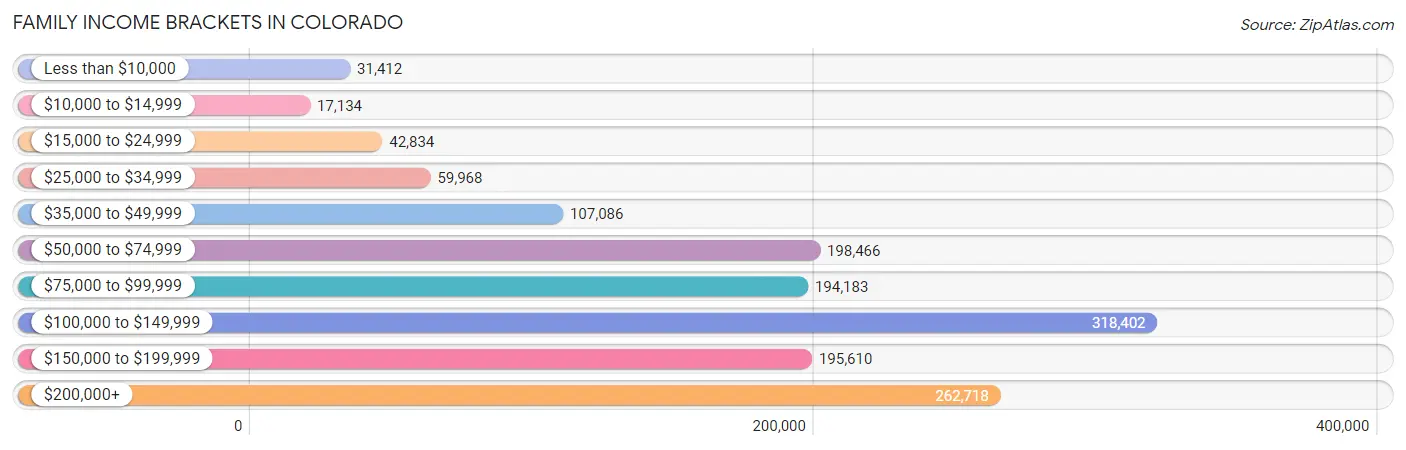
| Income Bracket | # Families | % Families |
| Less than $10,000 | 31,412 | 2.2% |
| $10,000 to $14,999 | 17,134 | 1.2% |
| $15,000 to $24,999 | 42,834 | 3.0% |
| $25,000 to $34,999 | 59,968 | 4.2% |
| $35,000 to $49,999 | 107,086 | 7.5% |
| $50,000 to $74,999 | 198,466 | 13.9% |
| $75,000 to $99,999 | 194,183 | 13.6% |
| $100,000 to $149,999 | 318,402 | 22.3% |
| $150,000 to $199,999 | 195,610 | 13.7% |
| $200,000+ | 262,718 | 18.4% |
Family Income by Famaliy Size in Colorado
4-person families (262,383 | 18.4%) account for the highest median family income in Colorado with $130,104 per family, while 2-person families (686,575 | 48.1%) have the highest median income of $48,641 per family member.
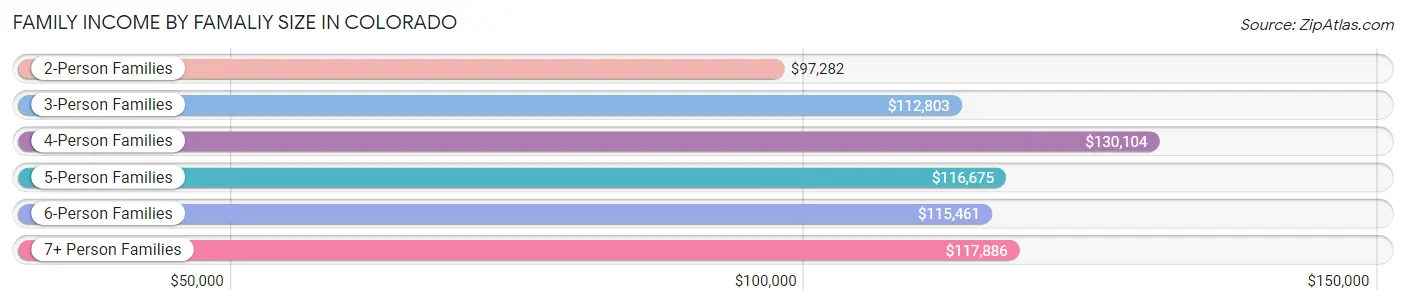
| Income Bracket | # Families | Median Income |
| 2-Person Families | 686,575 (48.1%) | $97,282 |
| 3-Person Families | 302,674 (21.2%) | $112,803 |
| 4-Person Families | 262,383 (18.4%) | $130,104 |
| 5-Person Families | 111,645 (7.8%) | $116,675 |
| 6-Person Families | 41,783 (2.9%) | $115,461 |
| 7+ Person Families | 22,753 (1.6%) | $117,886 |
| Total | 1,427,813 (100.0%) | $108,664 |
Family Income by Number of Earners in Colorado
The median family income in Colorado is $108,664, with families comprising 3+ earners (169,098) having the highest median family income of $153,358, while families with no earners (175,120) have the lowest median family income of $63,478, accounting for 11.8% and 12.3% of families, respectively.
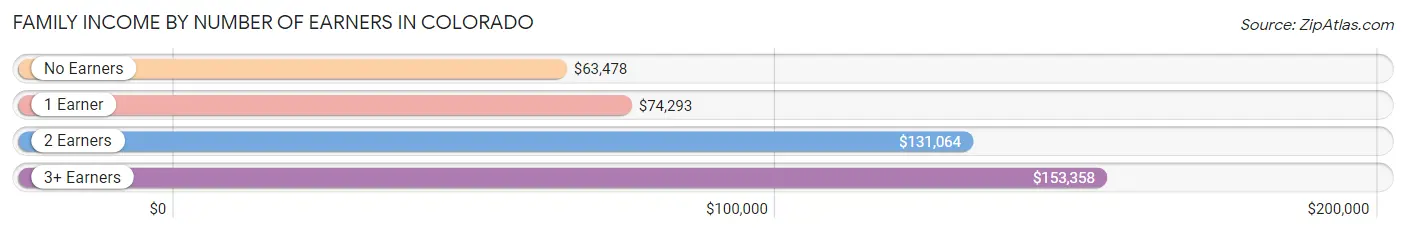
| Number of Earners | # Families | Median Income |
| No Earners | 175,120 (12.3%) | $63,478 |
| 1 Earner | 416,469 (29.2%) | $74,293 |
| 2 Earners | 667,126 (46.7%) | $131,064 |
| 3+ Earners | 169,098 (11.8%) | $153,358 |
| Total | 1,427,813 (100.0%) | $108,664 |
Household Income in Colorado
Household Income Brackets in Colorado
With 437,384 households falling in the category, the $100,000 to $149,999 income range is the most frequent in Colorado, accounting for 19.2% of all households. In contrast, only 61,507 households (2.7%) fall into the $10,000 to $14,999 income bracket, making it the least populous group.
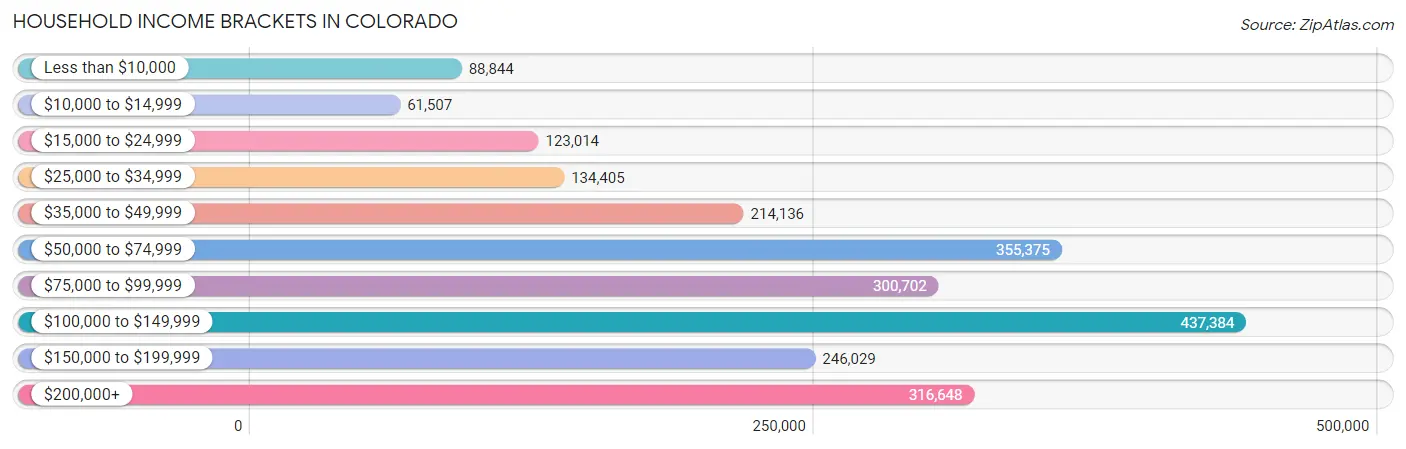
| Income Bracket | # Households | % Households |
| Less than $10,000 | 88,844 | 3.9% |
| $10,000 to $14,999 | 61,507 | 2.7% |
| $15,000 to $24,999 | 123,014 | 5.4% |
| $25,000 to $34,999 | 134,405 | 5.9% |
| $35,000 to $49,999 | 214,136 | 9.4% |
| $50,000 to $74,999 | 355,375 | 15.6% |
| $75,000 to $99,999 | 300,702 | 13.2% |
| $100,000 to $149,999 | 437,384 | 19.2% |
| $150,000 to $199,999 | 246,029 | 10.8% |
| $200,000+ | 316,648 | 13.9% |
Household Income by Householder Age in Colorado
The median household income in Colorado is $87,598, with the highest median household income of $106,020 found in the 45 to 64 years age bracket for the primary householder. A total of 799,044 households (35.1%) fall into this category. Meanwhile, the 15 to 24 years age bracket for the primary householder has the lowest median household income of $47,039, with 108,820 households (4.8%) in this group.
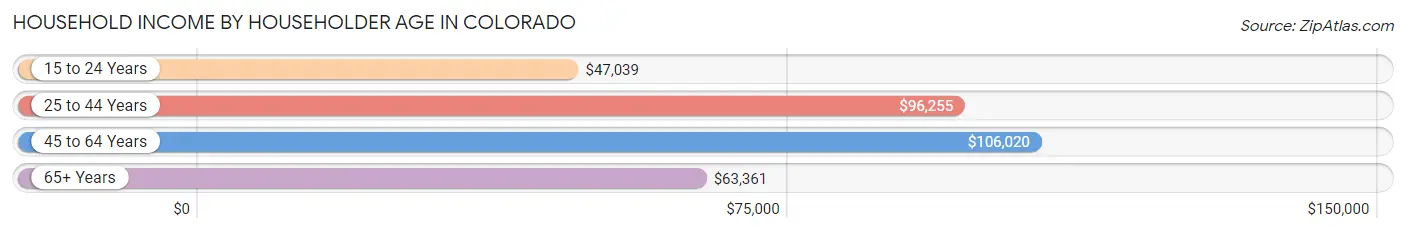
| Income Bracket | # Households | Median Income |
| 15 to 24 Years | 108,820 (4.8%) | $47,039 |
| 25 to 44 Years | 836,798 (36.7%) | $96,255 |
| 45 to 64 Years | 799,044 (35.1%) | $106,020 |
| 65+ Years | 533,382 (23.4%) | $63,361 |
| Total | 2,278,044 (100.0%) | $87,598 |
Poverty in Colorado
Income Below Poverty by Sex and Age in Colorado
With 8.8% poverty level for males and 10.4% for females among the residents of Colorado, 18 to 24 year old males and 18 to 24 year old females are the most vulnerable to poverty, with 44,867 males (17.5%) and 50,175 females (20.9%) in their respective age groups living below the poverty level.
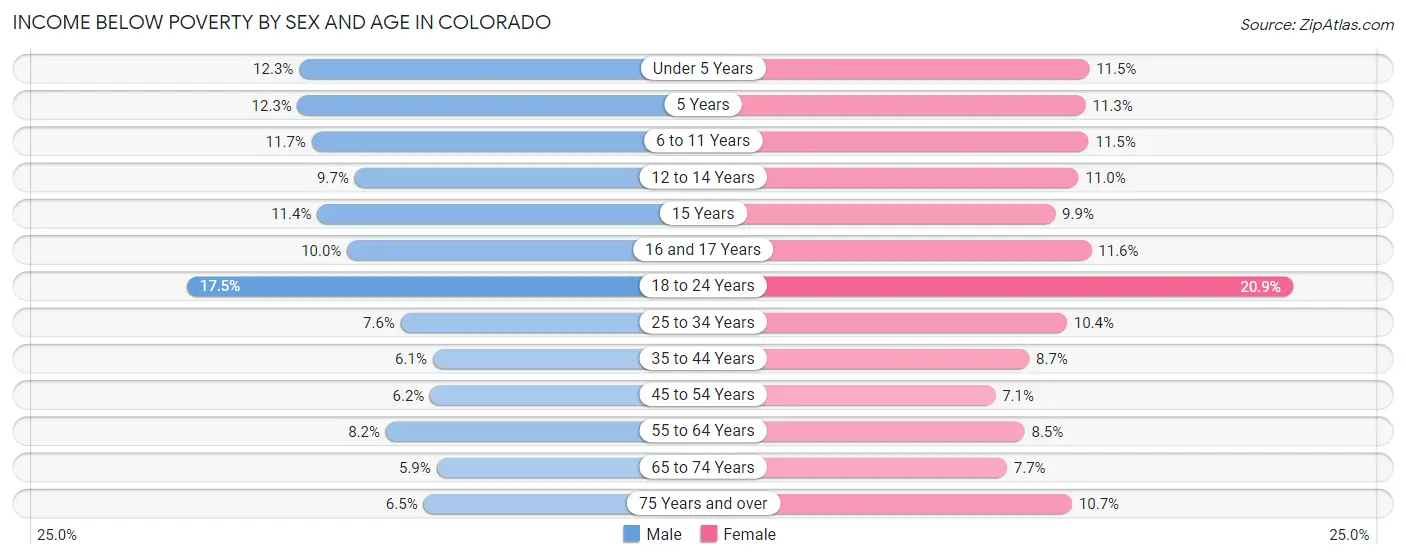
| Age Bracket | Male | Female |
| Under 5 Years | 19,559 (12.3%) | 17,601 (11.5%) |
| 5 Years | 3,992 (12.3%) | 3,819 (11.3%) |
| 6 to 11 Years | 24,749 (11.7%) | 22,866 (11.5%) |
| 12 to 14 Years | 10,817 (9.7%) | 11,481 (11.0%) |
| 15 Years | 4,309 (11.4%) | 3,616 (9.9%) |
| 16 and 17 Years | 7,483 (10.0%) | 8,112 (11.6%) |
| 18 to 24 Years | 44,867 (17.5%) | 50,175 (20.9%) |
| 25 to 34 Years | 34,813 (7.5%) | 44,302 (10.4%) |
| 35 to 44 Years | 25,327 (6.1%) | 33,974 (8.7%) |
| 45 to 54 Years | 22,254 (6.2%) | 24,373 (7.1%) |
| 55 to 64 Years | 28,254 (8.2%) | 29,937 (8.5%) |
| 65 to 74 Years | 14,900 (5.9%) | 20,910 (7.7%) |
| 75 Years and over | 8,647 (6.5%) | 18,968 (10.7%) |
| Total | 249,971 (8.8%) | 290,134 (10.4%) |
Income Above Poverty by Sex and Age in Colorado
According to the poverty statistics in Colorado, males aged 65 to 74 years and females aged 45 to 54 years are the age groups that are most secure financially, with 94.1% of males and 92.9% of females in these age groups living above the poverty line.
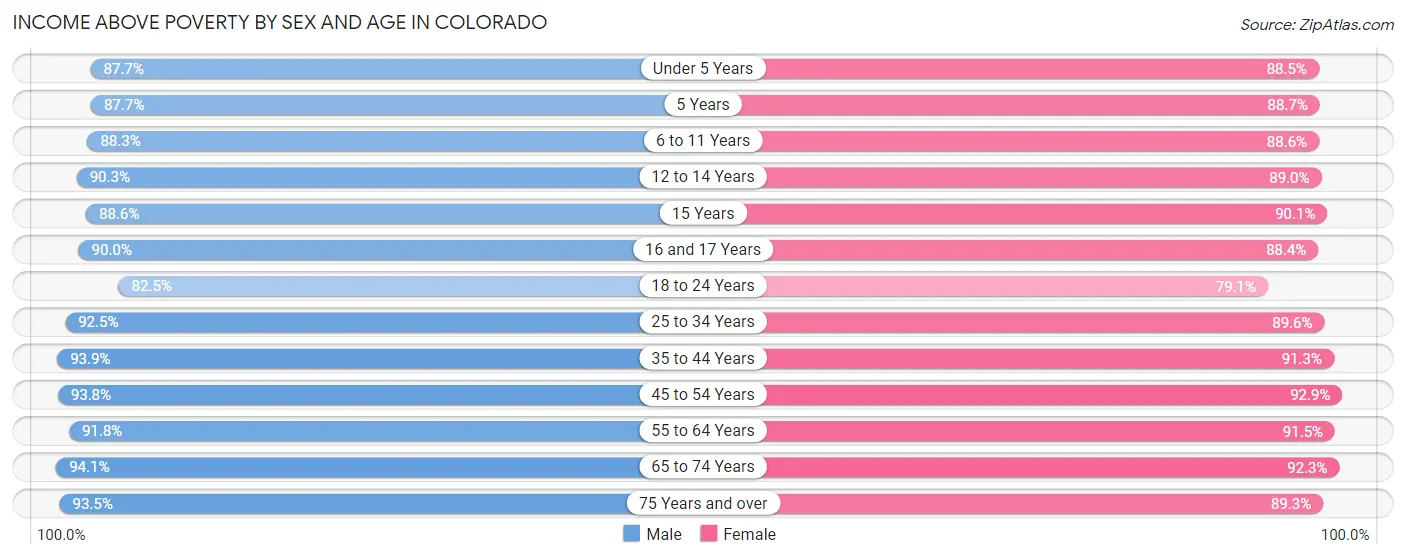
| Age Bracket | Male | Female |
| Under 5 Years | 139,939 (87.7%) | 135,736 (88.5%) |
| 5 Years | 28,375 (87.7%) | 29,960 (88.7%) |
| 6 to 11 Years | 187,205 (88.3%) | 176,863 (88.5%) |
| 12 to 14 Years | 100,981 (90.3%) | 93,031 (89.0%) |
| 15 Years | 33,437 (88.6%) | 32,893 (90.1%) |
| 16 and 17 Years | 67,103 (90.0%) | 61,943 (88.4%) |
| 18 to 24 Years | 211,939 (82.5%) | 189,723 (79.1%) |
| 25 to 34 Years | 426,475 (92.4%) | 380,033 (89.6%) |
| 35 to 44 Years | 392,683 (93.9%) | 357,191 (91.3%) |
| 45 to 54 Years | 337,786 (93.8%) | 318,158 (92.9%) |
| 55 to 64 Years | 314,827 (91.8%) | 323,089 (91.5%) |
| 65 to 74 Years | 238,475 (94.1%) | 252,173 (92.3%) |
| 75 Years and over | 124,489 (93.5%) | 158,677 (89.3%) |
| Total | 2,603,714 (91.2%) | 2,509,470 (89.6%) |
Income Below Poverty Among Married-Couple Families in Colorado
The poverty statistics for married-couple families in Colorado show that 3.2% or 35,891 of the total 1,117,627 families live below the poverty line. Families with 5 or more children have the highest poverty rate of 17.7%, comprising of 1,404 families. On the other hand, families with no children have the lowest poverty rate of 2.3%, which includes 15,013 families.
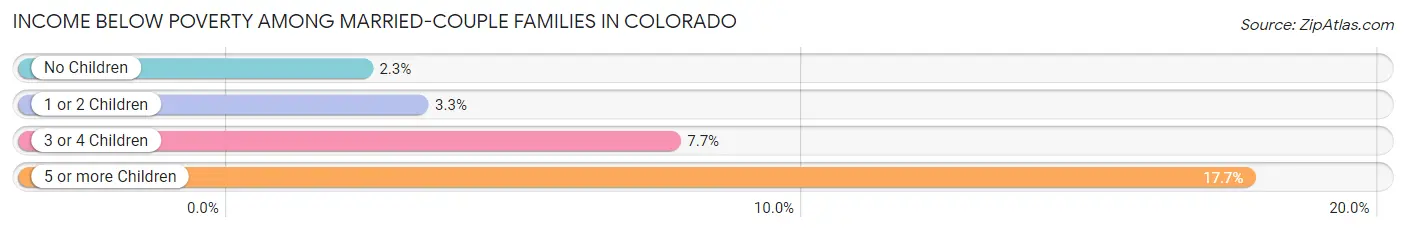
| Children | Above Poverty | Below Poverty |
| No Children | 626,126 (97.7%) | 15,013 (2.3%) |
| 1 or 2 Children | 365,266 (96.7%) | 12,486 (3.3%) |
| 3 or 4 Children | 83,821 (92.3%) | 6,988 (7.7%) |
| 5 or more Children | 6,523 (82.3%) | 1,404 (17.7%) |
| Total | 1,081,736 (96.8%) | 35,891 (3.2%) |
Income Below Poverty Among Single-Parent Households in Colorado
According to the poverty data in Colorado, 9.2% or 9,589 single-father households and 19.2% or 39,510 single-mother households are living below the poverty line. Among single-father households, those with 5 or more children have the highest poverty rate, with 159 households (39.8%) experiencing poverty. Likewise, among single-mother households, those with 5 or more children have the highest poverty rate, with 978 households (57.8%) falling below the poverty line.
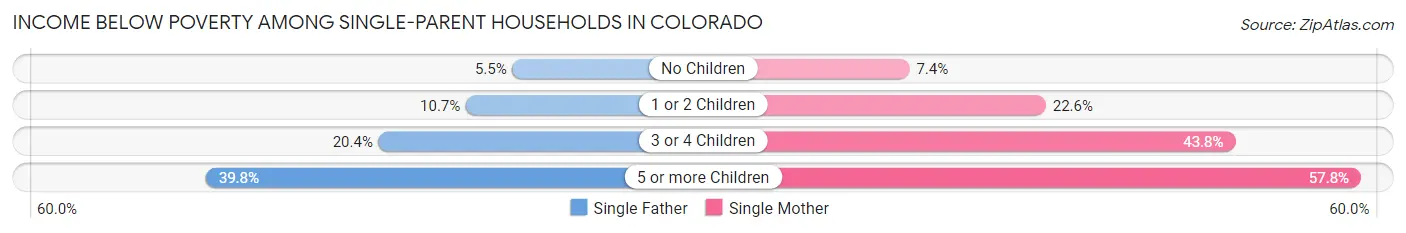
| Children | Single Father | Single Mother |
| No Children | 2,456 (5.5%) | 5,755 (7.3%) |
| 1 or 2 Children | 5,488 (10.7%) | 23,899 (22.6%) |
| 3 or 4 Children | 1,486 (20.4%) | 8,878 (43.8%) |
| 5 or more Children | 159 (39.8%) | 978 (57.8%) |
| Total | 9,589 (9.2%) | 39,510 (19.2%) |
Income Below Poverty Among Married-Couple vs Single-Parent Households in Colorado
The poverty data for Colorado shows that 35,891 of the married-couple family households (3.2%) and 49,099 of the single-parent households (15.8%) are living below the poverty level. Within the married-couple family households, those with 5 or more children have the highest poverty rate, with 1,404 households (17.7%) falling below the poverty line. Among the single-parent households, those with 5 or more children have the highest poverty rate, with 1,137 household (54.3%) living below poverty.
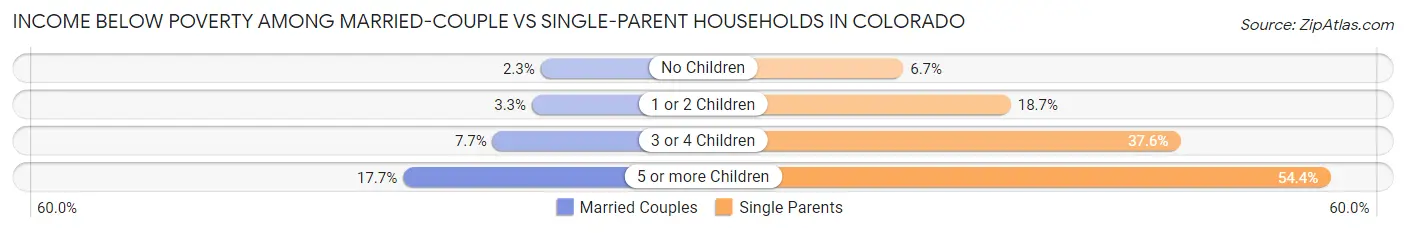
| Children | Married-Couple Families | Single-Parent Households |
| No Children | 15,013 (2.3%) | 8,211 (6.7%) |
| 1 or 2 Children | 12,486 (3.3%) | 29,387 (18.7%) |
| 3 or 4 Children | 6,988 (7.7%) | 10,364 (37.6%) |
| 5 or more Children | 1,404 (17.7%) | 1,137 (54.3%) |
| Total | 35,891 (3.2%) | 49,099 (15.8%) |
Largest Zip Codes by Population in Colorado
The largest zip codes in Colorado by population are 80134 (75,383), 80013 (73,870), 80015 (72,841), 80016 (64,842), and 80219 (64,696).
1.80134
75,383 (1.31%)
2.80013
73,870 (1.28%)
3.80015
72,841 (1.26%)
4.80016
64,842 (1.12%)
5.80219
64,696 (1.12%)
6.80634
62,001 (1.07%)
7.80504
60,527 (1.05%)
8.80022
58,681 (1.02%)
9.80229
55,929 (0.97%)
10.80525
55,315 (0.96%)
11.80631
54,346 (0.94%)
12.80020
53,475 (0.93%)
13.80012
52,741 (0.91%)
14.80011
52,633 (0.91%)
15.80918
49,218 (0.85%)
16.80538
48,929 (0.85%)
17.80233
48,694 (0.84%)
18.80239
46,450 (0.80%)
19.80123
45,388 (0.79%)
20.80526
44,478 (0.77%)
21.80127
44,235 (0.77%)
22.80126
43,691 (0.76%)
23.80537
43,620 (0.76%)
24.80501
43,222 (0.75%)
25.80010
42,892 (0.74%)
26.80401
42,777 (0.74%)
27.80550
41,428 (0.72%)
28.80601
41,062 (0.71%)
29.80602
40,886 (0.71%)
30.80017
40,299 (0.70%)
Largest Cities by Population in Colorado
The largest cities in Colorado by population are Denver (710,800), Colorado Springs (479,612), Aurora (387,349), Fort Collins (168,758), and Lakewood (156,149).
1.Denver
710,800 (12.32%)
479,612 (8.31%)
3.Aurora
387,349 (6.71%)
168,758 (2.92%)
5.Lakewood
156,149 (2.71%)
6.Thornton
141,799 (2.46%)
7.Arvada
123,066 (2.13%)
115,502 (2.00%)
9.Pueblo
111,430 (1.93%)
10.Greeley
107,949 (1.87%)
11.Centennial
107,702 (1.87%)
12.Boulder
106,598 (1.85%)
101,514 (1.76%)
14.Longmont
98,282 (1.70%)
15.Loveland
76,500 (1.33%)
16.Castle Rock
74,065 (1.28%)
17.Broomfield
73,946 (1.28%)
65,918 (1.14%)
63,050 (1.09%)
20.Parker
58,733 (1.02%)
21.Littleton
45,531 (0.79%)
22.Brighton
40,569 (0.70%)
39,150 (0.68%)
24.Northglenn
37,948 (0.66%)
25.Pueblo West
34,337 (0.60%)
26.Dakota Ridge
34,234 (0.59%)
27.Windsor
33,905 (0.59%)
28.Englewood
33,634 (0.58%)
29.Ken Caryl
33,505 (0.58%)
30.Wheat Ridge
32,263 (0.56%)
Largest Counties by Population in Colorado
The largest counties in Colorado by population are El Paso County (730,323), Denver County (710,800), Arapahoe County (654,453), Jefferson County (580,519), and Adams County (520,149).
730,323 (12.66%)
710,800 (12.32%)
654,453 (11.34%)
580,519 (10.06%)
520,149 (9.01%)
360,206 (6.24%)
359,363 (6.23%)
331,466 (5.74%)
328,658 (5.70%)
168,135 (2.91%)
11.Mesa County
156,131 (2.71%)
73,946 (1.28%)
61,683 (1.07%)
55,983 (0.97%)
15.Eagle County
55,650 (0.96%)
49,107 (0.85%)
42,823 (0.74%)
18.Delta County
31,173 (0.54%)
30,955 (0.54%)
29,045 (0.50%)
26,457 (0.46%)
26,070 (0.45%)
23.Routt County
24,944 (0.43%)
24,758 (0.43%)
25.Logan County
21,302 (0.37%)
19,564 (0.34%)
27.Otero County
18,580 (0.32%)
28.Park County
17,597 (0.30%)
17,325 (0.30%)
17,018 (0.29%)
Race in Colorado
The most populous races in Colorado are White / Caucasian (4,393,409 | 76.1%), Hispanic or Latino (1,273,762 | 22.1%), and Two or more Races (609,976 | 10.6%).
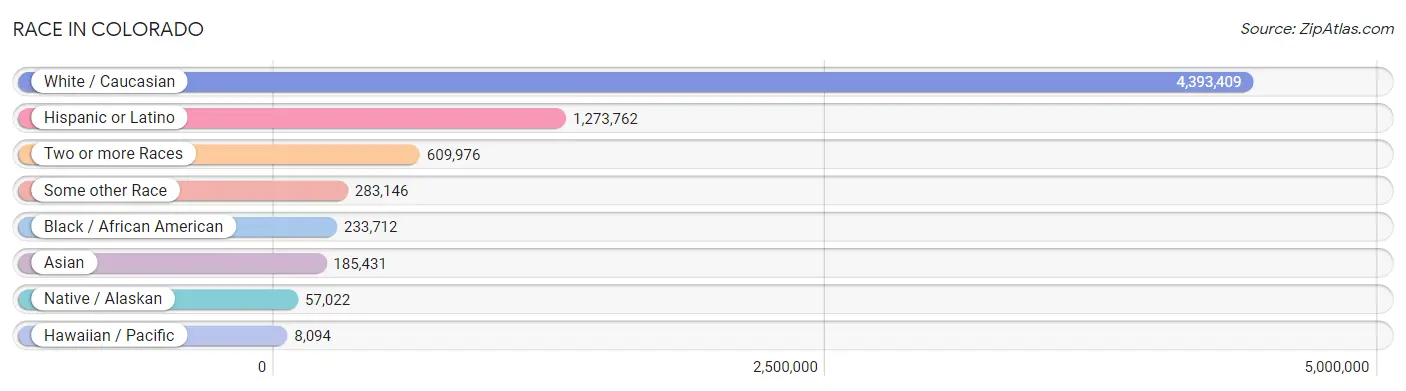
| Race | # Population | % Population |
| Asian | 185,431 | 3.2% |
| Black / African American | 233,712 | 4.1% |
| Hawaiian / Pacific | 8,094 | 0.1% |
| Hispanic or Latino | 1,273,762 | 22.1% |
| Native / Alaskan | 57,022 | 1.0% |
| White / Caucasian | 4,393,409 | 76.1% |
| Two or more Races | 609,976 | 10.6% |
| Some other Race | 283,146 | 4.9% |
| Total | 5,770,790 | 100.0% |
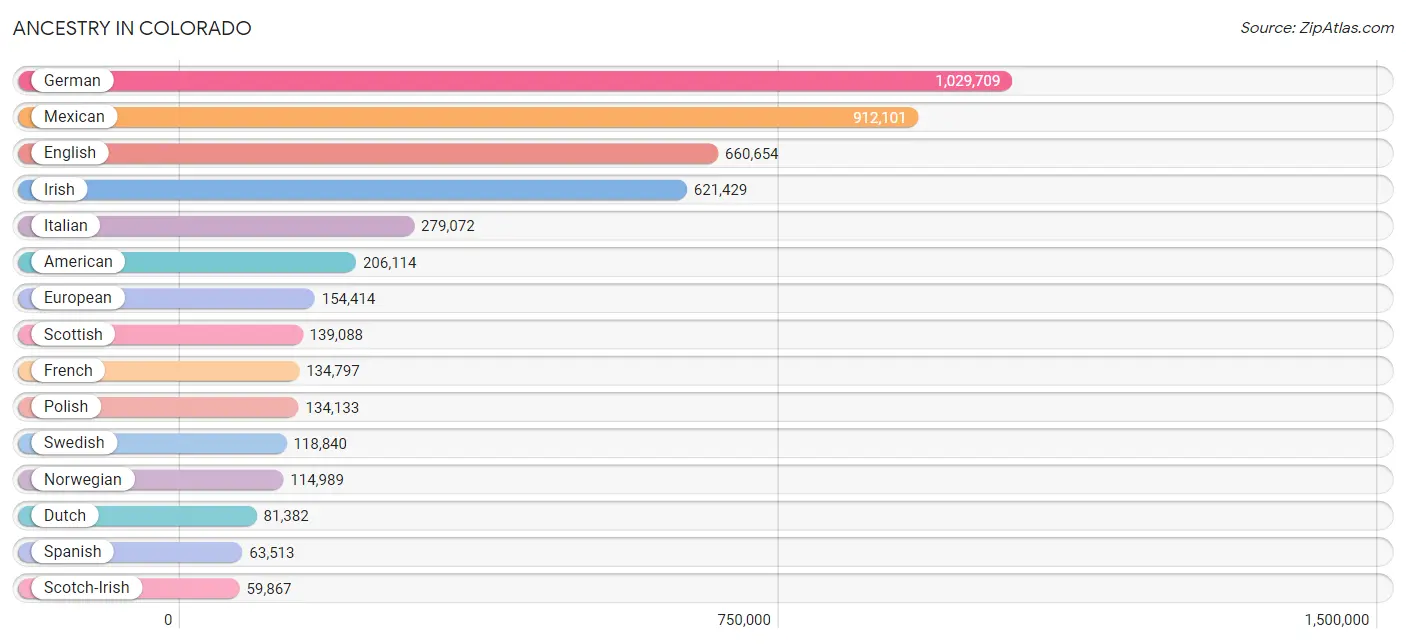
Ancestry in Colorado
The most populous ancestries reported in Colorado are German (1,029,709 | 17.8%), Mexican (912,101 | 15.8%), English (660,654 | 11.5%), Irish (621,429 | 10.8%), and Italian (279,072 | 4.8%), together accounting for 60.7% of all Colorado residents.
| Ancestry | # Population | % Population |
| Afghan | 1,928 | 0.0% |
| African | 16,991 | 0.3% |
| Alaska Native | 320 | 0.0% |
| Alaskan Athabascan | 358 | 0.0% |
| Albanian | 1,063 | 0.0% |
| Aleut | 205 | 0.0% |
| Alsatian | 281 | 0.0% |
| American | 206,114 | 3.6% |
| Apache | 11,141 | 0.2% |
| Arab | 25,914 | 0.4% |
| Arapaho | 593 | 0.0% |
| Argentinean | 5,606 | 0.1% |
| Armenian | 4,708 | 0.1% |
| Assyrian / Chaldean / Syriac | 214 | 0.0% |
| Australian | 2,886 | 0.1% |
| Austrian | 16,311 | 0.3% |
| Bahamian | 27 | 0.0% |
| Bangladeshi | 4,951 | 0.1% |
| Barbadian | 339 | 0.0% |
| Basque | 2,224 | 0.0% |
| Belgian | 6,724 | 0.1% |
| Belizean | 385 | 0.0% |
| Bermudan | 31 | 0.0% |
| Bhutanese | 28,213 | 0.5% |
| Blackfeet | 3,540 | 0.1% |
| Bolivian | 834 | 0.0% |
| Brazilian | 4,941 | 0.1% |
| British | 40,920 | 0.7% |
| British West Indian | 334 | 0.0% |
| Bulgarian | 1,944 | 0.0% |
| Burmese | 36,930 | 0.6% |
| Cajun | 978 | 0.0% |
| Cambodian | 1,071 | 0.0% |
| Canadian | 11,783 | 0.2% |
| Cape Verdean | 473 | 0.0% |
| Carpatho Rusyn | 170 | 0.0% |
| Celtic | 1,770 | 0.0% |
| Central American | 50,560 | 0.9% |
| Central American Indian | 5,074 | 0.1% |
| Cherokee | 23,723 | 0.4% |
| Cheyenne | 1,054 | 0.0% |
| Chickasaw | 1,457 | 0.0% |
| Chilean | 3,873 | 0.1% |
| Chinese | 110 | 0.0% |
| Chippewa | 1,906 | 0.0% |
| Choctaw | 3,939 | 0.1% |
| Colombian | 11,637 | 0.2% |
| Colville | 39 | 0.0% |
| Comanche | 788 | 0.0% |
| Costa Rican | 2,849 | 0.1% |
| Cree | 494 | 0.0% |
| Creek | 1,425 | 0.0% |
| Croatian | 7,399 | 0.1% |
| Crow | 446 | 0.0% |
| Cuban | 13,018 | 0.2% |
| Cypriot | 99 | 0.0% |
| Czech | 34,037 | 0.6% |
| Czechoslovakian | 6,240 | 0.1% |
| Danish | 38,672 | 0.7% |
| Delaware | 287 | 0.0% |
| Dominican | 4,859 | 0.1% |
| Dutch | 81,382 | 1.4% |
| Dutch West Indian | 151 | 0.0% |
| Eastern European | 21,389 | 0.4% |
| Ecuadorian | 3,694 | 0.1% |
| Egyptian | 1,969 | 0.0% |
| English | 660,654 | 11.5% |
| Estonian | 938 | 0.0% |
| Ethiopian | 12,491 | 0.2% |
| European | 154,414 | 2.7% |
| Fijian | 247 | 0.0% |
| Filipino | 2,880 | 0.1% |
| Finnish | 12,458 | 0.2% |
| French | 134,797 | 2.3% |
| French American Indian | 243 | 0.0% |
| French Canadian | 24,429 | 0.4% |
| German | 1,029,709 | 17.8% |
| German Russian | 1,395 | 0.0% |
| Ghanaian | 2,916 | 0.1% |
| Greek | 19,781 | 0.3% |
| Guamanian / Chamorro | 4,054 | 0.1% |
| Guatemalan | 11,760 | 0.2% |
| Guyanese | 244 | 0.0% |
| Haitian | 1,450 | 0.0% |
| Hmong | 22 | 0.0% |
| Honduran | 9,923 | 0.2% |
| Hopi | 608 | 0.0% |
| Houma | 105 | 0.0% |
| Hungarian | 20,331 | 0.4% |
| Icelander | 1,734 | 0.0% |
| Indian (Asian) | 49,363 | 0.9% |
| Indonesian | 2,990 | 0.1% |
| Inupiat | 547 | 0.0% |
| Iranian | 7,015 | 0.1% |
| Iraqi | 1,997 | 0.0% |
| Irish | 621,429 | 10.8% |
| Iroquois | 1,496 | 0.0% |
| Israeli | 1,840 | 0.0% |
| Italian | 279,072 | 4.8% |
| Jamaican | 4,195 | 0.1% |
| Japanese | 3,603 | 0.1% |
| Jordanian | 825 | 0.0% |
| Kenyan | 1,249 | 0.0% |
| Kiowa | 180 | 0.0% |
| Korean | 41,555 | 0.7% |
| Laotian | 3,077 | 0.1% |
| Latvian | 1,898 | 0.0% |
| Lebanese | 7,416 | 0.1% |
| Liberian | 398 | 0.0% |
| Lithuanian | 12,878 | 0.2% |
| Lumbee | 121 | 0.0% |
| Luxembourger | 1,128 | 0.0% |
| Macedonian | 595 | 0.0% |
| Malaysian | 2,720 | 0.1% |
| Maltese | 552 | 0.0% |
| Marshallese | 236 | 0.0% |
| Menominee | 114 | 0.0% |
| Mexican | 912,101 | 15.8% |
| Mexican American Indian | 10,533 | 0.2% |
| Mongolian | 475 | 0.0% |
| Moroccan | 2,052 | 0.0% |
| Native Hawaiian | 8,950 | 0.2% |
| Navajo | 16,229 | 0.3% |
| New Zealander | 794 | 0.0% |
| Nicaraguan | 2,693 | 0.1% |
| Nigerian | 4,338 | 0.1% |
| Northern European | 17,140 | 0.3% |
| Norwegian | 114,989 | 2.0% |
| Okinawan | 292 | 0.0% |
| Osage | 788 | 0.0% |
| Ottawa | 104 | 0.0% |
| Paiute | 219 | 0.0% |
| Pakistani | 5,959 | 0.1% |
| Palestinian | 1,612 | 0.0% |
| Panamanian | 3,386 | 0.1% |
| Paraguayan | 346 | 0.0% |
| Pennsylvania German | 1,335 | 0.0% |
| Peruvian | 10,154 | 0.2% |
| Pima | 172 | 0.0% |
| Polish | 134,133 | 2.3% |
| Portuguese | 15,104 | 0.3% |
| Potawatomi | 955 | 0.0% |
| Pueblo | 3,407 | 0.1% |
| Puerto Rican | 40,355 | 0.7% |
| Puget Sound Salish | 75 | 0.0% |
| Romanian | 6,253 | 0.1% |
| Russian | 54,418 | 0.9% |
| Salvadoran | 19,672 | 0.3% |
| Samoan | 3,019 | 0.1% |
| Scandinavian | 31,794 | 0.5% |
| Scotch-Irish | 59,867 | 1.0% |
| Scottish | 139,088 | 2.4% |
| Seminole | 463 | 0.0% |
| Senegalese | 667 | 0.0% |
| Serbian | 2,918 | 0.1% |
| Shoshone | 476 | 0.0% |
| Sierra Leonean | 199 | 0.0% |
| Sioux | 7,344 | 0.1% |
| Slavic | 3,849 | 0.1% |
| Slovak | 8,275 | 0.1% |
| Slovene | 6,318 | 0.1% |
| Somali | 2,431 | 0.0% |
| South African | 1,659 | 0.0% |
| South American | 43,429 | 0.7% |
| South American Indian | 529 | 0.0% |
| Soviet Union | 19 | 0.0% |
| Spaniard | 52,936 | 0.9% |
| Spanish | 63,513 | 1.1% |
| Spanish American | 4,746 | 0.1% |
| Spanish American Indian | 871 | 0.0% |
| Sri Lankan | 33,770 | 0.6% |
| Subsaharan African | 52,437 | 0.9% |
| Sudanese | 2,147 | 0.0% |
| Swedish | 118,840 | 2.1% |
| Swiss | 21,968 | 0.4% |
| Syrian | 2,117 | 0.0% |
| Taiwanese | 40 | 0.0% |
| Thai | 37,303 | 0.6% |
| Tlingit-Haida | 355 | 0.0% |
| Tohono O'Odham | 226 | 0.0% |
| Tongan | 414 | 0.0% |
| Trinidadian and Tobagonian | 691 | 0.0% |
| Tsimshian | 9 | 0.0% |
| Turkish | 2,792 | 0.1% |
| U.S. Virgin Islander | 153 | 0.0% |
| Ugandan | 578 | 0.0% |
| Ukrainian | 16,029 | 0.3% |
| Uruguayan | 532 | 0.0% |
| Ute | 5,648 | 0.1% |
| Venezuelan | 6,071 | 0.1% |
| Vietnamese | 482 | 0.0% |
| Welsh | 46,630 | 0.8% |
| West Indian | 1,175 | 0.0% |
| Yakama | 154 | 0.0% |
| Yaqui | 568 | 0.0% |
| Yugoslavian | 3,869 | 0.1% |
| Yuman | 127 | 0.0% |
| Yup'ik | 269 | 0.0% | View All 198 Rows |
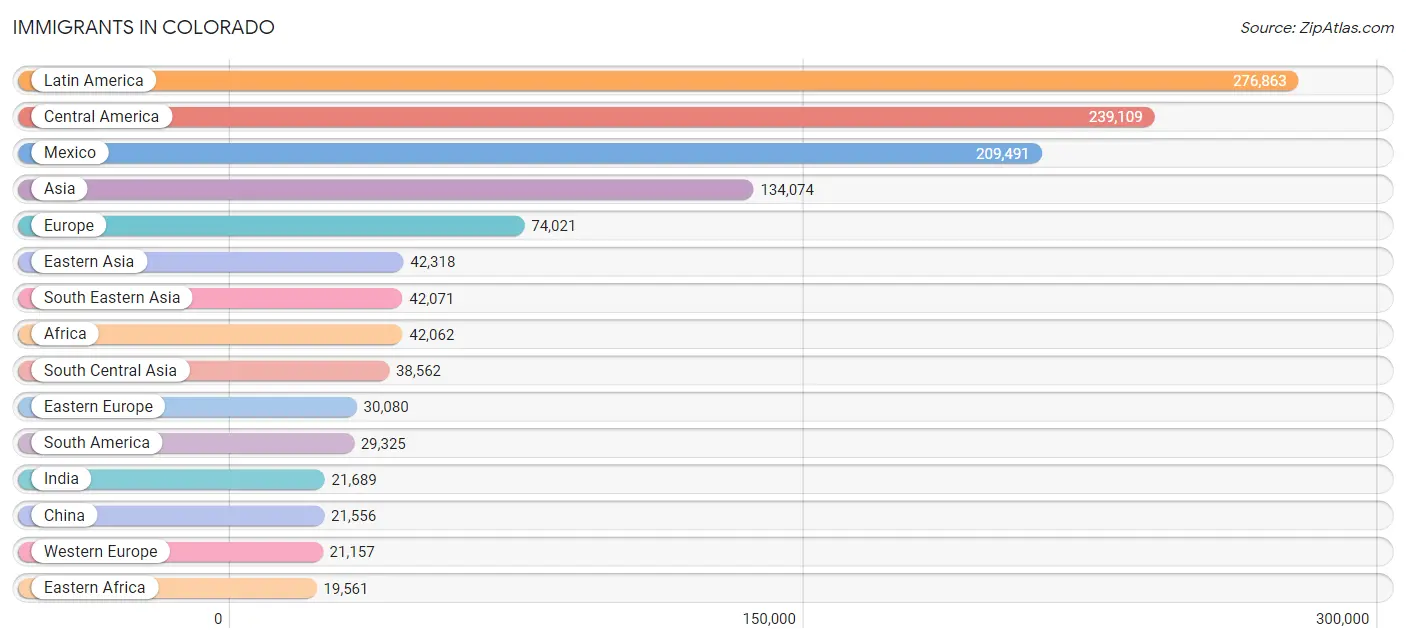
Immigrants in Colorado
The most numerous immigrant groups reported in Colorado came from Latin America (276,863 | 4.8%), Central America (239,109 | 4.1%), Mexico (209,491 | 3.6%), Asia (134,074 | 2.3%), and Europe (74,021 | 1.3%), together accounting for 16.2% of all Colorado residents.
| Immigration Origin | # Population | % Population |
| Afghanistan | 1,730 | 0.0% |
| Africa | 42,062 | 0.7% |
| Albania | 95 | 0.0% |
| Argentina | 3,016 | 0.1% |
| Armenia | 389 | 0.0% |
| Asia | 134,074 | 2.3% |
| Australia | 3,144 | 0.1% |
| Austria | 823 | 0.0% |
| Azores | 17 | 0.0% |
| Bahamas | 89 | 0.0% |
| Bangladesh | 1,091 | 0.0% |
| Barbados | 68 | 0.0% |
| Belarus | 1,349 | 0.0% |
| Belgium | 953 | 0.0% |
| Belize | 284 | 0.0% |
| Bolivia | 383 | 0.0% |
| Bosnia and Herzegovina | 1,268 | 0.0% |
| Brazil | 5,365 | 0.1% |
| Bulgaria | 1,089 | 0.0% |
| Cabo Verde | 50 | 0.0% |
| Cambodia | 1,936 | 0.0% |
| Cameroon | 701 | 0.0% |
| Canada | 15,026 | 0.3% |
| Caribbean | 8,429 | 0.2% |
| Central America | 239,109 | 4.1% |
| Chile | 1,938 | 0.0% |
| China | 21,556 | 0.4% |
| Colombia | 5,971 | 0.1% |
| Congo | 1,045 | 0.0% |
| Costa Rica | 824 | 0.0% |
| Croatia | 423 | 0.0% |
| Cuba | 2,507 | 0.0% |
| Czechoslovakia | 1,849 | 0.0% |
| Denmark | 775 | 0.0% |
| Dominica | 32 | 0.0% |
| Dominican Republic | 2,298 | 0.0% |
| Eastern Africa | 19,561 | 0.3% |
| Eastern Asia | 42,318 | 0.7% |
| Eastern Europe | 30,080 | 0.5% |
| Ecuador | 1,778 | 0.0% |
| Egypt | 1,089 | 0.0% |
| El Salvador | 12,150 | 0.2% |
| England | 6,672 | 0.1% |
| Eritrea | 2,447 | 0.0% |
| Ethiopia | 10,372 | 0.2% |
| Europe | 74,021 | 1.3% |
| Fiji | 63 | 0.0% |
| France | 2,620 | 0.1% |
| Germany | 13,706 | 0.2% |
| Ghana | 3,596 | 0.1% |
| Greece | 572 | 0.0% |
| Grenada | 29 | 0.0% |
| Guatemala | 7,898 | 0.1% |
| Guyana | 368 | 0.0% |
| Haiti | 731 | 0.0% |
| Honduras | 6,142 | 0.1% |
| Hong Kong | 907 | 0.0% |
| Hungary | 1,186 | 0.0% |
| India | 21,689 | 0.4% |
| Indonesia | 2,007 | 0.0% |
| Iran | 3,568 | 0.1% |
| Iraq | 3,281 | 0.1% |
| Ireland | 1,441 | 0.0% |
| Israel | 1,235 | 0.0% |
| Italy | 2,057 | 0.0% |
| Jamaica | 1,940 | 0.0% |
| Japan | 4,075 | 0.1% |
| Jordan | 792 | 0.0% |
| Kazakhstan | 529 | 0.0% |
| Kenya | 2,427 | 0.0% |
| Korea | 15,981 | 0.3% |
| Kuwait | 524 | 0.0% |
| Laos | 2,063 | 0.0% |
| Latin America | 276,863 | 4.8% |
| Latvia | 514 | 0.0% |
| Lebanon | 741 | 0.0% |
| Liberia | 657 | 0.0% |
| Lithuania | 621 | 0.0% |
| Malaysia | 907 | 0.0% |
| Mexico | 209,491 | 3.6% |
| Micronesia | 445 | 0.0% |
| Middle Africa | 3,224 | 0.1% |
| Moldova | 782 | 0.0% |
| Morocco | 1,648 | 0.0% |
| Nepal | 5,214 | 0.1% |
| Netherlands | 1,640 | 0.0% |
| Nicaragua | 1,193 | 0.0% |
| Nigeria | 1,970 | 0.0% |
| North Macedonia | 149 | 0.0% |
| Northern Africa | 5,883 | 0.1% |
| Northern Europe | 17,868 | 0.3% |
| Norway | 487 | 0.0% |
| Oceania | 5,514 | 0.1% |
| Pakistan | 1,794 | 0.0% |
| Panama | 1,009 | 0.0% |
| Peru | 4,810 | 0.1% |
| Philippines | 12,342 | 0.2% |
| Poland | 4,772 | 0.1% |
| Portugal | 302 | 0.0% |
| Romania | 1,615 | 0.0% |
| Russia | 7,860 | 0.1% |
| Saudi Arabia | 648 | 0.0% |
| Scotland | 1,073 | 0.0% |
| Senegal | 651 | 0.0% |
| Serbia | 256 | 0.0% |
| Sierra Leone | 207 | 0.0% |
| Singapore | 563 | 0.0% |
| Somalia | 1,243 | 0.0% |
| South Africa | 2,472 | 0.0% |
| South America | 29,325 | 0.5% |
| South Central Asia | 38,562 | 0.7% |
| South Eastern Asia | 42,071 | 0.7% |
| Southern Europe | 4,746 | 0.1% |
| Spain | 1,788 | 0.0% |
| Sri Lanka | 404 | 0.0% |
| St. Vincent and the Grenadines | 62 | 0.0% |
| Sudan | 2,099 | 0.0% |
| Sweden | 1,074 | 0.0% |
| Switzerland | 1,359 | 0.0% |
| Syria | 659 | 0.0% |
| Taiwan | 2,651 | 0.1% |
| Thailand | 3,563 | 0.1% |
| Trinidad and Tobago | 422 | 0.0% |
| Turkey | 1,299 | 0.0% |
| Uganda | 1,172 | 0.0% |
| Ukraine | 4,267 | 0.1% |
| Uruguay | 379 | 0.0% |
| Uzbekistan | 613 | 0.0% |
| Venezuela | 4,829 | 0.1% |
| Vietnam | 16,616 | 0.3% |
| West Indies | 44 | 0.0% |
| Western Africa | 9,901 | 0.2% |
| Western Asia | 10,882 | 0.2% |
| Western Europe | 21,157 | 0.4% |
| Yemen | 69 | 0.0% |
| Zaire | 968 | 0.0% |
| Zimbabwe | 302 | 0.0% | View All 137 Rows |
Sex and Age in Colorado
Sex and Age in Colorado
The most populous age groups in Colorado are 30 to 34 Years (238,665 | 8.2%) for men and 30 to 34 Years (215,172 | 7.6%) for women.
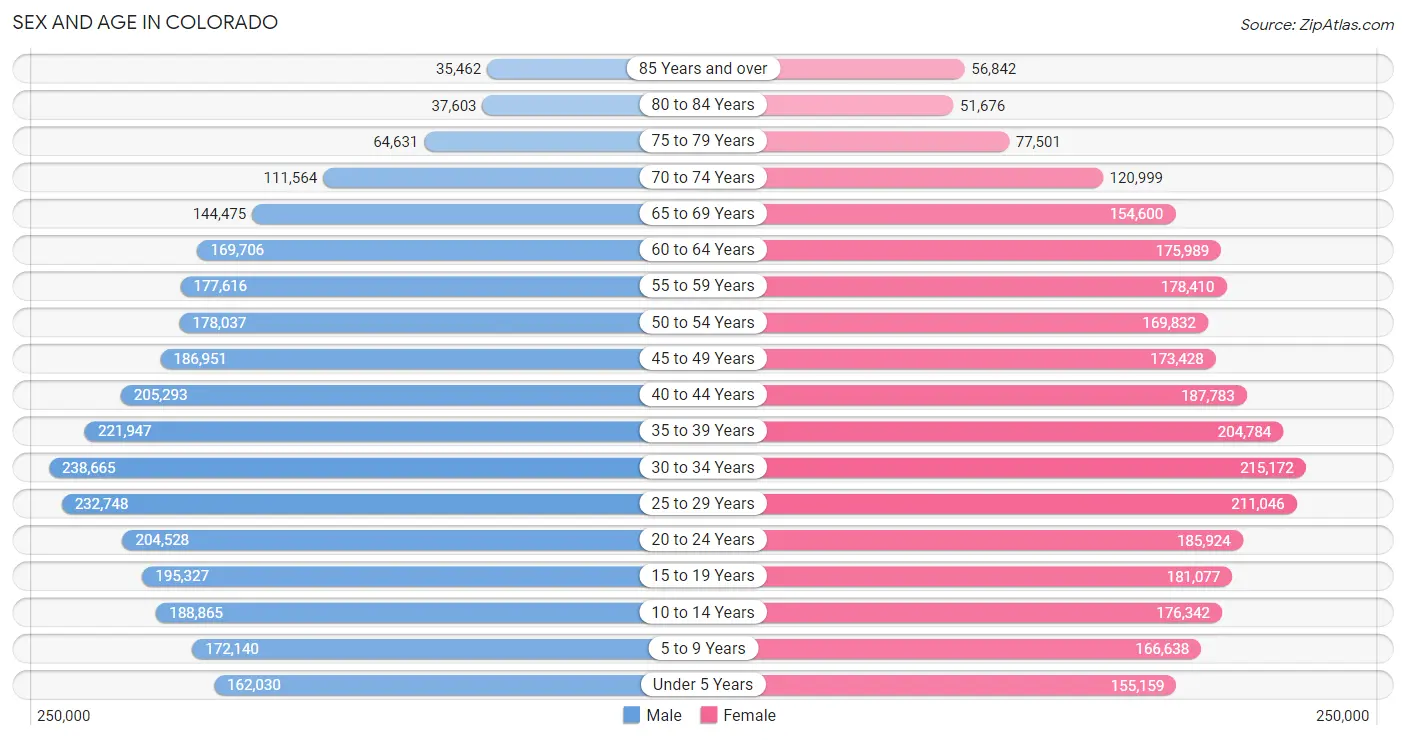
| Age Bracket | Male | Female |
| Under 5 Years | 162,030 (5.5%) | 155,159 (5.5%) |
| 5 to 9 Years | 172,140 (5.9%) | 166,638 (5.9%) |
| 10 to 14 Years | 188,865 (6.5%) | 176,342 (6.2%) |
| 15 to 19 Years | 195,327 (6.7%) | 181,077 (6.4%) |
| 20 to 24 Years | 204,528 (7.0%) | 185,924 (6.5%) |
| 25 to 29 Years | 232,748 (8.0%) | 211,046 (7.4%) |
| 30 to 34 Years | 238,665 (8.2%) | 215,172 (7.6%) |
| 35 to 39 Years | 221,947 (7.6%) | 204,784 (7.2%) |
| 40 to 44 Years | 205,293 (7.0%) | 187,783 (6.6%) |
| 45 to 49 Years | 186,951 (6.4%) | 173,428 (6.1%) |
| 50 to 54 Years | 178,037 (6.1%) | 169,832 (6.0%) |
| 55 to 59 Years | 177,616 (6.1%) | 178,410 (6.3%) |
| 60 to 64 Years | 169,706 (5.8%) | 175,989 (6.2%) |
| 65 to 69 Years | 144,475 (4.9%) | 154,600 (5.4%) |
| 70 to 74 Years | 111,564 (3.8%) | 120,999 (4.3%) |
| 75 to 79 Years | 64,631 (2.2%) | 77,501 (2.7%) |
| 80 to 84 Years | 37,603 (1.3%) | 51,676 (1.8%) |
| 85 Years and over | 35,462 (1.2%) | 56,842 (2.0%) |
| Total | 2,927,588 (100.0%) | 2,843,202 (100.0%) |
Families and Households in Colorado
Median Family Size in Colorado
The median family size in Colorado is 3.07 persons per family, with married-couple families (1,117,627 | 78.3%) accounting for the largest median family size of 3.09 persons per family. On the other hand, single male/father families (104,109 | 7.3%) represent the smallest median family size with 2.76 persons per family.
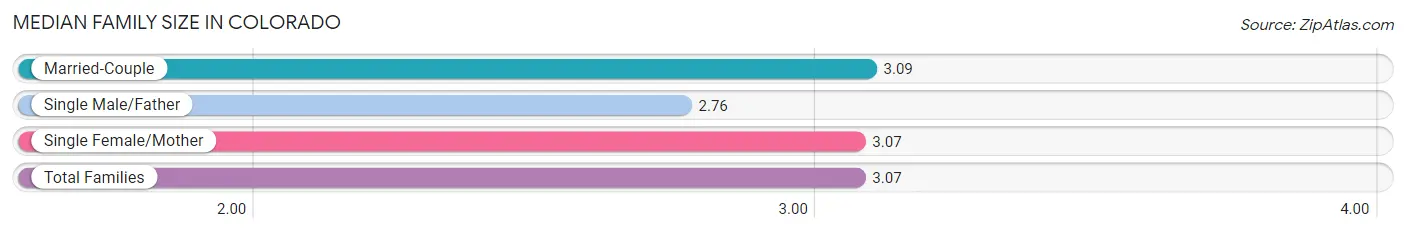
| Family Type | # Families | Family Size |
| Married-Couple | 1,117,627 (78.3%) | 3.09 |
| Single Male/Father | 104,109 (7.3%) | 2.76 |
| Single Female/Mother | 206,077 (14.4%) | 3.07 |
| Total Families | 1,427,813 (100.0%) | 3.07 |
Median Household Size in Colorado
The median household size in Colorado is 2.48 persons per household, with single female/mother households (206,077 | 9.0%) accounting for the largest median household size of 3.32 persons per household. non-family households (850,231 | 37.3%) represent the smallest median household size with 1.35 persons per household.
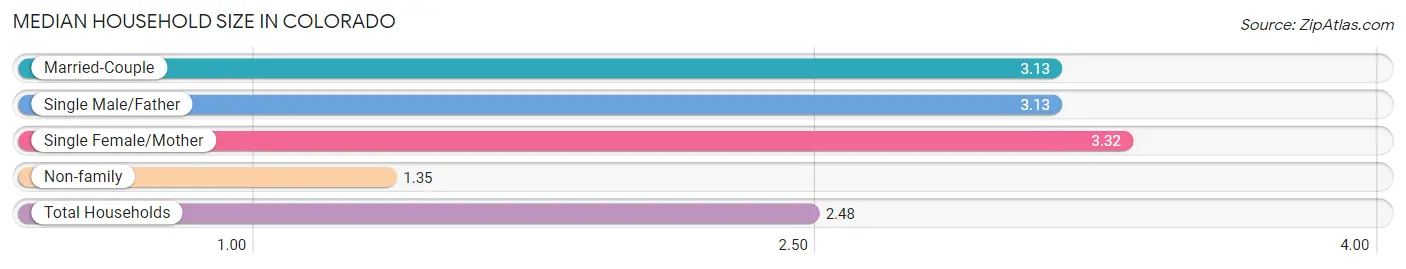
| Household Type | # Households | Household Size |
| Married-Couple | 1,117,627 (49.1%) | 3.13 |
| Single Male/Father | 104,109 (4.6%) | 3.13 |
| Single Female/Mother | 206,077 (9.0%) | 3.32 |
| Non-family | 850,231 (37.3%) | 1.35 |
| Total Households | 2,278,044 (100.0%) | 2.48 |
Household Size by Marriage Status in Colorado
Out of a total of 2,278,044 households in Colorado, 1,427,813 (62.7%) are family households, while 850,231 (37.3%) are nonfamily households. The most numerous type of family households are 2-person households, comprising 641,540, and the most common type of nonfamily households are 1-person households, comprising 635,047.
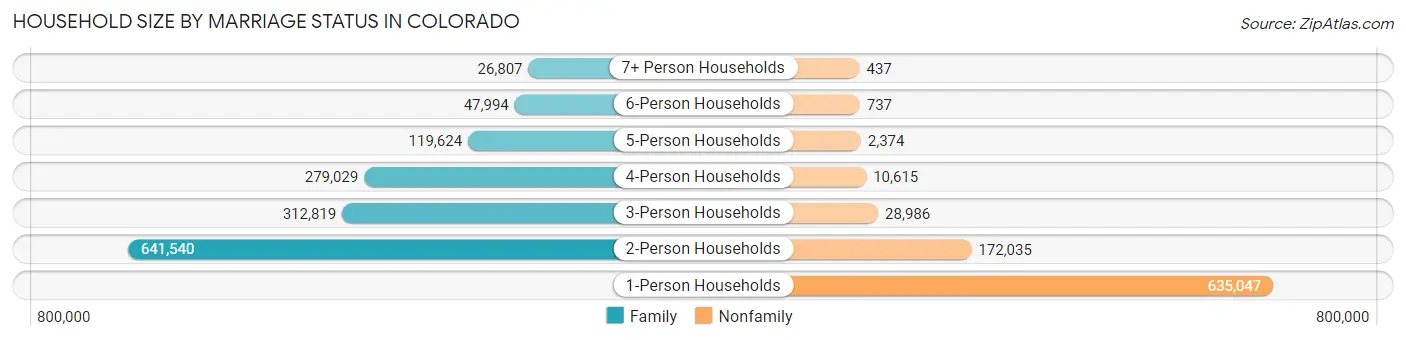
| Household Size | Family Households | Nonfamily Households |
| 1-Person Households | - | 635,047 (27.9%) |
| 2-Person Households | 641,540 (28.2%) | 172,035 (7.5%) |
| 3-Person Households | 312,819 (13.7%) | 28,986 (1.3%) |
| 4-Person Households | 279,029 (12.2%) | 10,615 (0.5%) |
| 5-Person Households | 119,624 (5.2%) | 2,374 (0.1%) |
| 6-Person Households | 47,994 (2.1%) | 737 (0.0%) |
| 7+ Person Households | 26,807 (1.2%) | 437 (0.0%) |
| Total | 1,427,813 (62.7%) | 850,231 (37.3%) |
Female Fertility in Colorado
Fertility by Age in Colorado
Average fertility rate in Colorado is 49.0 births per 1,000 women. Women in the age bracket of 20 to 34 years have the highest fertility rate with 75.0 births per 1,000 women. Women in the age bracket of 20 to 34 years acount for 67.8% of all women with births.
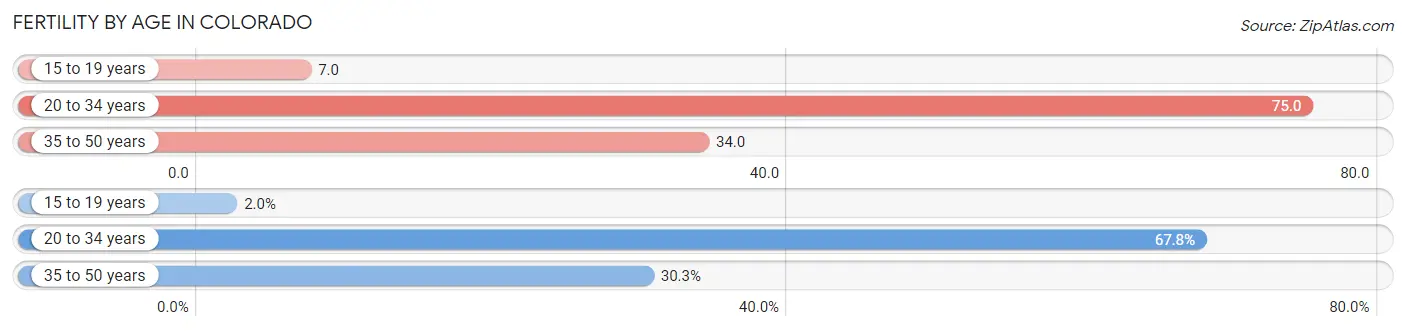
| Age Bracket | Women with Births | Births / 1,000 Women |
| 15 to 19 years | 1,346 (2.0%) | 7.0 |
| 20 to 34 years | 46,186 (67.8%) | 75.0 |
| 35 to 50 years | 20,613 (30.2%) | 34.0 |
| Total | 68,145 (100.0%) | 49.0 |
Fertility by Age by Marriage Status in Colorado
77.8% of women with births (68,145) in Colorado are married. The highest percentage of unmarried women with births falls into 15 to 19 years age bracket with 79.5% of them unmarried at the time of birth, while the lowest percentage of unmarried women with births belong to 35 to 50 years age bracket with 15.3% of them unmarried.
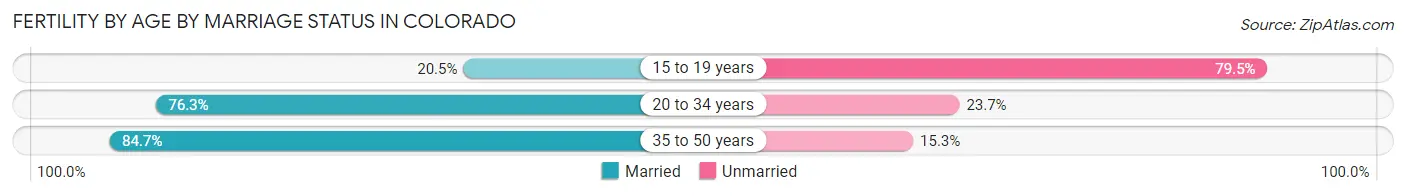
| Age Bracket | Married | Unmarried |
| 15 to 19 years | 276 (20.5%) | 1,070 (79.5%) |
| 20 to 34 years | 35,240 (76.3%) | 10,946 (23.7%) |
| 35 to 50 years | 17,459 (84.7%) | 3,154 (15.3%) |
| Total | 53,017 (77.8%) | 15,128 (22.2%) |
Fertility by Education in Colorado
Average fertility rate in Colorado is 49.0 births per 1,000 women. Women with the education attainment of graduate degree have the highest fertility rate of 65.0 births per 1,000 women, while women with the education attainment of less than high school have the lowest fertility at 29.0 births per 1,000 women. Women with the education attainment of college or associate's degree represent 28.1% of all women with births.
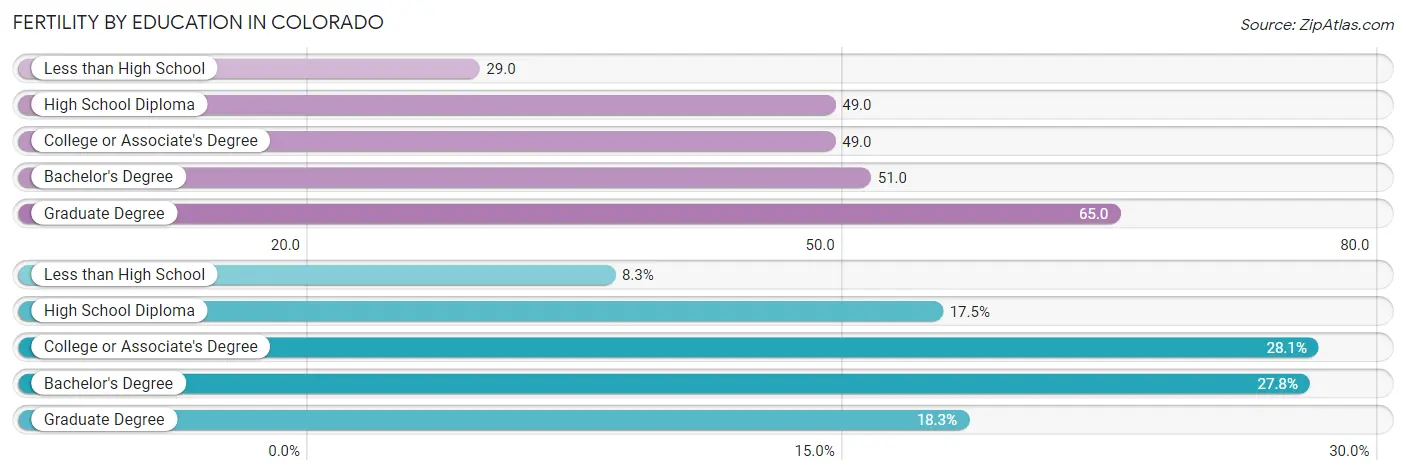
| Educational Attainment | Women with Births | Births / 1,000 Women |
| Less than High School | 5,662 (8.3%) | 29.0 |
| High School Diploma | 11,942 (17.5%) | 49.0 |
| College or Associate's Degree | 19,137 (28.1%) | 49.0 |
| Bachelor's Degree | 18,967 (27.8%) | 51.0 |
| Graduate Degree | 12,437 (18.2%) | 65.0 |
| Total | 68,145 (100.0%) | 49.0 |
Fertility by Education by Marriage Status in Colorado
22.2% of women with births in Colorado are unmarried. Women with the educational attainment of bachelor's degree are most likely to be married with 91.0% of them married at childbirth, while women with the educational attainment of high school diploma are least likely to be married with 39.5% of them unmarried at childbirth.
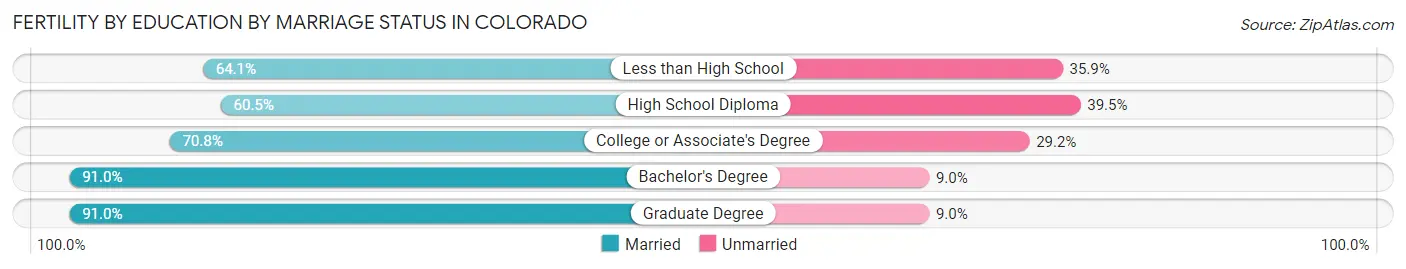
| Educational Attainment | Married | Unmarried |
| Less than High School | 3,629 (64.1%) | 2,033 (35.9%) |
| High School Diploma | 7,225 (60.5%) | 4,717 (39.5%) |
| College or Associate's Degree | 13,549 (70.8%) | 5,588 (29.2%) |
| Bachelor's Degree | 17,260 (91.0%) | 1,707 (9.0%) |
| Graduate Degree | 11,318 (91.0%) | 1,119 (9.0%) |
| Total | 53,017 (77.8%) | 15,128 (22.2%) |
Employment Characteristics in Colorado
Employment by Class of Employer in Colorado
Among the 3,006,848 employed individuals in Colorado, private company employees (1,974,018 | 65.6%), not-for-profit organizations (237,274 | 7.9%), and local government employees (216,044 | 7.2%) make up the most common classes of employment.
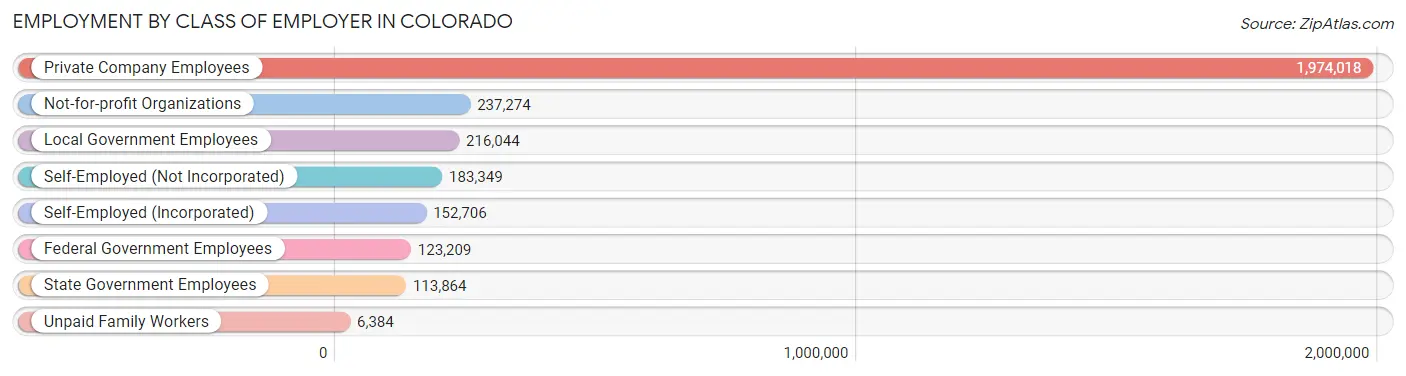
| Employer Class | # Employees | % Employees |
| Private Company Employees | 1,974,018 | 65.6% |
| Self-Employed (Incorporated) | 152,706 | 5.1% |
| Self-Employed (Not Incorporated) | 183,349 | 6.1% |
| Not-for-profit Organizations | 237,274 | 7.9% |
| Local Government Employees | 216,044 | 7.2% |
| State Government Employees | 113,864 | 3.8% |
| Federal Government Employees | 123,209 | 4.1% |
| Unpaid Family Workers | 6,384 | 0.2% |
| Total | 3,006,848 | 100.0% |
Employment Status by Age in Colorado
According to the labor force statistics for Colorado, out of the total population over 16 years of age (4,675,060), 68.6% or 3,207,091 individuals are in the labor force, with 4.5% or 144,319 of them unemployed. The age group with the highest labor force participation rate is 25 to 29 years, with 87.2% or 386,988 individuals in the labor force. Within the labor force, the 16 to 19 years age range has the highest percentage of unemployed individuals, with 14.7% or 20,588 of them being unemployed.
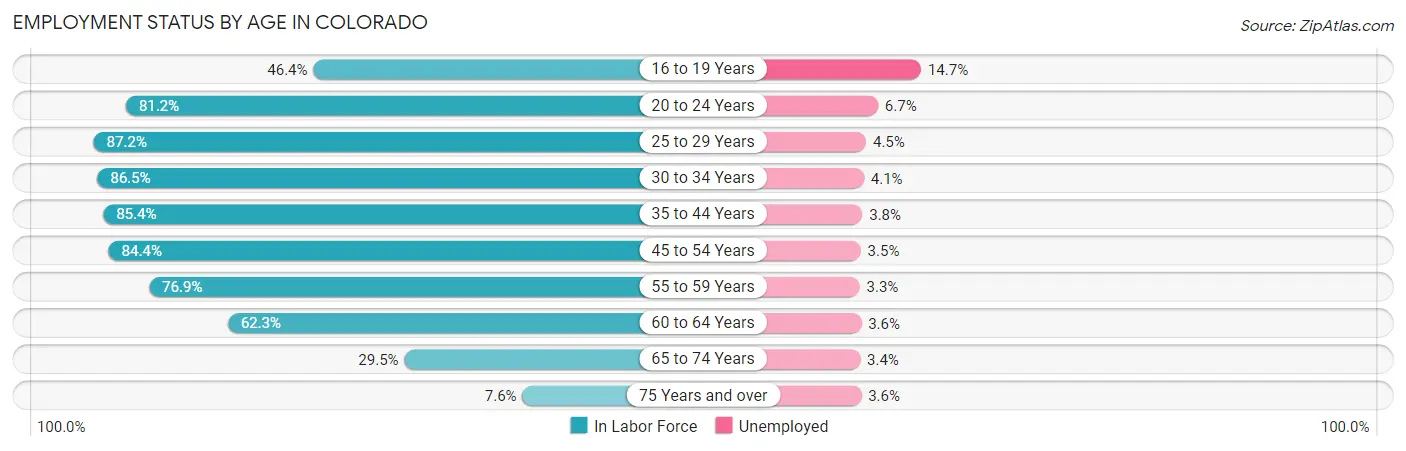
| Age Bracket | In Labor Force | Unemployed |
| 16 to 19 Years | 140,057 (46.4%) | 20,588 (14.7%) |
| 20 to 24 Years | 317,047 (81.2%) | 21,242 (6.7%) |
| 25 to 29 Years | 386,988 (87.2%) | 17,414 (4.5%) |
| 30 to 34 Years | 392,569 (86.5%) | 16,095 (4.1%) |
| 35 to 44 Years | 700,115 (85.4%) | 26,604 (3.8%) |
| 45 to 54 Years | 597,761 (84.4%) | 20,922 (3.5%) |
| 55 to 59 Years | 273,784 (76.9%) | 9,035 (3.3%) |
| 60 to 64 Years | 215,368 (62.3%) | 7,753 (3.6%) |
| 65 to 74 Years | 156,833 (29.5%) | 5,332 (3.4%) |
| 75 Years and over | 24,602 (7.6%) | 886 (3.6%) |
| Total | 3,207,091 (68.6%) | 144,319 (4.5%) |
Employment Status by Educational Attainment in Colorado
According to labor force statistics for Colorado, 82.1% of individuals (2,567,601) out of the total population between 25 and 64 years of age (3,127,407) are in the labor force, with 3.8% or 97,569 of them being unemployed. The group with the highest labor force participation rate are those with the educational attainment of bachelor's degree or higher, with 88.2% or 1,231,135 individuals in the labor force. Within the labor force, individuals with less than high school education have the highest percentage of unemployment, with 6.7% or 10,564 of them being unemployed.
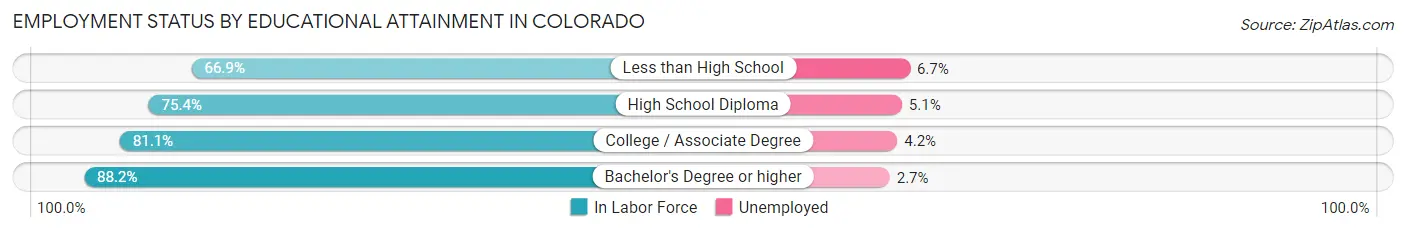
| Educational Attainment | In Labor Force | Unemployed |
| Less than High School | 157,669 (66.9%) | 15,790 (6.7%) |
| High School Diploma | 465,295 (75.4%) | 31,472 (5.1%) |
| College / Associate Degree | 712,692 (81.1%) | 36,909 (4.2%) |
| Bachelor's Degree or higher | 1,231,135 (88.2%) | 37,688 (2.7%) |
| Total | 2,567,601 (82.1%) | 118,841 (3.8%) |
Employment Occupations by Sex in Colorado
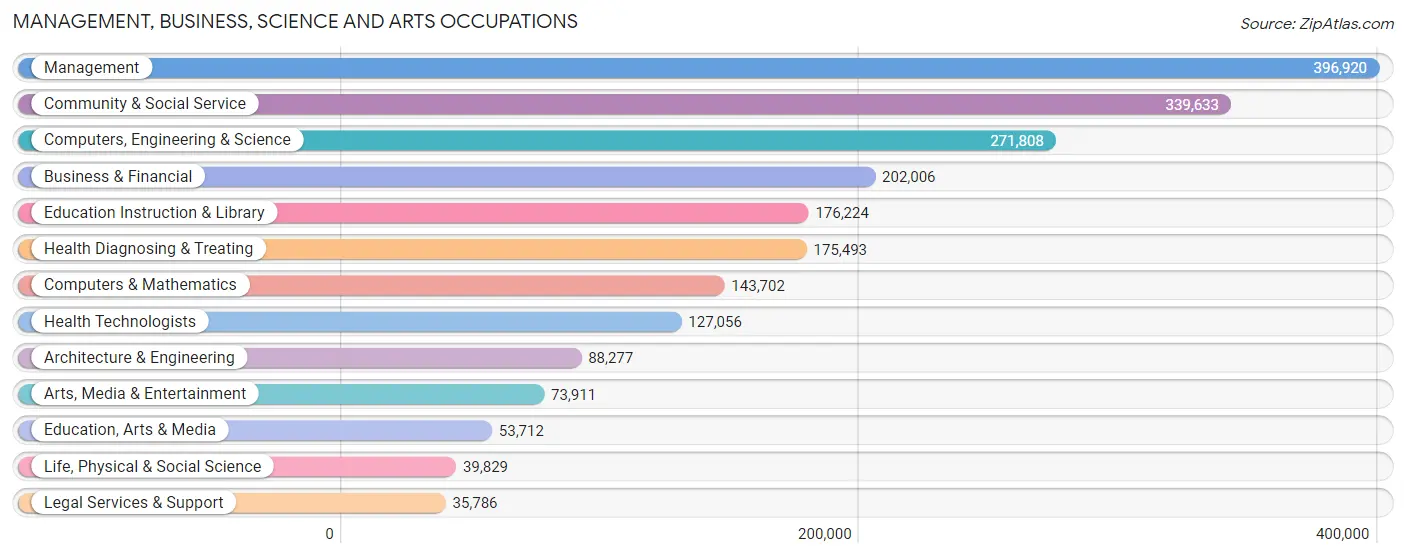
Management, Business, Science and Arts Occupations
The most common Management, Business, Science and Arts occupations in Colorado are Management (396,920 | 13.1%), Community & Social Service (339,633 | 11.2%), Computers, Engineering & Science (271,808 | 9.0%), Business & Financial (202,006 | 6.7%), and Education Instruction & Library (176,224 | 5.8%).
Management, Business, Science and Arts Occupations by Sex
Within the Management, Business, Science and Arts occupations in Colorado, the most male-oriented occupations are Architecture & Engineering (81.8%), Computers & Mathematics (76.8%), and Computers, Engineering & Science (74.9%), while the most female-oriented occupations are Health Diagnosing & Treating (73.6%), Health Technologists (73.6%), and Education Instruction & Library (71.4%).
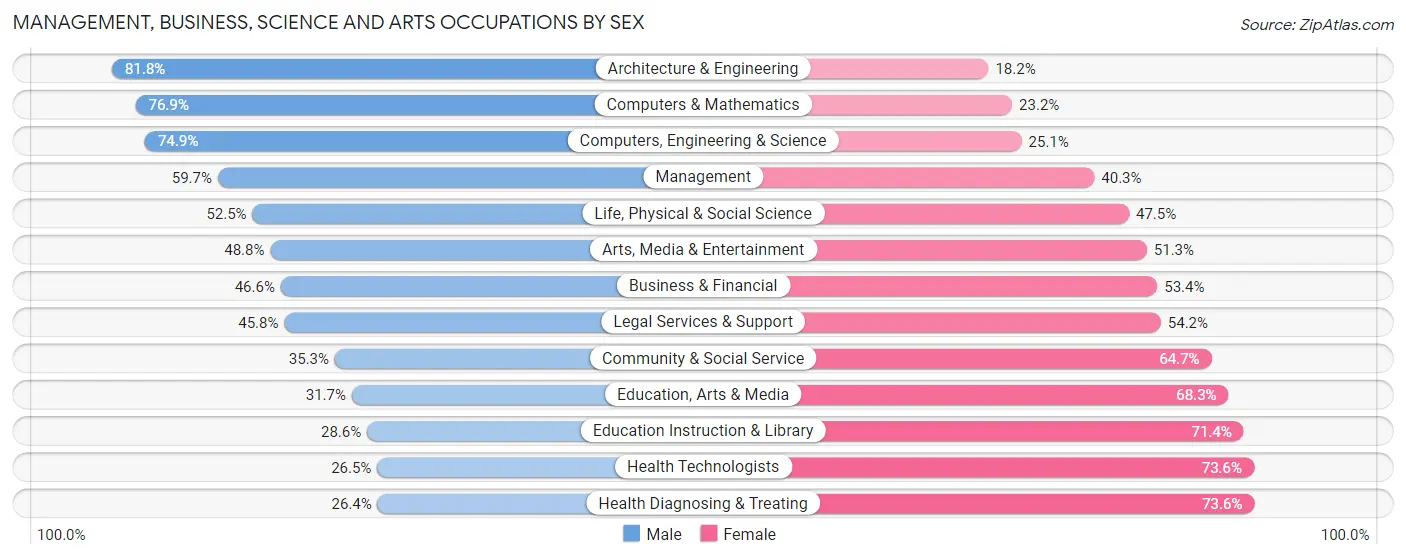
| Occupation | Male | Female |
| Management | 236,970 (59.7%) | 159,950 (40.3%) |
| Business & Financial | 94,083 (46.6%) | 107,923 (53.4%) |
| Computers, Engineering & Science | 203,522 (74.9%) | 68,286 (25.1%) |
| Computers & Mathematics | 110,430 (76.8%) | 33,272 (23.2%) |
| Architecture & Engineering | 72,192 (81.8%) | 16,085 (18.2%) |
| Life, Physical & Social Science | 20,900 (52.5%) | 18,929 (47.5%) |
| Community & Social Service | 119,807 (35.3%) | 219,826 (64.7%) |
| Education, Arts & Media | 17,047 (31.7%) | 36,665 (68.3%) |
| Legal Services & Support | 16,402 (45.8%) | 19,384 (54.2%) |
| Education Instruction & Library | 50,325 (28.6%) | 125,899 (71.4%) |
| Arts, Media & Entertainment | 36,033 (48.7%) | 37,878 (51.2%) |
| Health Diagnosing & Treating | 46,265 (26.4%) | 129,228 (73.6%) |
| Health Technologists | 33,607 (26.5%) | 93,449 (73.6%) |
| Total (Category) | 700,647 (50.6%) | 685,213 (49.4%) |
| Total (Overall) | 1,631,605 (54.0%) | 1,390,137 (46.0%) |
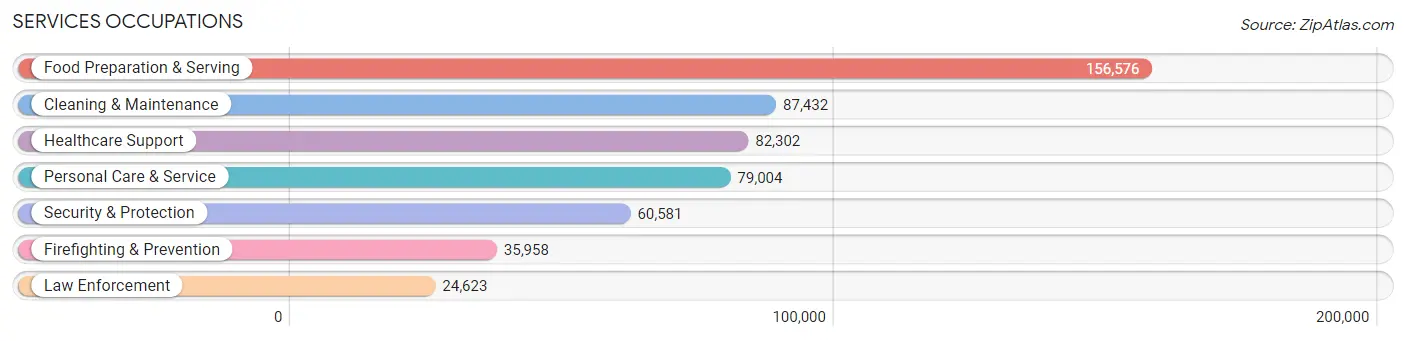
Services Occupations
The most common Services occupations in Colorado are Food Preparation & Serving (156,576 | 5.2%), Cleaning & Maintenance (87,432 | 2.9%), Healthcare Support (82,302 | 2.7%), Personal Care & Service (79,004 | 2.6%), and Security & Protection (60,581 | 2.0%).
Services Occupations by Sex
Within the Services occupations in Colorado, the most male-oriented occupations are Law Enforcement (77.4%), Security & Protection (74.6%), and Firefighting & Prevention (72.7%), while the most female-oriented occupations are Healthcare Support (84.5%), Personal Care & Service (76.2%), and Food Preparation & Serving (52.5%).
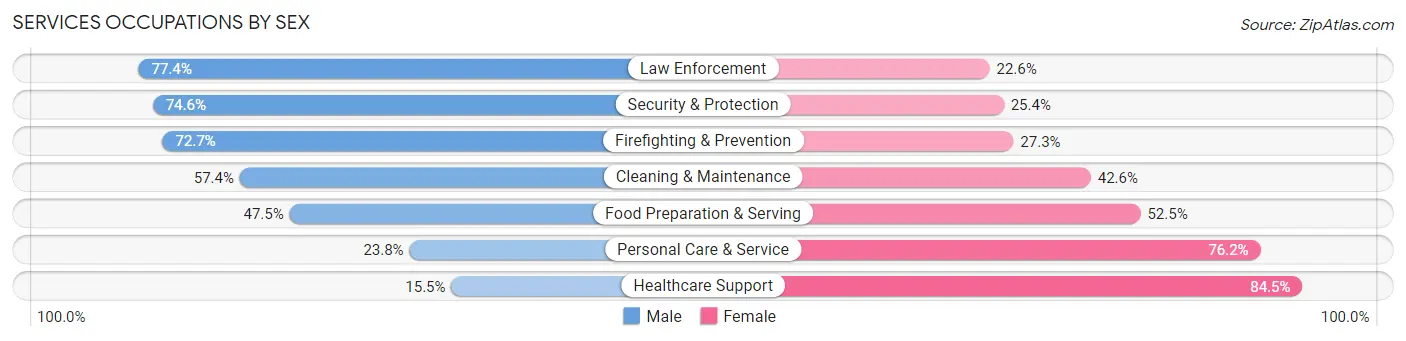
| Occupation | Male | Female |
| Healthcare Support | 12,751 (15.5%) | 69,551 (84.5%) |
| Security & Protection | 45,208 (74.6%) | 15,373 (25.4%) |
| Firefighting & Prevention | 26,142 (72.7%) | 9,816 (27.3%) |
| Law Enforcement | 19,066 (77.4%) | 5,557 (22.6%) |
| Food Preparation & Serving | 74,431 (47.5%) | 82,145 (52.5%) |
| Cleaning & Maintenance | 50,165 (57.4%) | 37,267 (42.6%) |
| Personal Care & Service | 18,792 (23.8%) | 60,212 (76.2%) |
| Total (Category) | 201,347 (43.2%) | 264,548 (56.8%) |
| Total (Overall) | 1,631,605 (54.0%) | 1,390,137 (46.0%) |
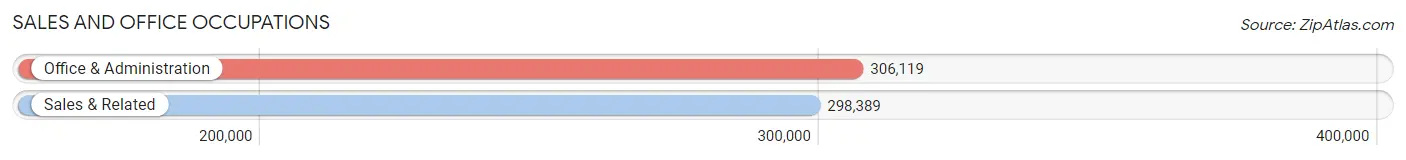
Sales and Office Occupations
The most common Sales and Office occupations in Colorado are Office & Administration (306,119 | 10.1%), and Sales & Related (298,389 | 9.9%).
Sales and Office Occupations by Sex
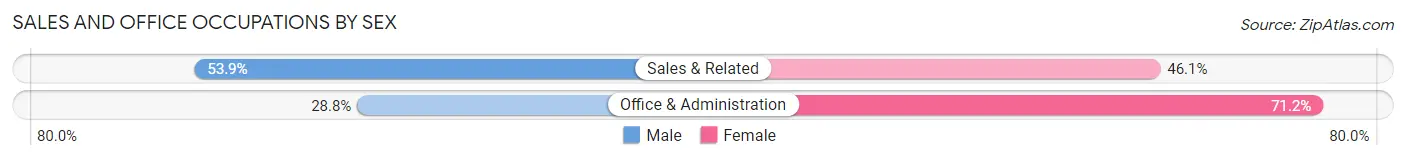
| Occupation | Male | Female |
| Sales & Related | 160,773 (53.9%) | 137,616 (46.1%) |
| Office & Administration | 88,259 (28.8%) | 217,860 (71.2%) |
| Total (Category) | 249,032 (41.2%) | 355,476 (58.8%) |
| Total (Overall) | 1,631,605 (54.0%) | 1,390,137 (46.0%) |
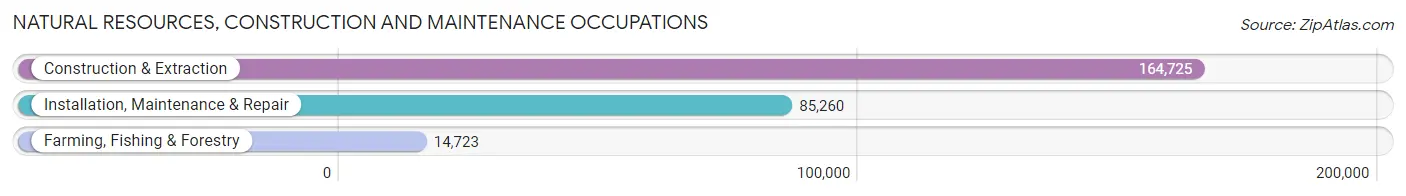
Natural Resources, Construction and Maintenance Occupations
The most common Natural Resources, Construction and Maintenance occupations in Colorado are Construction & Extraction (164,725 | 5.4%), Installation, Maintenance & Repair (85,260 | 2.8%), and Farming, Fishing & Forestry (14,723 | 0.5%).
Natural Resources, Construction and Maintenance Occupations by Sex
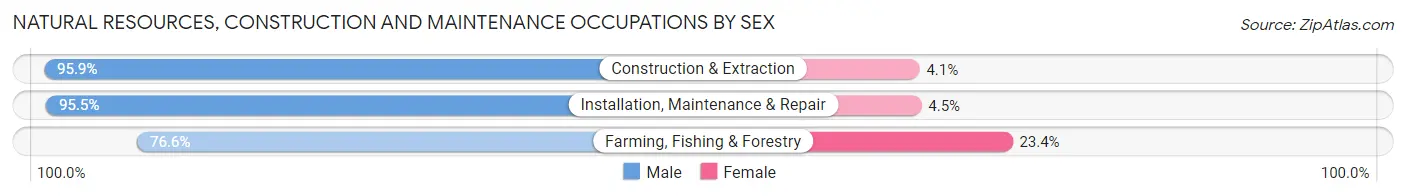
| Occupation | Male | Female |
| Farming, Fishing & Forestry | 11,276 (76.6%) | 3,447 (23.4%) |
| Construction & Extraction | 158,036 (95.9%) | 6,689 (4.1%) |
| Installation, Maintenance & Repair | 81,460 (95.5%) | 3,800 (4.5%) |
| Total (Category) | 250,772 (94.7%) | 13,936 (5.3%) |
| Total (Overall) | 1,631,605 (54.0%) | 1,390,137 (46.0%) |
Production, Transportation and Moving Occupations
The most common Production, Transportation and Moving occupations in Colorado are Production (107,659 | 3.6%), Transportation (104,267 | 3.5%), and Material Moving (88,845 | 2.9%).
Production, Transportation and Moving Occupations by Sex
| Occupation | Male | Female |
| Production | 76,083 (70.7%) | 31,576 (29.3%) |
| Transportation | 88,225 (84.6%) | 16,042 (15.4%) |
| Material Moving | 65,499 (73.7%) | 23,346 (26.3%) |
| Total (Category) | 229,807 (76.4%) | 70,964 (23.6%) |
| Total (Overall) | 1,631,605 (54.0%) | 1,390,137 (46.0%) |
Employment Industries by Sex in Colorado
Employment Industries in Colorado
The major employment industries in Colorado include Health Care & Social Assistance (376,270 | 12.4%), Professional & Scientific (321,264 | 10.6%), Retail Trade (316,358 | 10.5%), Educational Services (273,515 | 9.0%), and Construction (242,997 | 8.0%).
Employment Industries by Sex in Colorado
The Colorado industries that see more men than women are Construction (87.8%), Mining, Quarrying, & Extraction (80.7%), and Agriculture, Fishing & Hunting (76.0%), whereas the industries that tend to have a higher number of women are Health Care & Social Assistance (76.2%), Educational Services (66.7%), and Finance & Insurance (52.7%).
| Industry | Male | Female |
| Agriculture, Fishing & Hunting | 26,341 (76.0%) | 8,336 (24.0%) |
| Mining, Quarrying, & Extraction | 21,178 (80.7%) | 5,068 (19.3%) |
| Construction | 213,429 (87.8%) | 29,568 (12.2%) |
| Manufacturing | 150,983 (71.5%) | 60,271 (28.5%) |
| Wholesale Trade | 48,460 (70.7%) | 20,061 (29.3%) |
| Retail Trade | 172,254 (54.4%) | 144,104 (45.6%) |
| Transportation & Warehousing | 95,243 (75.0%) | 31,766 (25.0%) |
| Utilities | 20,165 (75.5%) | 6,533 (24.5%) |
| Information | 52,626 (65.1%) | 28,152 (34.8%) |
| Finance & Insurance | 68,812 (47.3%) | 76,535 (52.7%) |
| Real Estate, Rental & Leasing | 37,525 (51.3%) | 35,659 (48.7%) |
| Professional & Scientific | 185,522 (57.8%) | 135,742 (42.2%) |
| Enterprise Management | 2,588 (56.3%) | 2,011 (43.7%) |
| Administrative & Support | 71,354 (57.7%) | 52,279 (42.3%) |
| Educational Services | 90,979 (33.3%) | 182,536 (66.7%) |
| Health Care & Social Assistance | 89,437 (23.8%) | 286,833 (76.2%) |
| Arts, Entertainment & Recreation | 39,856 (51.3%) | 37,830 (48.7%) |
| Accommodation & Food Services | 103,777 (49.8%) | 104,757 (50.2%) |
| Public Administration | 76,365 (55.8%) | 60,513 (44.2%) |
| Total | 1,631,605 (54.0%) | 1,390,137 (46.0%) |
Education in Colorado
School Enrollment in Colorado
The most common levels of schooling among the 1,383,399 students in Colorado are high school (295,610 | 21.4%), college / undergraduate (294,605 | 21.3%), and middle school (286,899 | 20.7%).
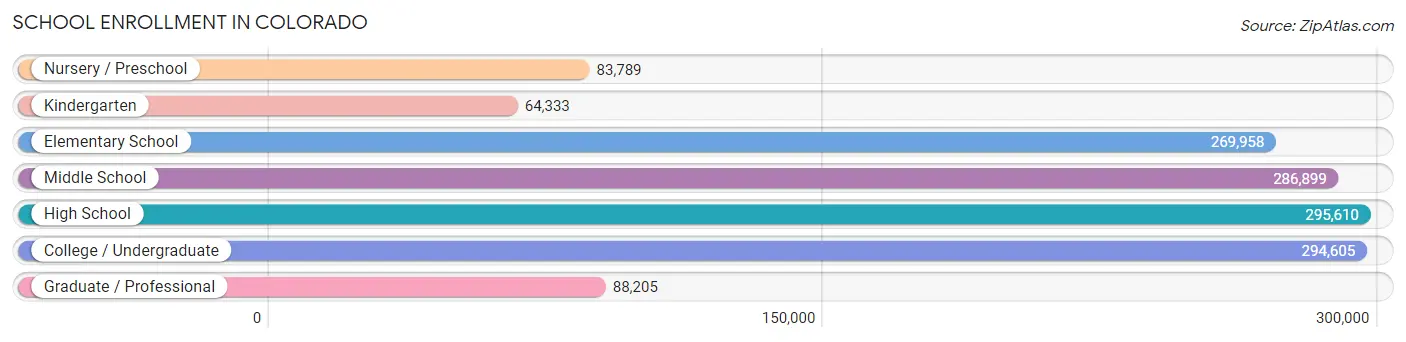
| School Level | # Students | % Students |
| Nursery / Preschool | 83,789 | 6.1% |
| Kindergarten | 64,333 | 4.6% |
| Elementary School | 269,958 | 19.5% |
| Middle School | 286,899 | 20.7% |
| High School | 295,610 | 21.4% |
| College / Undergraduate | 294,605 | 21.3% |
| Graduate / Professional | 88,205 | 6.4% |
| Total | 1,383,399 | 100.0% |
School Enrollment by Age by Funding Source in Colorado
Out of a total of 1,383,399 students who are enrolled in schools in Colorado, 190,909 (13.8%) attend a private institution, while the remaining 1,192,490 (86.2%) are enrolled in public schools. The age group of 3 to 4 year olds has the highest likelihood of being enrolled in private schools, with 25,418 (39.4% in the age bracket) enrolled. Conversely, the age group of 15 to 17 year olds has the lowest likelihood of being enrolled in a private school, with 195,768 (91.7% in the age bracket) attending a public institution.
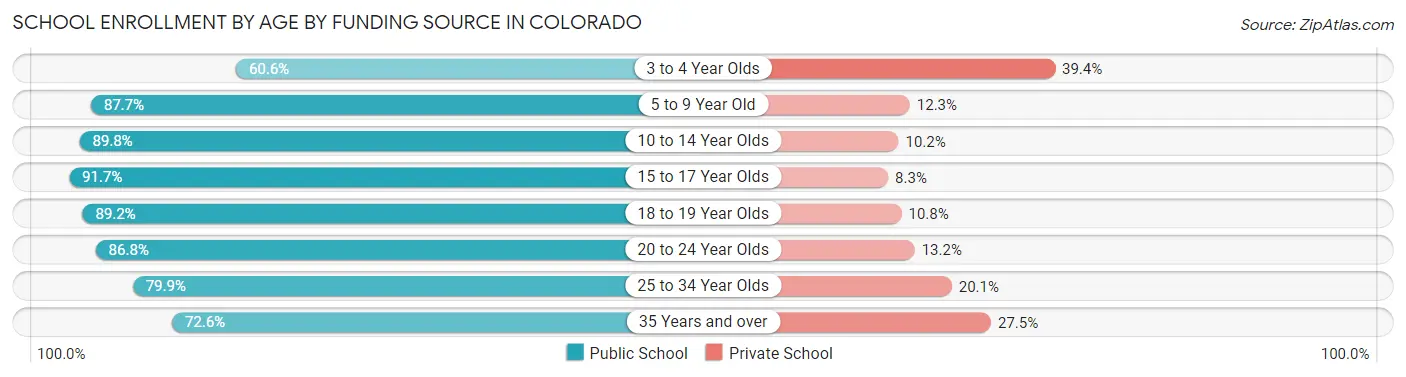
| Age Bracket | Public School | Private School |
| 3 to 4 Year Olds | 39,137 (60.6%) | 25,418 (39.4%) |
| 5 to 9 Year Old | 279,653 (87.7%) | 39,339 (12.3%) |
| 10 to 14 Year Olds | 320,406 (89.8%) | 36,469 (10.2%) |
| 15 to 17 Year Olds | 195,768 (91.7%) | 17,686 (8.3%) |
| 18 to 19 Year Olds | 99,130 (89.2%) | 11,977 (10.8%) |
| 20 to 24 Year Olds | 125,852 (86.8%) | 19,203 (13.2%) |
| 25 to 34 Year Olds | 78,298 (79.9%) | 19,752 (20.1%) |
| 35 Years and over | 54,635 (72.6%) | 20,676 (27.5%) |
| Total | 1,192,490 (86.2%) | 190,909 (13.8%) |
Educational Attainment by Field of Study in Colorado
Business (358,092 | 18.7%), social sciences (166,967 | 8.7%), education (165,023 | 8.6%), science & technology (162,214 | 8.5%), and engineering (158,036 | 8.3%) are the most common fields of study among 1,913,111 individuals in Colorado who have obtained a bachelor's degree or higher.
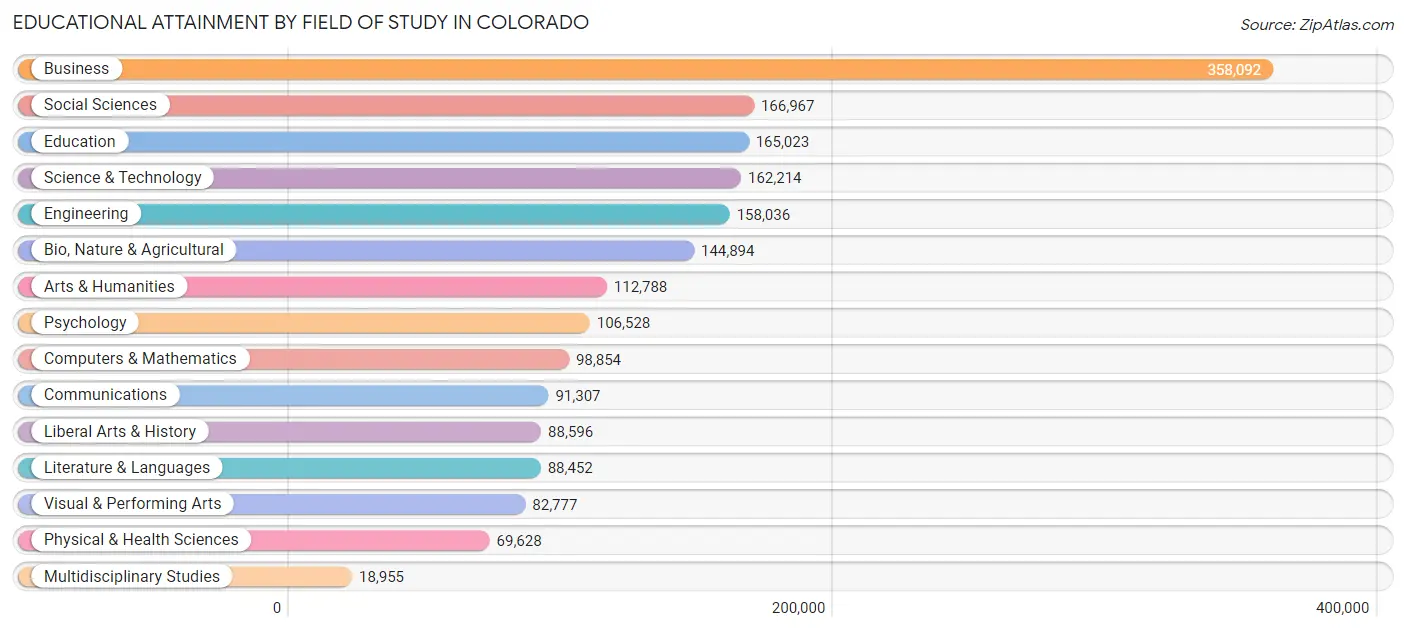
| Field of Study | # Graduates | % Graduates |
| Computers & Mathematics | 98,854 | 5.2% |
| Bio, Nature & Agricultural | 144,894 | 7.6% |
| Physical & Health Sciences | 69,628 | 3.6% |
| Psychology | 106,528 | 5.6% |
| Social Sciences | 166,967 | 8.7% |
| Engineering | 158,036 | 8.3% |
| Multidisciplinary Studies | 18,955 | 1.0% |
| Science & Technology | 162,214 | 8.5% |
| Business | 358,092 | 18.7% |
| Education | 165,023 | 8.6% |
| Literature & Languages | 88,452 | 4.6% |
| Liberal Arts & History | 88,596 | 4.6% |
| Visual & Performing Arts | 82,777 | 4.3% |
| Communications | 91,307 | 4.8% |
| Arts & Humanities | 112,788 | 5.9% |
| Total | 1,913,111 | 100.0% |
Transportation & Commute in Colorado
Vehicle Availability by Sex in Colorado
The most prevalent vehicle ownership categories in Colorado are males with 2 vehicles (678,973, accounting for 41.9%) and females with 2 vehicles (554,068, making up 50.1%).
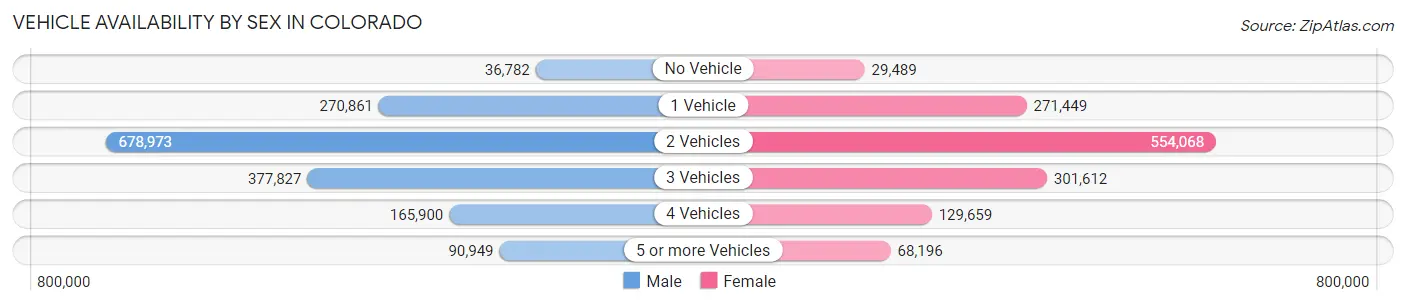
| Vehicles Available | Male | Female |
| No Vehicle | 36,782 (2.3%) | 29,489 (2.2%) |
| 1 Vehicle | 270,861 (16.7%) | 271,449 (20.0%) |
| 2 Vehicles | 678,973 (41.9%) | 554,068 (40.9%) |
| 3 Vehicles | 377,827 (23.3%) | 301,612 (22.3%) |
| 4 Vehicles | 165,900 (10.2%) | 129,659 (9.6%) |
| 5 or more Vehicles | 90,949 (5.6%) | 68,196 (5.0%) |
| Total | 1,621,292 (100.0%) | 1,354,473 (100.0%) |
Commute Time in Colorado
The most frequently occuring commute durations in Colorado are 15 to 19 minutes (396,774 commuters, 15.8%), 20 to 24 minutes (379,945 commuters, 15.1%), and 30 to 34 minutes (362,178 commuters, 14.4%).
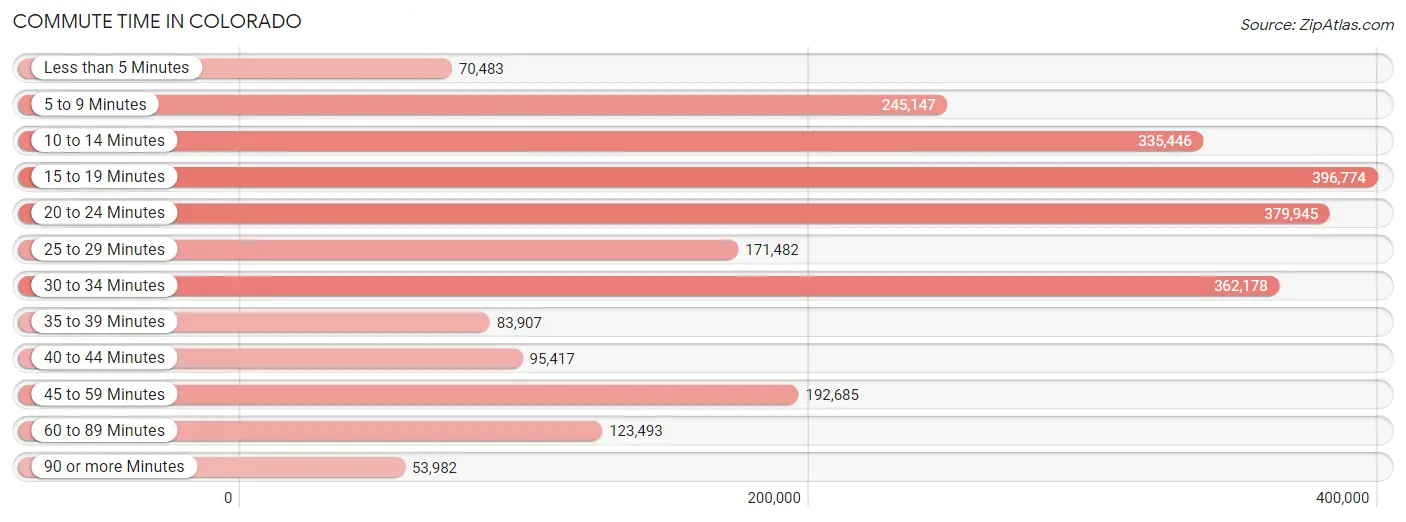
| Commute Time | # Commuters | % Commuters |
| Less than 5 Minutes | 70,483 | 2.8% |
| 5 to 9 Minutes | 245,147 | 9.8% |
| 10 to 14 Minutes | 335,446 | 13.4% |
| 15 to 19 Minutes | 396,774 | 15.8% |
| 20 to 24 Minutes | 379,945 | 15.1% |
| 25 to 29 Minutes | 171,482 | 6.8% |
| 30 to 34 Minutes | 362,178 | 14.4% |
| 35 to 39 Minutes | 83,907 | 3.3% |
| 40 to 44 Minutes | 95,417 | 3.8% |
| 45 to 59 Minutes | 192,685 | 7.7% |
| 60 to 89 Minutes | 123,493 | 4.9% |
| 90 or more Minutes | 53,982 | 2.1% |
Commute Time by Sex in Colorado
The most common commute times in Colorado are 15 to 19 minutes (211,357 commuters, 15.2%) for males and 15 to 19 minutes (185,417 commuters, 16.6%) for females.
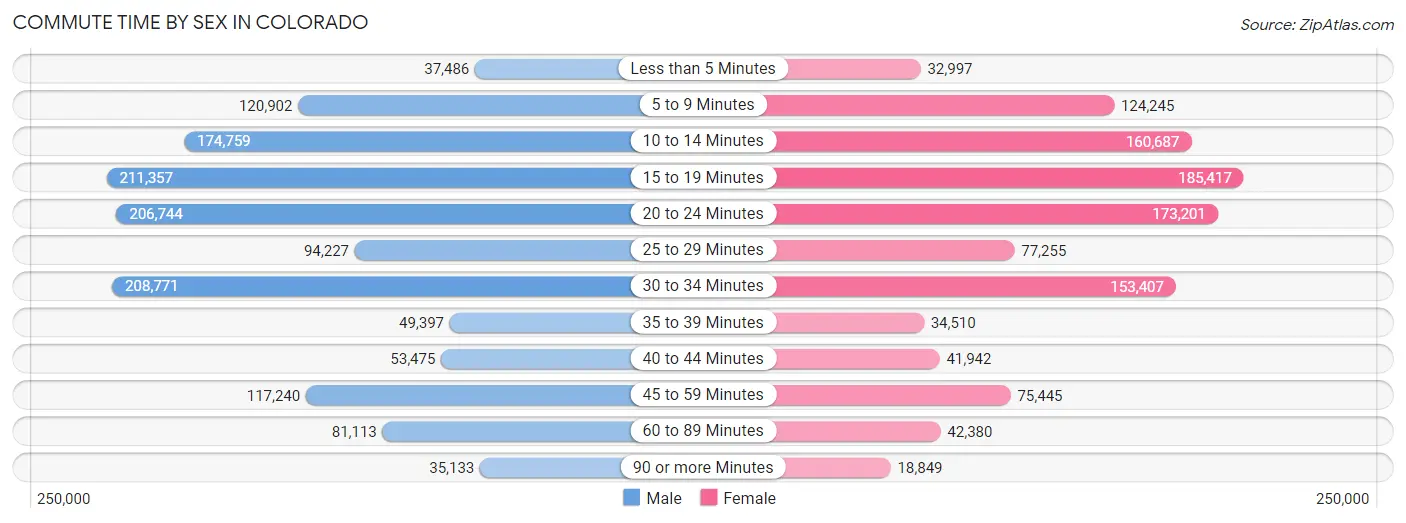
| Commute Time | Male | Female |
| Less than 5 Minutes | 37,486 (2.7%) | 32,997 (2.9%) |
| 5 to 9 Minutes | 120,902 (8.7%) | 124,245 (11.1%) |
| 10 to 14 Minutes | 174,759 (12.6%) | 160,687 (14.3%) |
| 15 to 19 Minutes | 211,357 (15.2%) | 185,417 (16.6%) |
| 20 to 24 Minutes | 206,744 (14.9%) | 173,201 (15.5%) |
| 25 to 29 Minutes | 94,227 (6.8%) | 77,255 (6.9%) |
| 30 to 34 Minutes | 208,771 (15.0%) | 153,407 (13.7%) |
| 35 to 39 Minutes | 49,397 (3.5%) | 34,510 (3.1%) |
| 40 to 44 Minutes | 53,475 (3.8%) | 41,942 (3.7%) |
| 45 to 59 Minutes | 117,240 (8.4%) | 75,445 (6.7%) |
| 60 to 89 Minutes | 81,113 (5.8%) | 42,380 (3.8%) |
| 90 or more Minutes | 35,133 (2.5%) | 18,849 (1.7%) |
Time of Departure to Work by Sex in Colorado
The most frequent times of departure to work in Colorado are 7:00 AM to 7:29 AM (201,381, 14.5%) for males and 7:00 AM to 7:29 AM (180,427, 16.1%) for females.
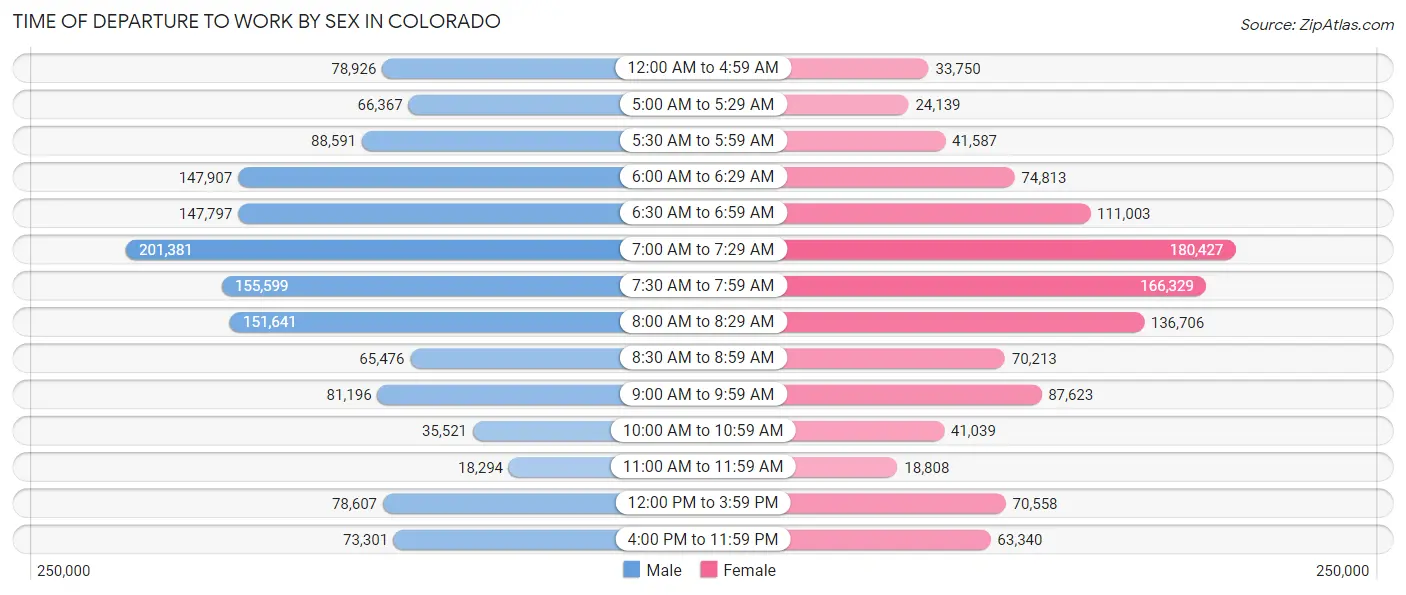
| Time of Departure | Male | Female |
| 12:00 AM to 4:59 AM | 78,926 (5.7%) | 33,750 (3.0%) |
| 5:00 AM to 5:29 AM | 66,367 (4.8%) | 24,139 (2.1%) |
| 5:30 AM to 5:59 AM | 88,591 (6.4%) | 41,587 (3.7%) |
| 6:00 AM to 6:29 AM | 147,907 (10.6%) | 74,813 (6.7%) |
| 6:30 AM to 6:59 AM | 147,797 (10.6%) | 111,003 (9.9%) |
| 7:00 AM to 7:29 AM | 201,381 (14.5%) | 180,427 (16.1%) |
| 7:30 AM to 7:59 AM | 155,599 (11.2%) | 166,329 (14.8%) |
| 8:00 AM to 8:29 AM | 151,641 (10.9%) | 136,706 (12.2%) |
| 8:30 AM to 8:59 AM | 65,476 (4.7%) | 70,213 (6.3%) |
| 9:00 AM to 9:59 AM | 81,196 (5.8%) | 87,623 (7.8%) |
| 10:00 AM to 10:59 AM | 35,521 (2.5%) | 41,039 (3.7%) |
| 11:00 AM to 11:59 AM | 18,294 (1.3%) | 18,808 (1.7%) |
| 12:00 PM to 3:59 PM | 78,607 (5.7%) | 70,558 (6.3%) |
| 4:00 PM to 11:59 PM | 73,301 (5.3%) | 63,340 (5.7%) |
| Total | 1,390,604 (100.0%) | 1,120,335 (100.0%) |
Housing Occupancy in Colorado
Occupancy by Ownership in Colorado
Of the total 2,278,044 dwellings in Colorado, owner-occupied units account for 1,507,547 (66.2%), while renter-occupied units make up 770,497 (33.8%).
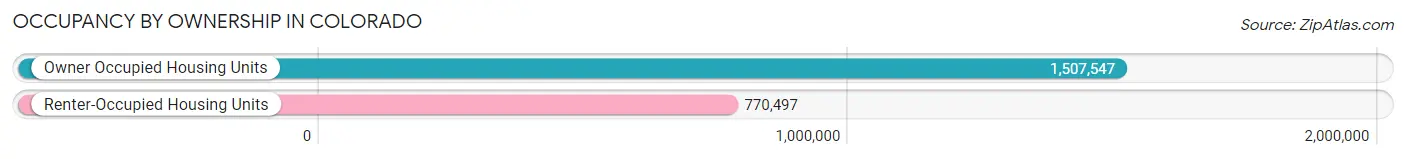
| Occupancy | # Housing Units | % Housing Units |
| Owner Occupied Housing Units | 1,507,547 | 66.2% |
| Renter-Occupied Housing Units | 770,497 | 33.8% |
| Total Occupied Housing Units | 2,278,044 | 100.0% |
Occupancy by Household Size in Colorado
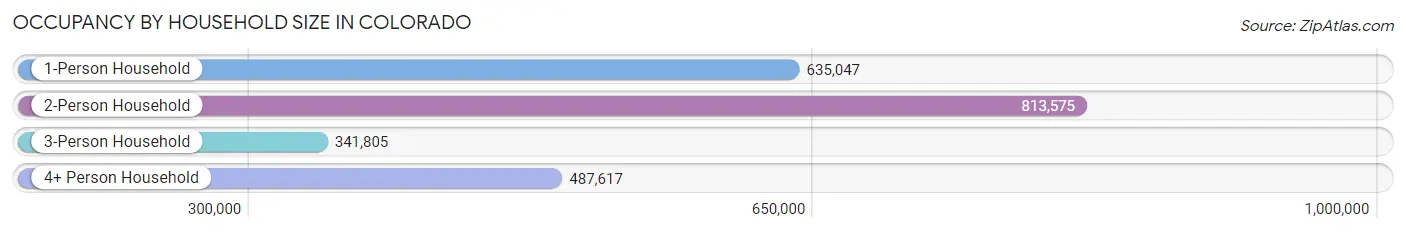
| Household Size | # Housing Units | % Housing Units |
| 1-Person Household | 635,047 | 27.9% |
| 2-Person Household | 813,575 | 35.7% |
| 3-Person Household | 341,805 | 15.0% |
| 4+ Person Household | 487,617 | 21.4% |
| Total Housing Units | 2,278,044 | 100.0% |
Occupancy by Ownership by Household Size in Colorado
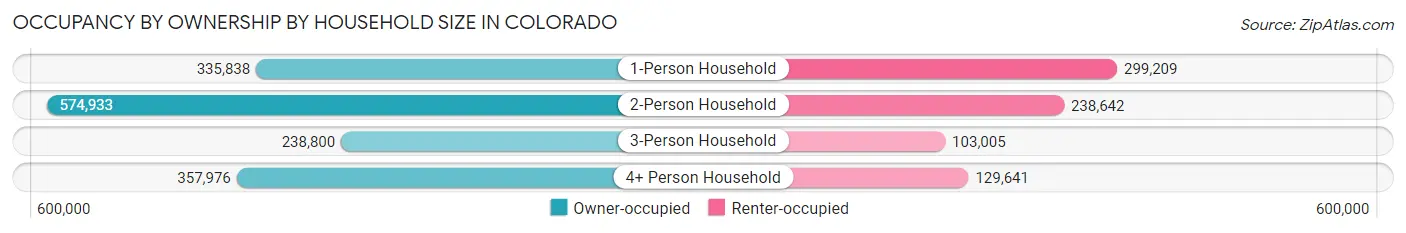
| Household Size | Owner-occupied | Renter-occupied |
| 1-Person Household | 335,838 (52.9%) | 299,209 (47.1%) |
| 2-Person Household | 574,933 (70.7%) | 238,642 (29.3%) |
| 3-Person Household | 238,800 (69.9%) | 103,005 (30.1%) |
| 4+ Person Household | 357,976 (73.4%) | 129,641 (26.6%) |
| Total Housing Units | 1,507,547 (66.2%) | 770,497 (33.8%) |
Occupancy by Educational Attainment in Colorado
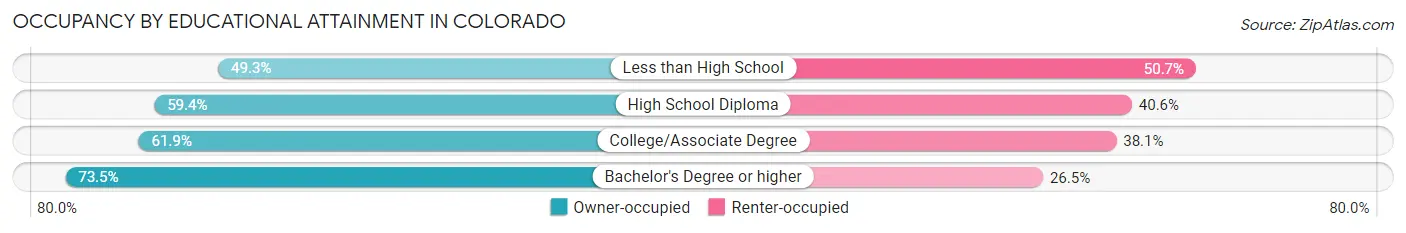
| Household Size | Owner-occupied | Renter-occupied |
| Less than High School | 66,266 (49.3%) | 68,140 (50.7%) |
| High School Diploma | 237,885 (59.4%) | 162,318 (40.6%) |
| College/Associate Degree | 419,400 (61.9%) | 257,925 (38.1%) |
| Bachelor's Degree or higher | 783,996 (73.5%) | 282,114 (26.5%) |
Occupancy by Age of Householder in Colorado
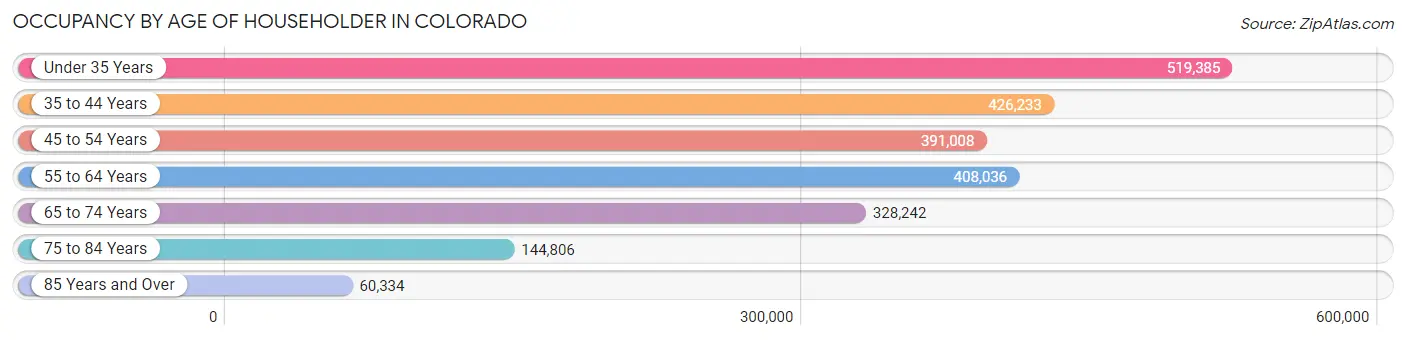
| Age Bracket | # Households | % Households |
| Under 35 Years | 519,385 | 22.8% |
| 35 to 44 Years | 426,233 | 18.7% |
| 45 to 54 Years | 391,008 | 17.2% |
| 55 to 64 Years | 408,036 | 17.9% |
| 65 to 74 Years | 328,242 | 14.4% |
| 75 to 84 Years | 144,806 | 6.4% |
| 85 Years and Over | 60,334 | 2.6% |
| Total | 2,278,044 | 100.0% |
Housing Finances in Colorado
Median Income by Occupancy in Colorado
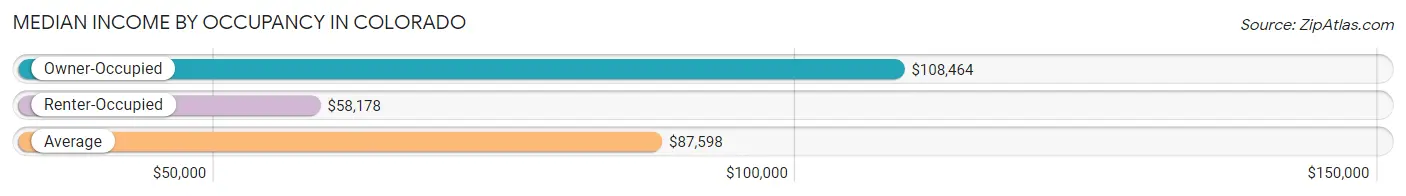
| Occupancy Type | # Households | Median Income |
| Owner-Occupied | 1,507,547 (66.2%) | $108,464 |
| Renter-Occupied | 770,497 (33.8%) | $58,178 |
| Average | 2,278,044 (100.0%) | $87,598 |
Occupancy by Householder Income Bracket in Colorado
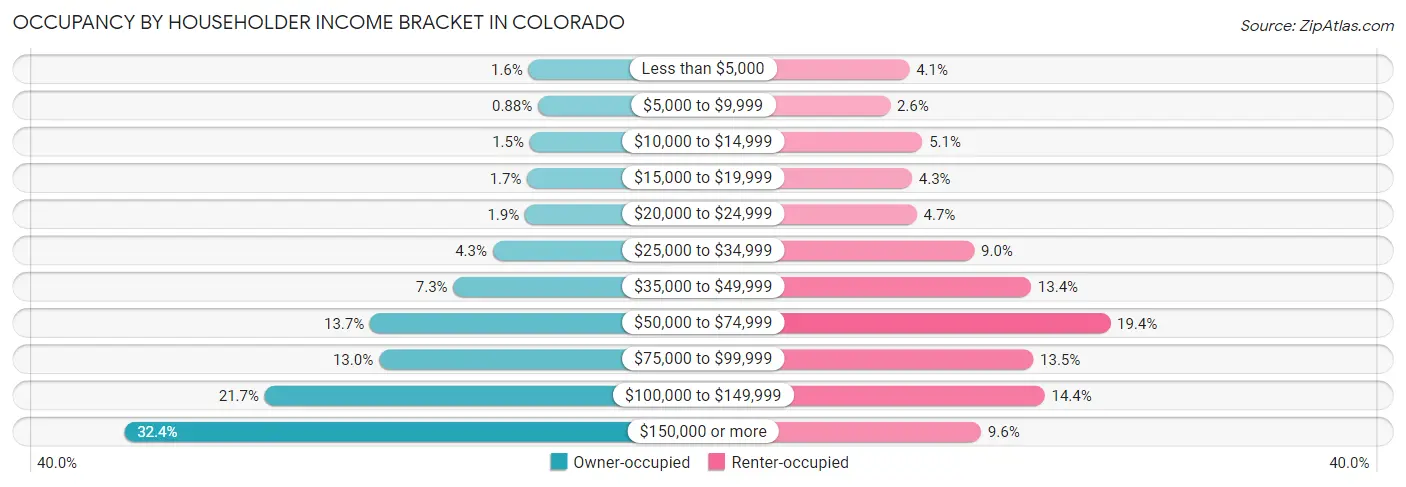
| Income Bracket | Owner-occupied | Renter-occupied |
| Less than $5,000 | 24,160 (1.6%) | 31,519 (4.1%) |
| $5,000 to $9,999 | 13,203 (0.9%) | 20,223 (2.6%) |
| $10,000 to $14,999 | 22,807 (1.5%) | 39,152 (5.1%) |
| $15,000 to $19,999 | 25,593 (1.7%) | 33,042 (4.3%) |
| $20,000 to $24,999 | 28,136 (1.9%) | 35,834 (4.6%) |
| $25,000 to $34,999 | 65,289 (4.3%) | 69,585 (9.0%) |
| $35,000 to $49,999 | 110,513 (7.3%) | 102,941 (13.4%) |
| $50,000 to $74,999 | 206,227 (13.7%) | 149,431 (19.4%) |
| $75,000 to $99,999 | 195,969 (13.0%) | 104,211 (13.5%) |
| $100,000 to $149,999 | 327,123 (21.7%) | 110,968 (14.4%) |
| $150,000 or more | 488,527 (32.4%) | 73,591 (9.6%) |
| Total | 1,507,547 (100.0%) | 770,497 (100.0%) |
Monthly Housing Cost Tiers in Colorado
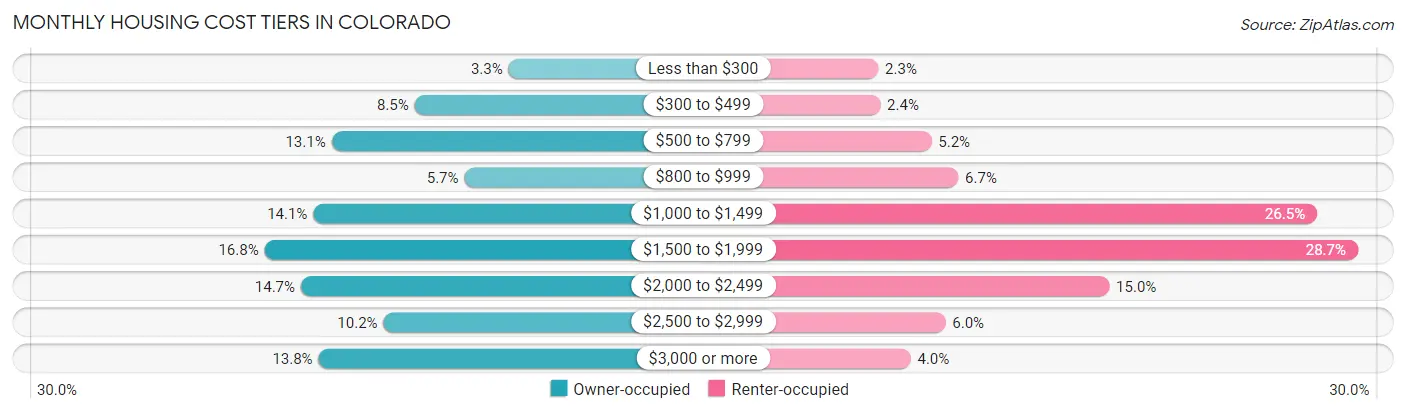
| Monthly Cost | Owner-occupied | Renter-occupied |
| Less than $300 | 49,354 (3.3%) | 17,309 (2.2%) |
| $300 to $499 | 127,569 (8.5%) | 18,189 (2.4%) |
| $500 to $799 | 196,786 (13.1%) | 39,979 (5.2%) |
| $800 to $999 | 86,032 (5.7%) | 51,413 (6.7%) |
| $1,000 to $1,499 | 211,989 (14.1%) | 204,123 (26.5%) |
| $1,500 to $1,999 | 252,488 (16.8%) | 221,475 (28.7%) |
| $2,000 to $2,499 | 222,221 (14.7%) | 115,681 (15.0%) |
| $2,500 to $2,999 | 153,516 (10.2%) | 45,938 (6.0%) |
| $3,000 or more | 207,592 (13.8%) | 31,107 (4.0%) |
| Total | 1,507,547 (100.0%) | 770,497 (100.0%) |
Physical Housing Characteristics in Colorado
Housing Structures in Colorado
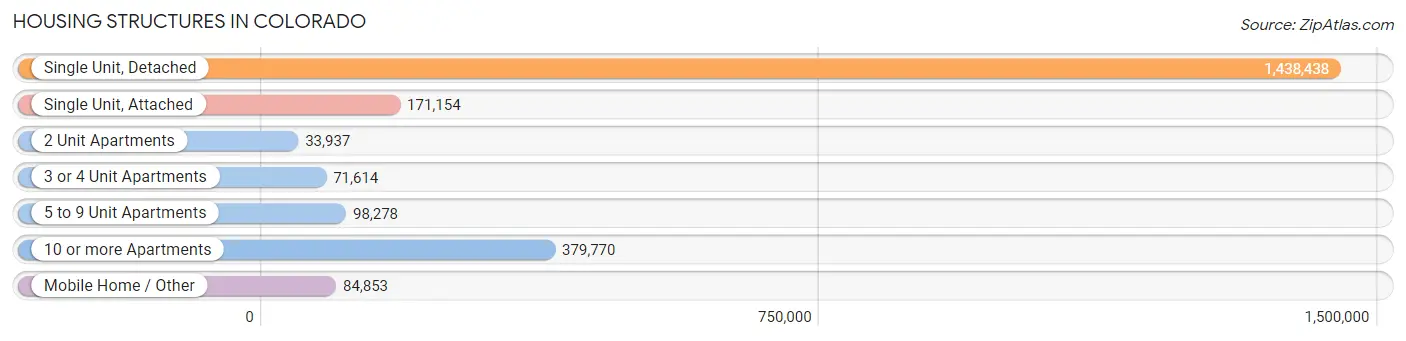
| Structure Type | # Housing Units | % Housing Units |
| Single Unit, Detached | 1,438,438 | 63.1% |
| Single Unit, Attached | 171,154 | 7.5% |
| 2 Unit Apartments | 33,937 | 1.5% |
| 3 or 4 Unit Apartments | 71,614 | 3.1% |
| 5 to 9 Unit Apartments | 98,278 | 4.3% |
| 10 or more Apartments | 379,770 | 16.7% |
| Mobile Home / Other | 84,853 | 3.7% |
| Total | 2,278,044 | 100.0% |
Housing Structures by Occupancy in Colorado
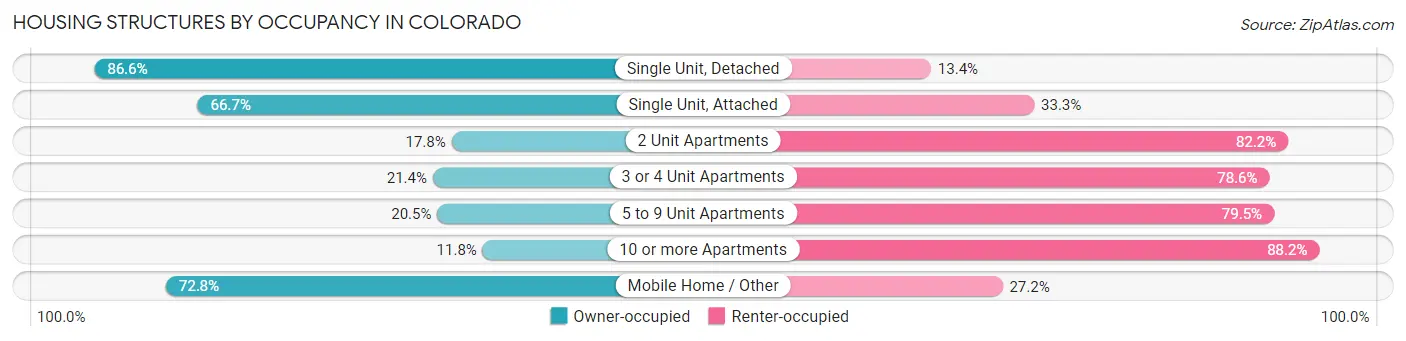
| Structure Type | Owner-occupied | Renter-occupied |
| Single Unit, Detached | 1,245,223 (86.6%) | 193,215 (13.4%) |
| Single Unit, Attached | 114,160 (66.7%) | 56,994 (33.3%) |
| 2 Unit Apartments | 6,042 (17.8%) | 27,895 (82.2%) |
| 3 or 4 Unit Apartments | 15,330 (21.4%) | 56,284 (78.6%) |
| 5 to 9 Unit Apartments | 20,190 (20.5%) | 78,088 (79.5%) |
| 10 or more Apartments | 44,838 (11.8%) | 334,932 (88.2%) |
| Mobile Home / Other | 61,764 (72.8%) | 23,089 (27.2%) |
| Total | 1,507,547 (66.2%) | 770,497 (33.8%) |
Housing Structures by Number of Rooms in Colorado
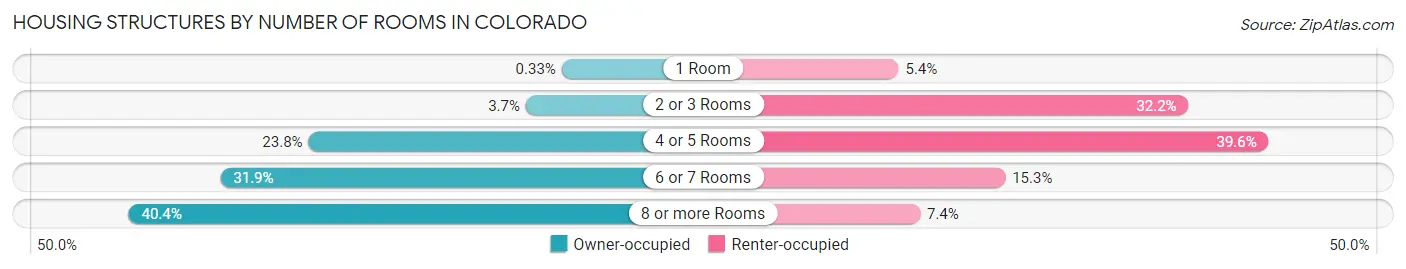
| Number of Rooms | Owner-occupied | Renter-occupied |
| 1 Room | 4,994 (0.3%) | 41,793 (5.4%) |
| 2 or 3 Rooms | 54,958 (3.6%) | 248,340 (32.2%) |
| 4 or 5 Rooms | 358,082 (23.7%) | 305,458 (39.6%) |
| 6 or 7 Rooms | 480,775 (31.9%) | 117,805 (15.3%) |
| 8 or more Rooms | 608,738 (40.4%) | 57,101 (7.4%) |
| Total | 1,507,547 (100.0%) | 770,497 (100.0%) |
Housing Structure by Heating Type in Colorado
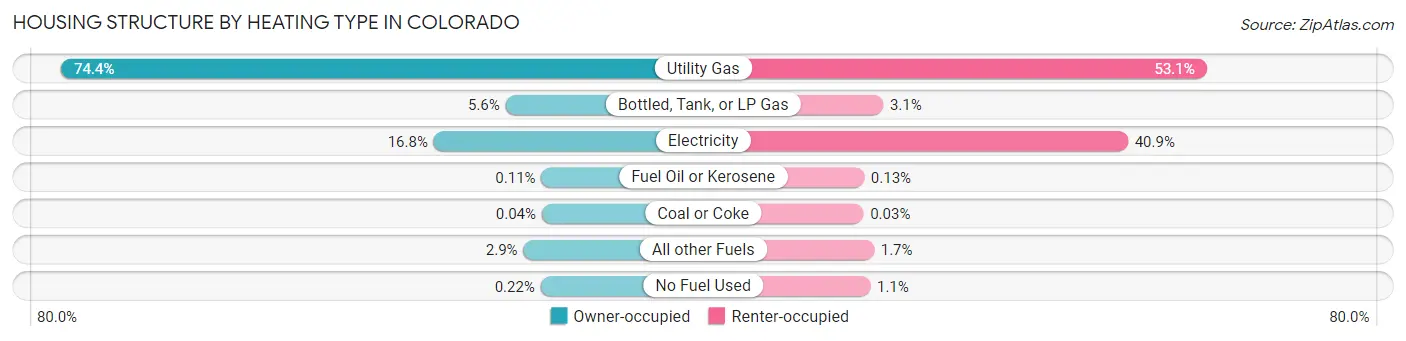
| Heating Type | Owner-occupied | Renter-occupied |
| Utility Gas | 1,120,943 (74.4%) | 409,085 (53.1%) |
| Bottled, Tank, or LP Gas | 85,089 (5.6%) | 23,766 (3.1%) |
| Electricity | 252,491 (16.8%) | 315,295 (40.9%) |
| Fuel Oil or Kerosene | 1,607 (0.1%) | 1,033 (0.1%) |
| Coal or Coke | 597 (0.0%) | 210 (0.0%) |
| All other Fuels | 43,564 (2.9%) | 12,798 (1.7%) |
| No Fuel Used | 3,256 (0.2%) | 8,310 (1.1%) |
| Total | 1,507,547 (100.0%) | 770,497 (100.0%) |
Household Vehicle Usage in Colorado
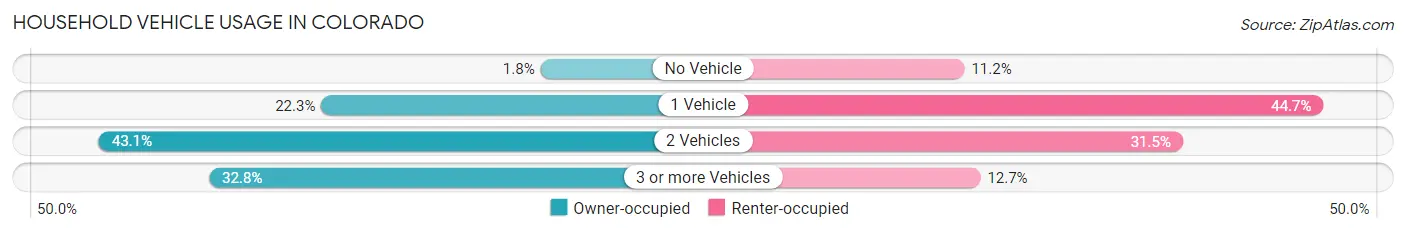
| Vehicles per Household | Owner-occupied | Renter-occupied |
| No Vehicle | 27,786 (1.8%) | 85,952 (11.2%) |
| 1 Vehicle | 336,303 (22.3%) | 344,127 (44.7%) |
| 2 Vehicles | 649,343 (43.1%) | 242,922 (31.5%) |
| 3 or more Vehicles | 494,115 (32.8%) | 97,496 (12.7%) |
| Total | 1,507,547 (100.0%) | 770,497 (100.0%) |
Real Estate & Mortgages in Colorado
Real Estate and Mortgage Overview in Colorado
| Characteristic | Without Mortgage | With Mortgage |
| Housing Units | 449,808 | 1,057,739 |
| Median Property Value | $435,600 | $476,300 |
| Median Household Income | $76,863 | $392,479 |
| Monthly Housing Costs | $578 | $205,209 |
| Real Estate Taxes | $2,000 | $19,466 |
Property Value by Mortgage Status in Colorado
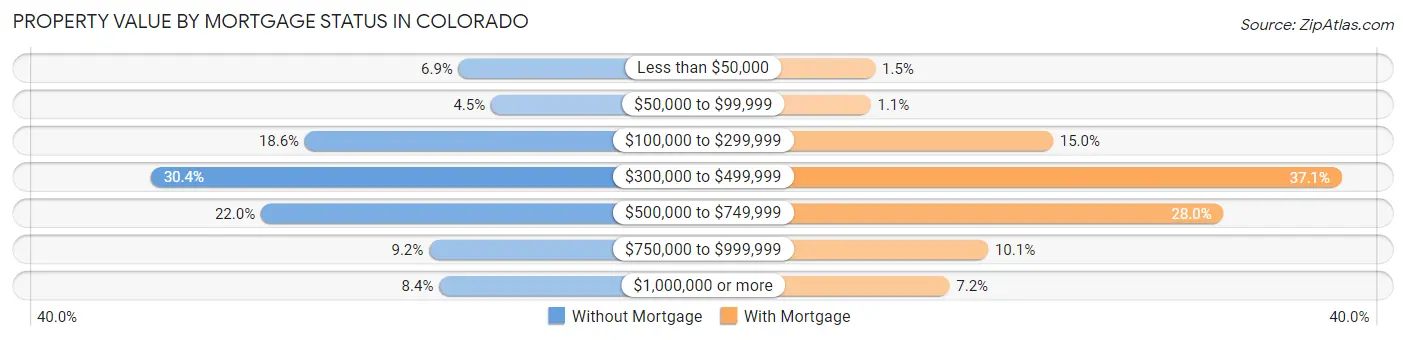
| Property Value | Without Mortgage | With Mortgage |
| Less than $50,000 | 31,185 (6.9%) | 15,802 (1.5%) |
| $50,000 to $99,999 | 20,054 (4.5%) | 12,110 (1.1%) |
| $100,000 to $299,999 | 83,836 (18.6%) | 158,952 (15.0%) |
| $300,000 to $499,999 | 136,718 (30.4%) | 391,912 (37.0%) |
| $500,000 to $749,999 | 98,916 (22.0%) | 296,638 (28.0%) |
| $750,000 to $999,999 | 41,272 (9.2%) | 106,677 (10.1%) |
| $1,000,000 or more | 37,827 (8.4%) | 75,648 (7.1%) |
| Total | 449,808 (100.0%) | 1,057,739 (100.0%) |
Household Income by Mortgage Status in Colorado
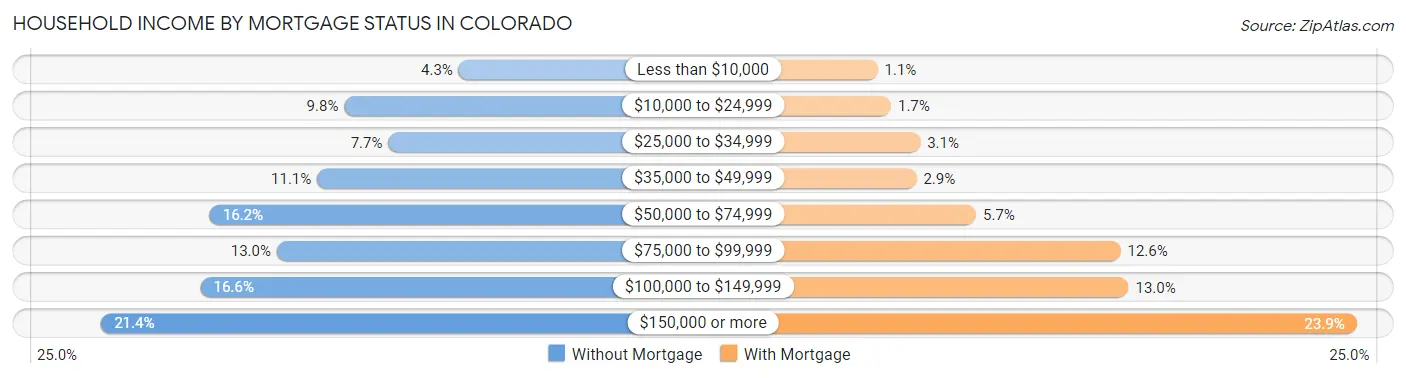
| Household Income | Without Mortgage | With Mortgage |
| Less than $10,000 | 19,467 (4.3%) | 11,099 (1.1%) |
| $10,000 to $24,999 | 43,999 (9.8%) | 17,896 (1.7%) |
| $25,000 to $34,999 | 34,564 (7.7%) | 32,537 (3.1%) |
| $35,000 to $49,999 | 49,799 (11.1%) | 30,725 (2.9%) |
| $50,000 to $74,999 | 72,765 (16.2%) | 60,714 (5.7%) |
| $75,000 to $99,999 | 58,417 (13.0%) | 133,462 (12.6%) |
| $100,000 to $149,999 | 74,749 (16.6%) | 137,552 (13.0%) |
| $150,000 or more | 96,048 (21.3%) | 252,374 (23.9%) |
| Total | 449,808 (100.0%) | 1,057,739 (100.0%) |
Property Value to Household Income Ratio in Colorado
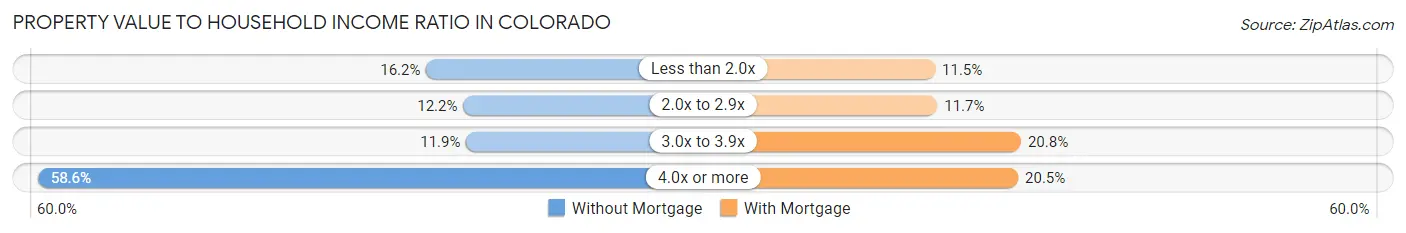
| Value-to-Income Ratio | Without Mortgage | With Mortgage |
| Less than 2.0x | 72,991 (16.2%) | 121,231 (11.5%) |
| 2.0x to 2.9x | 54,874 (12.2%) | 123,710 (11.7%) |
| 3.0x to 3.9x | 53,370 (11.9%) | 220,198 (20.8%) |
| 4.0x or more | 263,426 (58.6%) | 216,950 (20.5%) |
| Total | 449,808 (100.0%) | 1,057,739 (100.0%) |
Real Estate Taxes by Mortgage Status in Colorado
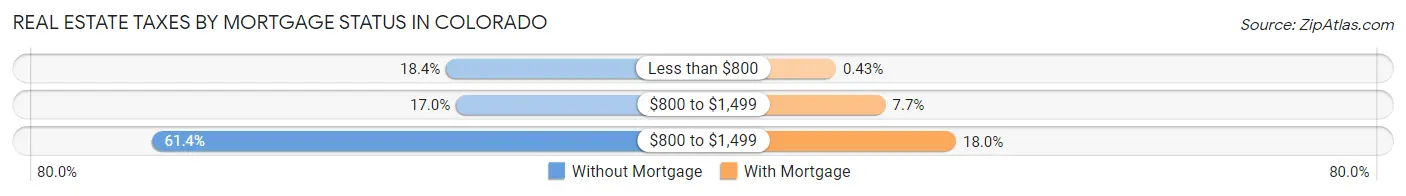
| Property Taxes | Without Mortgage | With Mortgage |
| Less than $800 | 82,825 (18.4%) | 4,594 (0.4%) |
| $800 to $1,499 | 76,273 (17.0%) | 81,234 (7.7%) |
| $800 to $1,499 | 276,384 (61.4%) | 190,104 (18.0%) |
| Total | 449,808 (100.0%) | 1,057,739 (100.0%) |
Health & Disability in Colorado
Health Insurance Coverage by Age in Colorado
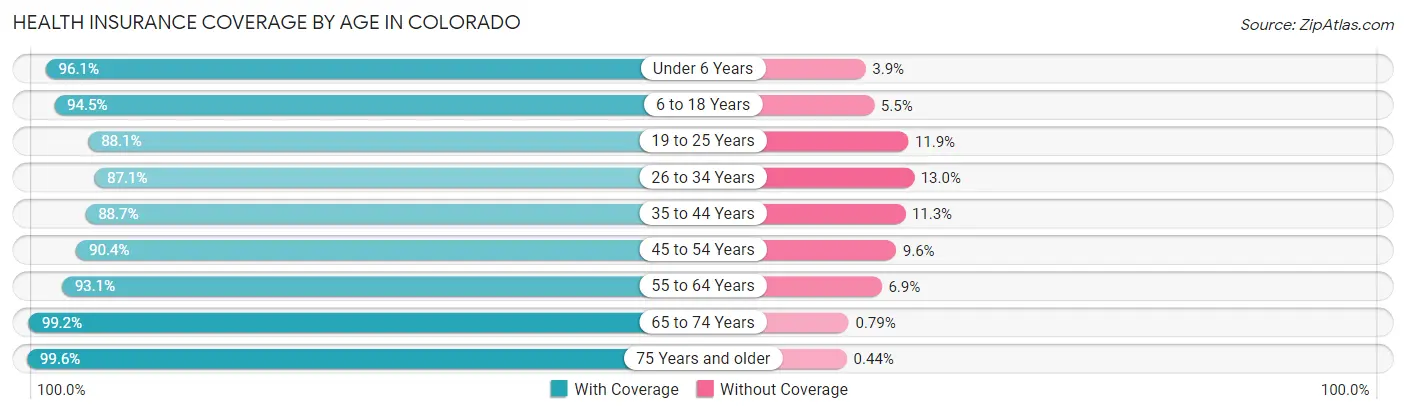
| Age Bracket | With Coverage | Without Coverage |
| Under 6 Years | 369,396 (96.1%) | 15,071 (3.9%) |
| 6 to 18 Years | 882,817 (94.5%) | 51,598 (5.5%) |
| 19 to 25 Years | 468,600 (88.1%) | 63,091 (11.9%) |
| 26 to 34 Years | 687,596 (87.1%) | 102,266 (13.0%) |
| 35 to 44 Years | 710,816 (88.7%) | 90,629 (11.3%) |
| 45 to 54 Years | 633,342 (90.4%) | 67,329 (9.6%) |
| 55 to 64 Years | 647,674 (93.1%) | 48,248 (6.9%) |
| 65 to 74 Years | 522,314 (99.2%) | 4,151 (0.8%) |
| 75 Years and older | 309,424 (99.6%) | 1,357 (0.4%) |
| Total | 5,231,979 (92.2%) | 443,740 (7.8%) |
Health Insurance Coverage by Citizenship Status in Colorado
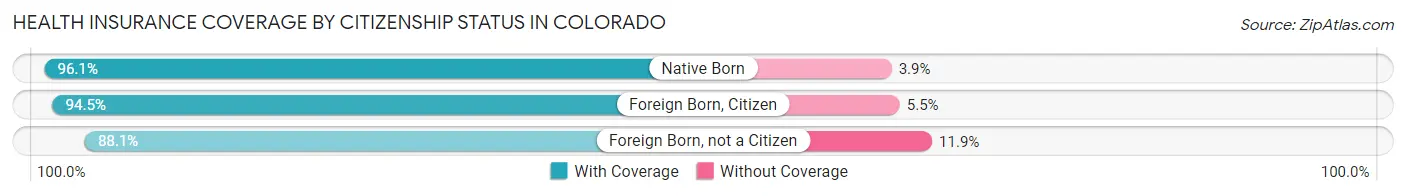
| Citizenship Status | With Coverage | Without Coverage |
| Native Born | 369,396 (96.1%) | 15,071 (3.9%) |
| Foreign Born, Citizen | 882,817 (94.5%) | 51,598 (5.5%) |
| Foreign Born, not a Citizen | 468,600 (88.1%) | 63,091 (11.9%) |
Health Insurance Coverage by Household Income in Colorado
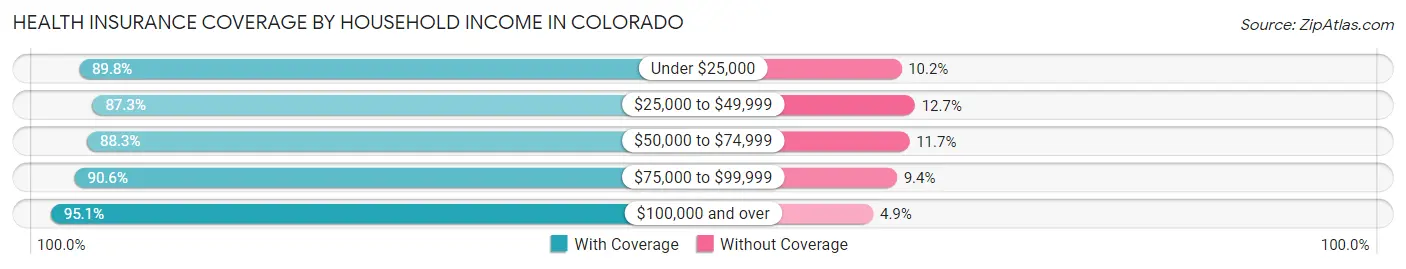
| Household Income | With Coverage | Without Coverage |
| Under $25,000 | 410,047 (89.8%) | 46,502 (10.2%) |
| $25,000 to $49,999 | 594,136 (87.3%) | 86,629 (12.7%) |
| $50,000 to $74,999 | 700,427 (88.3%) | 92,840 (11.7%) |
| $75,000 to $99,999 | 682,025 (90.6%) | 70,430 (9.4%) |
| $100,000 and over | 2,792,353 (95.1%) | 144,585 (4.9%) |
Public vs Private Health Insurance Coverage by Age in Colorado
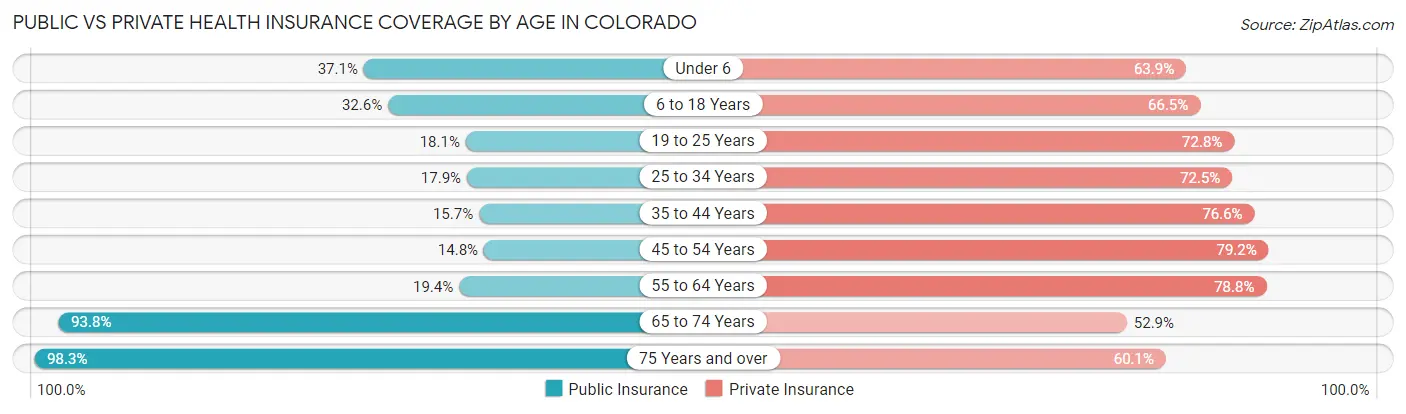
| Age Bracket | Public Insurance | Private Insurance |
| Under 6 | 142,451 (37.0%) | 245,584 (63.9%) |
| 6 to 18 Years | 304,178 (32.6%) | 621,412 (66.5%) |
| 19 to 25 Years | 96,350 (18.1%) | 387,182 (72.8%) |
| 25 to 34 Years | 141,390 (17.9%) | 572,313 (72.5%) |
| 35 to 44 Years | 125,527 (15.7%) | 613,831 (76.6%) |
| 45 to 54 Years | 103,314 (14.7%) | 554,942 (79.2%) |
| 55 to 64 Years | 134,753 (19.4%) | 548,276 (78.8%) |
| 65 to 74 Years | 493,843 (93.8%) | 278,537 (52.9%) |
| 75 Years and over | 305,342 (98.3%) | 186,882 (60.1%) |
| Total | 1,847,148 (32.5%) | 4,008,959 (70.6%) |
Disability Status by Sex by Age in Colorado
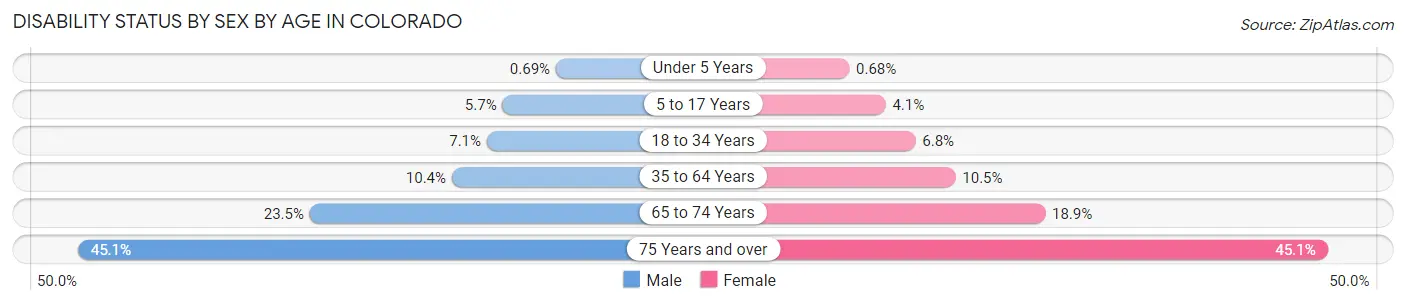
| Age Bracket | Male | Female |
| Under 5 Years | 1,115 (0.7%) | 1,056 (0.7%) |
| 5 to 17 Years | 26,730 (5.7%) | 18,229 (4.1%) |
| 18 to 34 Years | 51,134 (7.1%) | 46,447 (6.8%) |
| 35 to 64 Years | 115,105 (10.3%) | 114,433 (10.5%) |
| 65 to 74 Years | 59,620 (23.5%) | 51,503 (18.9%) |
| 75 Years and over | 59,986 (45.1%) | 80,090 (45.1%) |
Disability Class by Sex by Age in Colorado
Disability Class: Hearing Difficulty
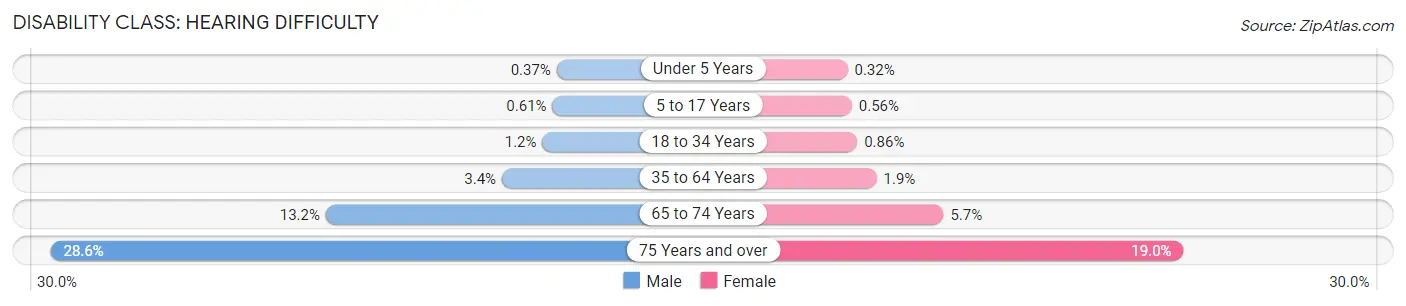
| Age Bracket | Male | Female |
| Under 5 Years | 599 (0.4%) | 504 (0.3%) |
| 5 to 17 Years | 2,888 (0.6%) | 2,505 (0.6%) |
| 18 to 34 Years | 8,397 (1.2%) | 5,875 (0.9%) |
| 35 to 64 Years | 38,012 (3.4%) | 21,025 (1.9%) |
| 65 to 74 Years | 33,534 (13.2%) | 15,443 (5.7%) |
| 75 Years and over | 38,023 (28.6%) | 33,788 (19.0%) |
Disability Class: Vision Difficulty
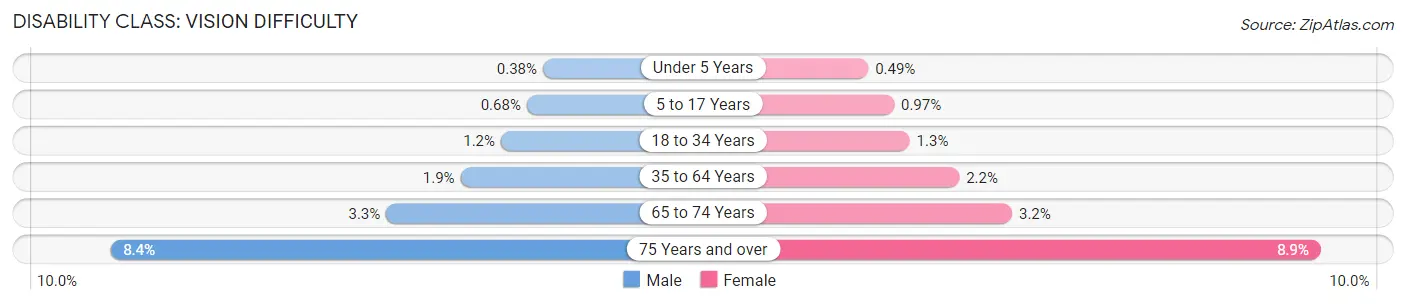
| Age Bracket | Male | Female |
| Under 5 Years | 615 (0.4%) | 754 (0.5%) |
| 5 to 17 Years | 3,219 (0.7%) | 4,368 (1.0%) |
| 18 to 34 Years | 8,345 (1.2%) | 8,597 (1.3%) |
| 35 to 64 Years | 21,270 (1.9%) | 23,663 (2.2%) |
| 65 to 74 Years | 8,330 (3.3%) | 8,625 (3.2%) |
| 75 Years and over | 11,201 (8.4%) | 15,796 (8.9%) |
Disability Class: Cognitive Difficulty
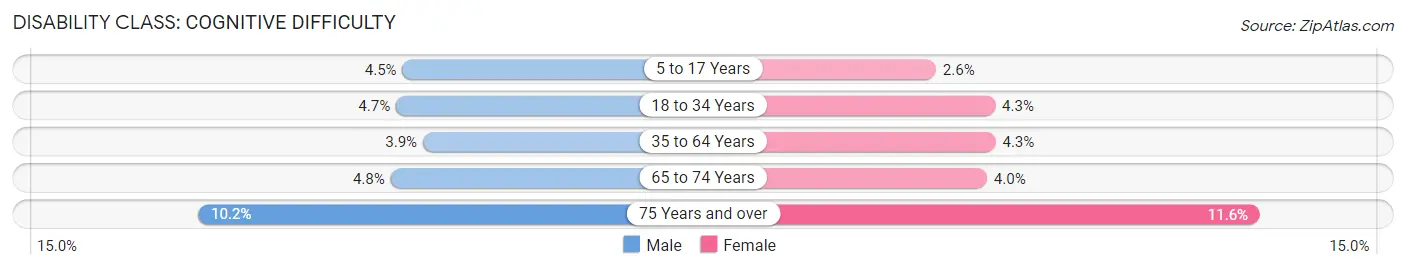
| Age Bracket | Male | Female |
| 5 to 17 Years | 21,190 (4.5%) | 11,758 (2.6%) |
| 18 to 34 Years | 33,570 (4.7%) | 29,041 (4.3%) |
| 35 to 64 Years | 43,511 (3.9%) | 46,442 (4.3%) |
| 65 to 74 Years | 12,178 (4.8%) | 11,041 (4.0%) |
| 75 Years and over | 13,539 (10.2%) | 20,675 (11.6%) |
Disability Class: Ambulatory Difficulty
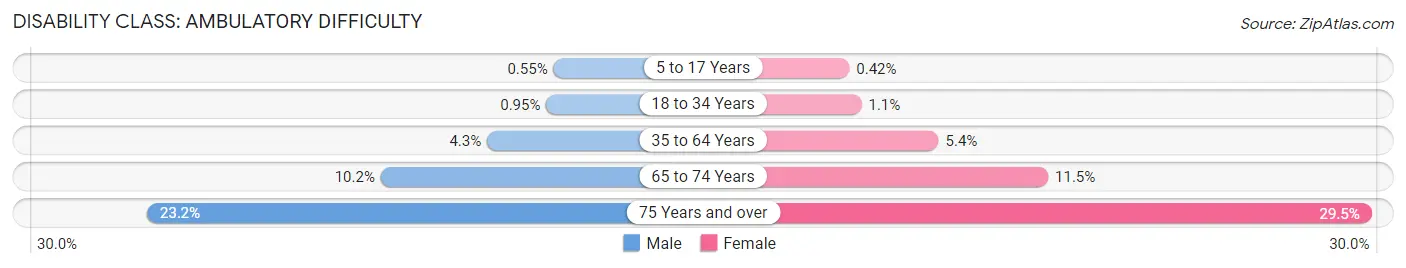
| Age Bracket | Male | Female |
| 5 to 17 Years | 2,626 (0.5%) | 1,876 (0.4%) |
| 18 to 34 Years | 6,867 (0.9%) | 7,452 (1.1%) |
| 35 to 64 Years | 47,336 (4.3%) | 58,510 (5.4%) |
| 65 to 74 Years | 25,766 (10.2%) | 31,378 (11.5%) |
| 75 Years and over | 30,879 (23.2%) | 52,403 (29.5%) |
Disability Class: Self-Care Difficulty

| Age Bracket | Male | Female |
| 5 to 17 Years | 5,342 (1.1%) | 3,565 (0.8%) |
| 18 to 34 Years | 4,298 (0.6%) | 4,080 (0.6%) |
| 35 to 64 Years | 17,173 (1.5%) | 18,009 (1.7%) |
| 65 to 74 Years | 6,877 (2.7%) | 7,540 (2.8%) |
| 75 Years and over | 10,607 (8.0%) | 18,544 (10.4%) |
Technology Access in Colorado
Computing Device Access in Colorado
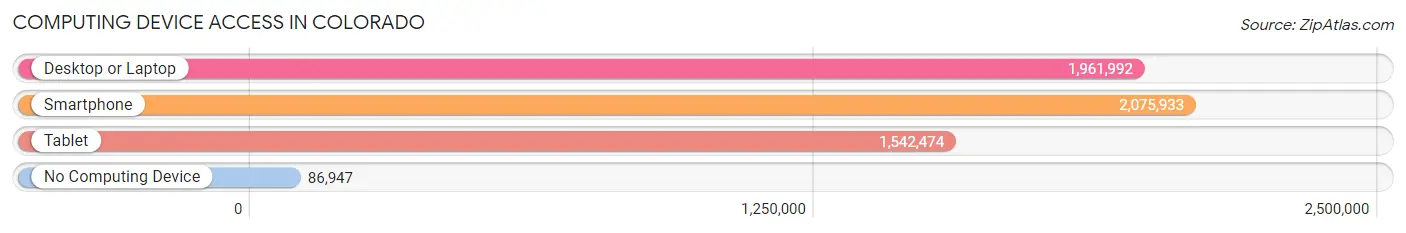
| Device Type | # Households | % Households |
| Desktop or Laptop | 1,961,992 | 86.1% |
| Smartphone | 2,075,933 | 91.1% |
| Tablet | 1,542,474 | 67.7% |
| No Computing Device | 86,947 | 3.8% |
| Total | 2,278,044 | 100.0% |
Internet Access in Colorado
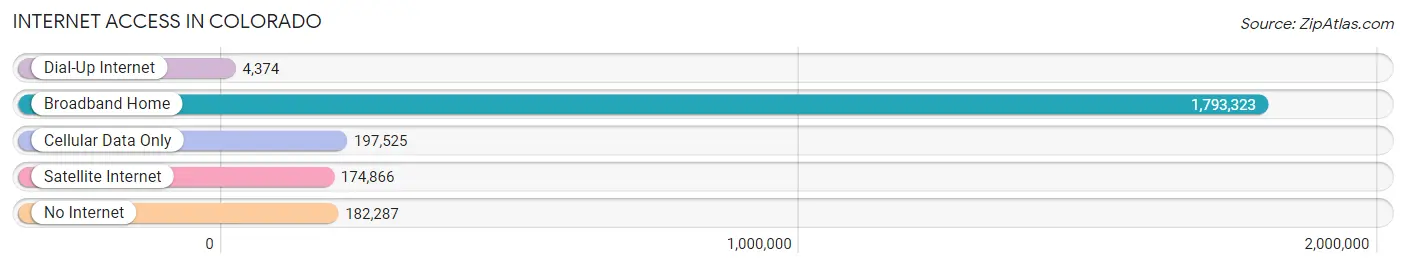
| Internet Type | # Households | % Households |
| Dial-Up Internet | 4,374 | 0.2% |
| Broadband Home | 1,793,323 | 78.7% |
| Cellular Data Only | 197,525 | 8.7% |
| Satellite Internet | 174,866 | 7.7% |
| No Internet | 182,287 | 8.0% |
| Total | 2,278,044 | 100.0% |
Colorado Summary
Colorado is a state located in the western United States. It is bordered by Wyoming to the north, Nebraska to the northeast, Kansas to the east, Oklahoma to the southeast, New Mexico to the south, Utah to the west, and Arizona to the southwest. Colorado is the 8th most extensive and the 22nd most populous of the 50 United States. The state was named for the Colorado River, which Spanish explorers named the Río Colorado for the ruddy silt the river carried from the mountains.
Geography
Colorado is located in the western United States, in the Rocky Mountain region. It is the 8th largest state in the US, with an area of 104,093 square miles. Colorado is divided into four distinct geographic regions: the Rocky Mountains, the Great Plains, the Plateau, and the Southwest. The Rocky Mountains are the highest mountain range in the US, and they run through the center of the state. The Great Plains are located in the eastern part of the state, and they are characterized by rolling hills and prairies. The Plateau is located in the western part of the state, and it is characterized by high desert and canyons. The Southwest is located in the southwestern corner of the state, and it is characterized by red rock formations and canyons.
The highest point in Colorado is Mount Elbert, which is 14,440 feet above sea level. The lowest point is the Arikaree River, which is 3,317 feet above sea level. Colorado has numerous rivers, including the Colorado River, the Arkansas River, the Rio Grande, and the South Platte River.
Climate
Colorado has a semi-arid climate, with hot summers and cold winters. The average temperature in the summer is around 70°F, and the average temperature in the winter is around 30°F. The average annual precipitation is around 15 inches.
Demographics
As of the 2010 census, the population of Colorado was 5,029,196. The population is made up of a variety of ethnic and racial backgrounds, including White (77.1%), Hispanic or Latino (20.7%), African American (4.3%), Asian (2.8%), and Native American (1.2%). The median household income in Colorado is $57,265, and the median age is 37.
Economy
Colorado has a diverse economy, with a variety of industries. The largest industries in the state are agriculture, tourism, and technology. Agriculture is the largest industry in the state, and it includes the production of livestock, dairy, and crops. Tourism is the second largest industry in the state, and it includes skiing, hiking, camping, and other outdoor activities. Technology is the third largest industry in the state, and it includes software development, aerospace, and telecommunications.
Colorado also has a large mining industry, which includes the production of coal, gold, silver, and other minerals. The state also has a large manufacturing industry, which includes the production of food products, machinery, and chemicals.
Conclusion
Colorado is a state located in the western United States. It is bordered by Wyoming to the north, Nebraska to the northeast, Kansas to the east, Oklahoma to the southeast, New Mexico to the south, Utah to the west, and Arizona to the southwest. Colorado is the 8th most extensive and the 22nd most populous of the 50 United States. The state has a semi-arid climate, with hot summers and cold winters. The population of Colorado is 5,029,196, and it is made up of a variety of ethnic and racial backgrounds. The economy of Colorado is diverse, with a variety of industries, including agriculture, tourism, technology, mining, and manufacturing.
Common Questions
When was Colorado Incorporated?
Colorado was Incorporated into the Union on Aug 1, 1876.
What is the Total Area of Colorado?
Total Area of Colorado is 104,094 Square Miles.
What is the Total Land Area of Colorado?
Total Land Area of Colorado is 103,641 Square Miles.
What is the Total Water Area of Colorado?
Total Water Area of Colorado is 454 Square Miles.
What is the Average Elevation in Colorado?
Average Elevation in Colorado is 6,800 Feet.
What is the Highest Elevation in Colorado?
Highest Elevation in Colorado is 14,440 Feet.
What is the Lowest Elevation in Colorado?
Lowest Elevation in Colorado is 3315 Feet.
What is the Population Density in Colorado?
Population Density in Colorado is 55.7 People per Square Mile.
What is Per Capita Income in Colorado?
Per Capita income in Colorado is $47,346.
What is the Median Family Income in Colorado?
Median Family Income in Colorado is $108,664.
What is the Median Household income in Colorado?
Median Household Income in Colorado is $87,598.
What is Income or Wage Gap in Colorado?
Income or Wage Gap in Colorado is 28.4%.
Women in Colorado earn 71.6 cents for every dollar earned by a man.
What is Family Income Deficit in Colorado?
Family Income Deficit in Colorado is $11,245.
Families that are below poverty line in Colorado earn $11,245 less on average than the poverty threshold level.
What is Inequality or Gini Index in Colorado?
Inequality or Gini Index in Colorado is 0.46.
What is the Total Population of Colorado?
Total Population of Colorado is 5,770,790.
What is the Total Male Population of Colorado?
Total Male Population of Colorado is 2,927,588.
What is the Total Female Population of Colorado?
Total Female Population of Colorado is 2,843,202.
What is the Ratio of Males per 100 Females in Colorado?
There are 102.97 Males per 100 Females in Colorado.
What is the Ratio of Females per 100 Males in Colorado?
There are 97.12 Females per 100 Males in Colorado.
What is the Median Population Age in Colorado?
Median Population Age in Colorado is 37.3 Years.
What is the Average Family Size in Colorado
Average Family Size in Colorado is 3.1 People.
What is the Average Household Size in Colorado
Average Household Size in Colorado is 2.5 People.
How Large is the Labor Force in Colorado?
There are 3,207,091 People in the Labor Forcein in Colorado.
What is the Percentage of People in the Labor Force in Colorado?
68.6% of People are in the Labor Force in Colorado.
What is the Unemployment Rate in Colorado?
Unemployment Rate in Colorado is 4.5%.