Cities with the Highest Percentage of Population with a Degree in Psychology in California
RELATED REPORTS & OPTIONS
Psychology
California
Compare Cities
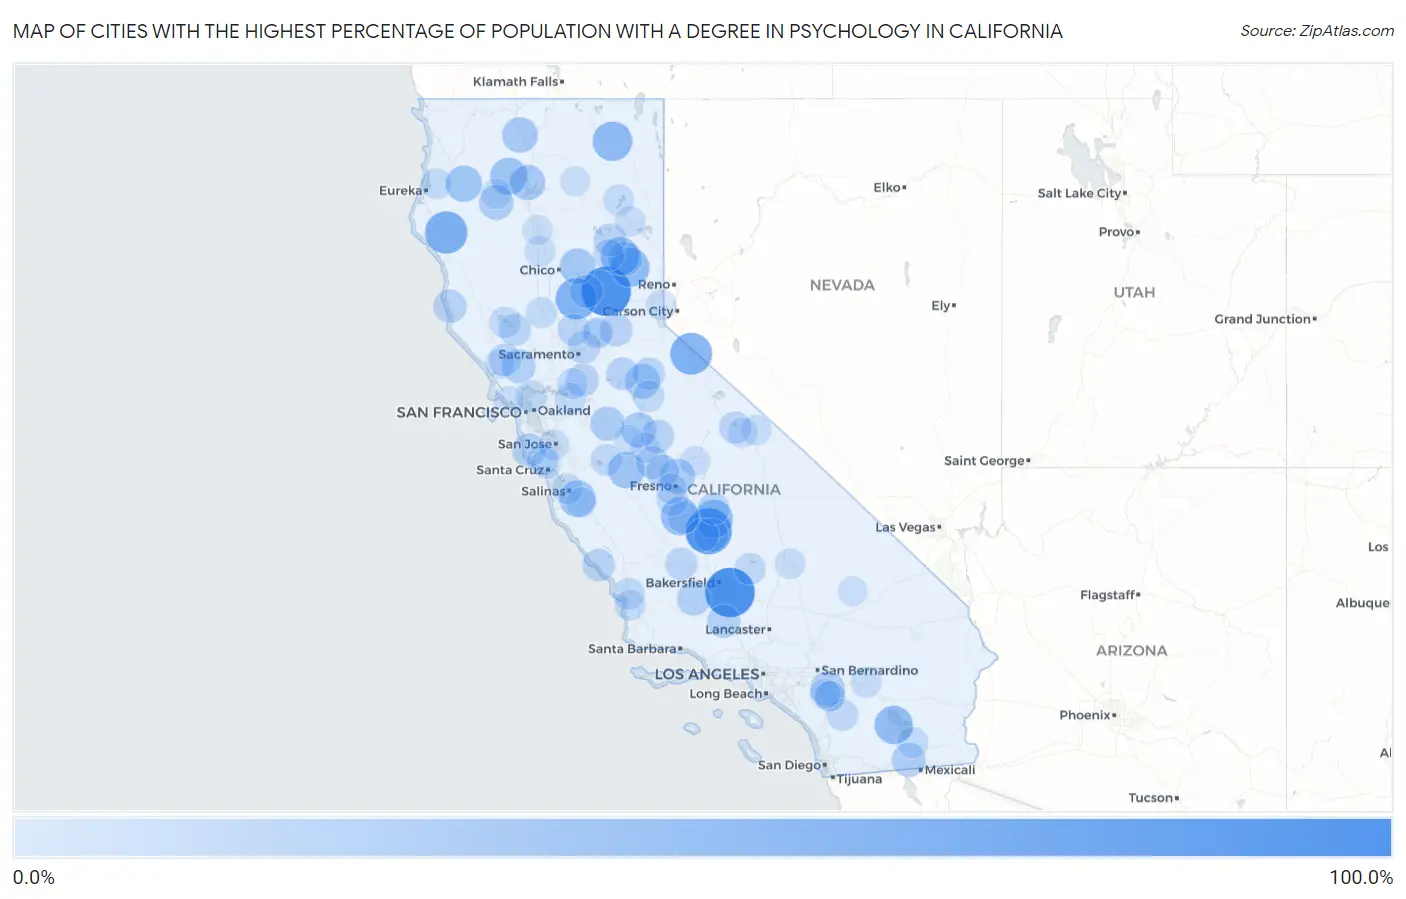
Map of Cities with the Highest Percentage of Population with a Degree in Psychology in California
0.0%
100.0%
Cities with the Highest Percentage of Population with a Degree in Psychology in California
| City | % Graduates | vs State | vs National | |
| 1. | Edmundson Acres | 100.0% | 5.3%(+94.7)#1 | 5.1%(+94.9)#16 |
| 2. | Pike | 100.0% | 5.3%(+94.7)#2 | 5.1%(+94.9)#34 |
| 3. | Woodville | 84.6% | 5.3%(+79.3)#3 | 5.1%(+79.6)#55 |
| 4. | Miranda | 68.2% | 5.3%(+62.8)#4 | 5.1%(+63.1)#78 |
| 5. | Coleville | 65.9% | 5.3%(+60.6)#5 | 5.1%(+60.9)#96 |
| 6. | Honcut | 63.2% | 5.3%(+57.8)#6 | 5.1%(+58.1)#106 |
| 7. | Canby | 55.5% | 5.3%(+50.1)#7 | 5.1%(+50.4)#136 |
| 8. | Goodmanville | 54.5% | 5.3%(+49.2)#8 | 5.1%(+49.5)#141 |
| 9. | Clio | 52.8% | 5.3%(+47.4)#9 | 5.1%(+47.7)#147 |
| 10. | Salton City | 50.4% | 5.3%(+45.1)#10 | 5.1%(+45.4)#156 |
| 11. | Greenhorn | 50.0% | 5.3%(+44.7)#11 | 5.1%(+44.9)#178 |
| 12. | Tooleville | 50.0% | 5.3%(+44.7)#12 | 5.1%(+44.9)#201 |
| 13. | Ono | 50.0% | 5.3%(+44.7)#13 | 5.1%(+44.9)#208 |
| 14. | Armona | 49.7% | 5.3%(+44.4)#14 | 5.1%(+44.7)#211 |
| 15. | El Centro Naval Air Facility | 44.9% | 5.3%(+39.6)#15 | 5.1%(+39.8)#243 |
| 16. | Trinity Center | 44.7% | 5.3%(+39.4)#16 | 5.1%(+39.7)#246 |
| 17. | Chualar | 43.3% | 5.3%(+38.0)#17 | 5.1%(+38.3)#261 |
| 18. | South Dos Palos | 43.1% | 5.3%(+37.8)#18 | 5.1%(+38.1)#263 |
| 19. | Trinity Village | 41.8% | 5.3%(+36.5)#19 | 5.1%(+36.8)#280 |
| 20. | Concow | 39.1% | 5.3%(+33.8)#20 | 5.1%(+34.1)#324 |
| 21. | Gazelle | 38.5% | 5.3%(+33.1)#21 | 5.1%(+33.4)#334 |
| 22. | Lakehead | 38.0% | 5.3%(+32.6)#22 | 5.1%(+32.9)#337 |
| 23. | Fort Washington | 36.4% | 5.3%(+31.1)#23 | 5.1%(+31.4)#361 |
| 24. | Snelling | 36.4% | 5.3%(+31.0)#24 | 5.1%(+31.3)#364 |
| 25. | Avery | 36.0% | 5.3%(+30.7)#25 | 5.1%(+30.9)#373 |
| 26. | Douglas City | 34.6% | 5.3%(+29.2)#26 | 5.1%(+29.5)#391 |
| 27. | Lakeview | 34.1% | 5.3%(+28.7)#27 | 5.1%(+29.0)#398 |
| 28. | Parklawn | 33.3% | 5.3%(+28.0)#28 | 5.1%(+28.3)#406 |
| 29. | East Bakersfield | 32.8% | 5.3%(+27.5)#29 | 5.1%(+27.8)#439 |
| 30. | Cromberg | 32.7% | 5.3%(+27.4)#30 | 5.1%(+27.6)#440 |
| 31. | Seeley | 31.9% | 5.3%(+26.6)#31 | 5.1%(+26.9)#453 |
| 32. | South Taft | 31.6% | 5.3%(+26.2)#32 | 5.1%(+26.5)#461 |
| 33. | Kenwood | 31.1% | 5.3%(+25.8)#33 | 5.1%(+26.1)#470 |
| 34. | Poplar Cotton Center | 30.8% | 5.3%(+25.4)#34 | 5.1%(+25.7)#475 |
| 35. | Pescadero | 29.6% | 5.3%(+24.2)#35 | 5.1%(+24.5)#502 |
| 36. | Frazier Park | 29.0% | 5.3%(+23.7)#36 | 5.1%(+24.0)#518 |
| 37. | Catheys Valley | 28.7% | 5.3%(+23.3)#37 | 5.1%(+23.6)#526 |
| 38. | Fairmead | 28.4% | 5.3%(+23.1)#38 | 5.1%(+23.4)#550 |
| 39. | Tipton | 28.3% | 5.3%(+23.0)#39 | 5.1%(+23.3)#553 |
| 40. | Parksdale | 28.3% | 5.3%(+23.0)#40 | 5.1%(+23.3)#555 |
| 41. | Albion | 28.2% | 5.3%(+22.9)#41 | 5.1%(+23.2)#556 |
| 42. | Rackerby | 28.1% | 5.3%(+22.8)#42 | 5.1%(+23.1)#565 |
| 43. | Greenville | 27.3% | 5.3%(+21.9)#43 | 5.1%(+22.2)#584 |
| 44. | Georgetown | 27.1% | 5.3%(+21.8)#44 | 5.1%(+22.0)#593 |
| 45. | Thornton | 26.7% | 5.3%(+21.3)#45 | 5.1%(+21.6)#611 |
| 46. | Fulton | 26.5% | 5.3%(+21.2)#46 | 5.1%(+21.5)#618 |
| 47. | Mokelumne Hill | 26.4% | 5.3%(+21.0)#47 | 5.1%(+21.3)#622 |
| 48. | San Simeon | 26.2% | 5.3%(+20.9)#48 | 5.1%(+21.1)#635 |
| 49. | Dorrington | 25.7% | 5.3%(+20.4)#49 | 5.1%(+20.6)#657 |
| 50. | Mcclellan Park | 25.3% | 5.3%(+20.0)#50 | 5.1%(+20.3)#672 |
| 51. | Lost Hills | 25.0% | 5.3%(+19.7)#51 | 5.1%(+19.9)#673 |
| 52. | Home Garden | 25.0% | 5.3%(+19.7)#52 | 5.1%(+19.9)#674 |
| 53. | Nicolaus | 25.0% | 5.3%(+19.7)#53 | 5.1%(+19.9)#708 |
| 54. | Lower Lake | 24.4% | 5.3%(+19.1)#54 | 5.1%(+19.4)#737 |
| 55. | Crowley Lake | 23.7% | 5.3%(+18.4)#55 | 5.1%(+18.7)#776 |
| 56. | Woodlake | 23.2% | 5.3%(+17.8)#56 | 5.1%(+18.1)#805 |
| 57. | Edna | 23.0% | 5.3%(+17.7)#57 | 5.1%(+18.0)#815 |
| 58. | Caruthers | 22.8% | 5.3%(+17.5)#58 | 5.1%(+17.8)#821 |
| 59. | Aguanga | 22.4% | 5.3%(+17.1)#59 | 5.1%(+17.3)#846 |
| 60. | Quincy | 22.1% | 5.3%(+16.8)#60 | 5.1%(+17.1)#877 |
| 61. | Bodfish | 22.0% | 5.3%(+16.7)#61 | 5.1%(+17.0)#882 |
| 62. | Santa Nella | 22.0% | 5.3%(+16.7)#62 | 5.1%(+17.0)#883 |
| 63. | Tara Hills | 21.7% | 5.3%(+16.4)#63 | 5.1%(+16.7)#895 |
| 64. | Soda Bay | 21.7% | 5.3%(+16.4)#64 | 5.1%(+16.7)#901 |
| 65. | Soulsbyville | 21.7% | 5.3%(+16.3)#65 | 5.1%(+16.6)#903 |
| 66. | Knightsen | 21.2% | 5.3%(+15.8)#66 | 5.1%(+16.1)#946 |
| 67. | Brookdale | 20.7% | 5.3%(+15.4)#67 | 5.1%(+15.7)#982 |
| 68. | Westmorland | 20.7% | 5.3%(+15.4)#68 | 5.1%(+15.6)#983 |
| 69. | Spaulding | 19.6% | 5.3%(+14.2)#69 | 5.1%(+14.5)#1,095 |
| 70. | Williams | 19.5% | 5.3%(+14.2)#70 | 5.1%(+14.4)#1,100 |
| 71. | Blue Lake | 19.5% | 5.3%(+14.1)#71 | 5.1%(+14.4)#1,101 |
| 72. | Isleton | 19.1% | 5.3%(+13.8)#72 | 5.1%(+14.1)#1,134 |
| 73. | Boronda | 19.0% | 5.3%(+13.7)#73 | 5.1%(+14.0)#1,156 |
| 74. | Fruitdale | 18.7% | 5.3%(+13.3)#74 | 5.1%(+13.6)#1,186 |
| 75. | Callender | 18.6% | 5.3%(+13.2)#75 | 5.1%(+13.5)#1,197 |
| 76. | Richfield | 18.5% | 5.3%(+13.2)#76 | 5.1%(+13.5)#1,202 |
| 77. | Kings Beach | 18.3% | 5.3%(+13.0)#77 | 5.1%(+13.3)#1,220 |
| 78. | Chalfant | 18.3% | 5.3%(+13.0)#78 | 5.1%(+13.2)#1,222 |
| 79. | Desert Edge | 18.3% | 5.3%(+12.9)#79 | 5.1%(+13.2)#1,225 |
| 80. | Penryn | 18.1% | 5.3%(+12.8)#80 | 5.1%(+13.1)#1,250 |
| 81. | West Park | 18.1% | 5.3%(+12.7)#81 | 5.1%(+13.0)#1,254 |
| 82. | Johnstonville | 17.7% | 5.3%(+12.4)#82 | 5.1%(+12.7)#1,295 |
| 83. | China Lake Acres | 17.7% | 5.3%(+12.4)#83 | 5.1%(+12.7)#1,297 |
| 84. | Green Acres | 17.6% | 5.3%(+12.3)#84 | 5.1%(+12.6)#1,300 |
| 85. | Auberry | 17.4% | 5.3%(+12.0)#85 | 5.1%(+12.3)#1,338 |
| 86. | Bend | 17.2% | 5.3%(+11.9)#86 | 5.1%(+12.1)#1,358 |
| 87. | Potomac Park | 17.0% | 5.3%(+11.7)#87 | 5.1%(+12.0)#1,371 |
| 88. | Paradise | 16.8% | 5.3%(+11.5)#88 | 5.1%(+11.8)#1,387 |
| 89. | Winchester | 16.7% | 5.3%(+11.3)#89 | 5.1%(+11.6)#1,393 |
| 90. | Romoland | 16.5% | 5.3%(+11.2)#90 | 5.1%(+11.5)#1,457 |
| 91. | Gonzales | 16.5% | 5.3%(+11.2)#91 | 5.1%(+11.5)#1,460 |
| 92. | Bolinas | 16.4% | 5.3%(+11.1)#92 | 5.1%(+11.4)#1,468 |
| 93. | Newcastle | 16.2% | 5.3%(+10.8)#93 | 5.1%(+11.1)#1,499 |
| 94. | Weaverville | 16.1% | 5.3%(+10.8)#94 | 5.1%(+11.1)#1,503 |
| 95. | Planada | 16.1% | 5.3%(+10.8)#95 | 5.1%(+11.1)#1,505 |
| 96. | Cassel | 15.9% | 5.3%(+10.6)#96 | 5.1%(+10.9)#1,542 |
| 97. | Fort Irwin | 15.9% | 5.3%(+10.5)#97 | 5.1%(+10.8)#1,552 |
| 98. | Mount Hermon | 15.6% | 5.3%(+10.2)#98 | 5.1%(+10.5)#1,597 |
| 99. | Winton | 15.4% | 5.3%(+10.1)#99 | 5.1%(+10.4)#1,615 |
| 100. | Graton | 15.4% | 5.3%(+10.1)#100 | 5.1%(+10.4)#1,616 |
Common Questions
What are the Top 10 Cities with the Highest Percentage of Population with a Degree in Psychology in California?
Top 10 Cities with the Highest Percentage of Population with a Degree in Psychology in California are:
#1
100.0%
#2
100.0%
#3
84.6%
#4
68.2%
#5
65.9%
#6
63.2%
#7
55.5%
#8
52.8%
#9
50.4%
#10
50.0%
What city has the Highest Percentage of Population with a Degree in Psychology in California?
Edmundson Acres has the Highest Percentage of Population with a Degree in Psychology in California with 100.0%.
What is the Percentage of Population with a Degree in Psychology in the State of California?
Percentage of Population with a Degree in Psychology in California is 5.3%.
What is the Percentage of Population with a Degree in Psychology in the United States?
Percentage of Population with a Degree in Psychology in the United States is 5.1%.