Cities with the Most Immigrants from Azores in California
RELATED REPORTS & OPTIONS
Azores
California
Compare Cities
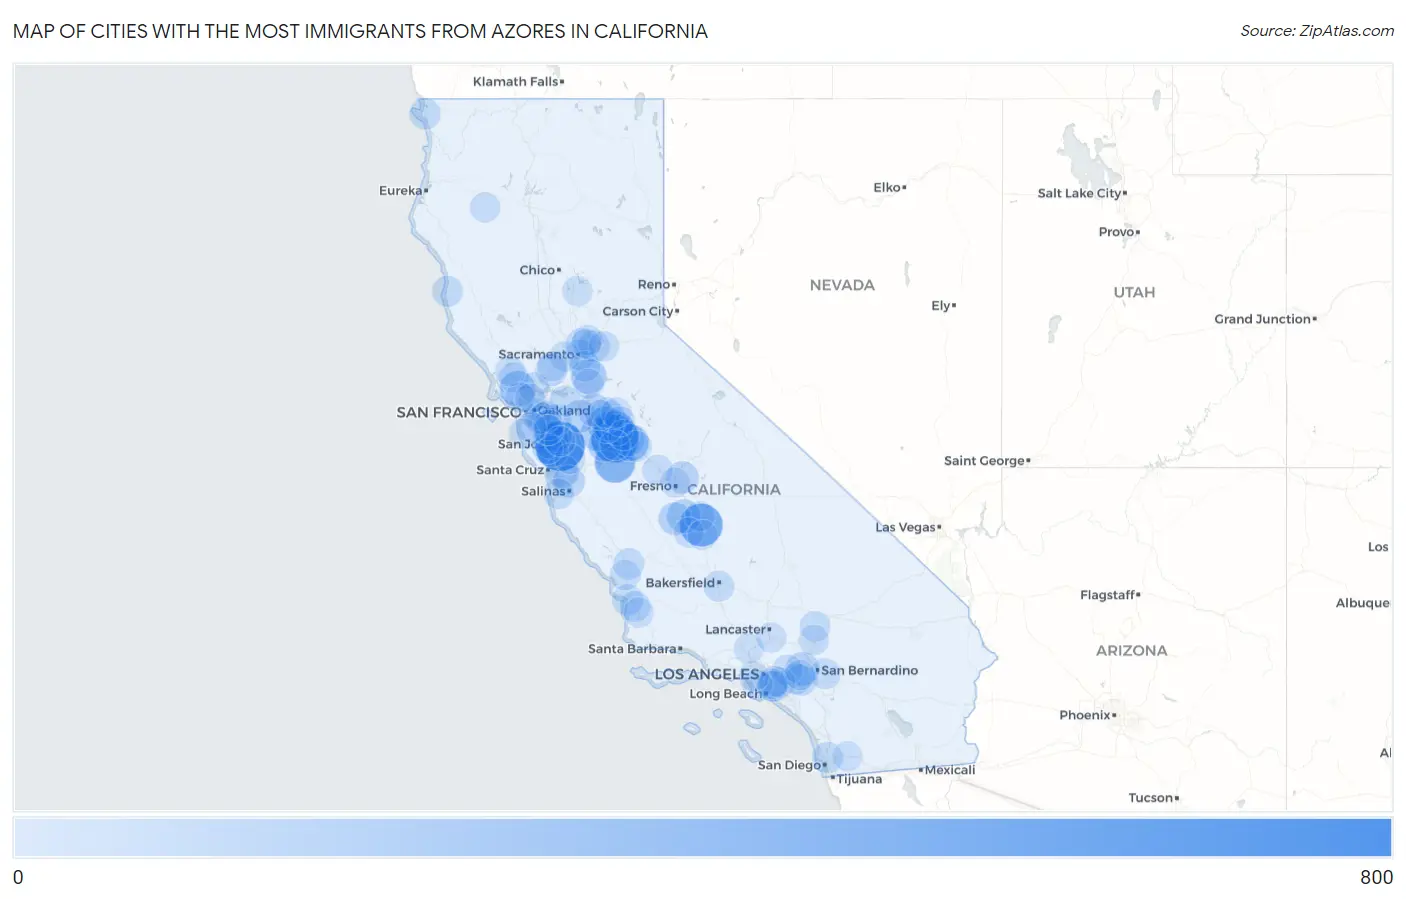
Map of Cities with the Most Immigrants from Azores in California
0
800
Cities with the Most Immigrants from Azores in California
| City | Azores | vs State | vs National | |
| 1. | San Jose | 663 | 8,659(7.66%)#1 | 25,748(2.57%)#4 |
| 2. | Hilmar Irwin | 592 | 8,659(6.84%)#2 | 25,748(2.30%)#5 |
| 3. | Tulare | 433 | 8,659(5.00%)#3 | 25,748(1.68%)#7 |
| 4. | Turlock | 361 | 8,659(4.17%)#4 | 25,748(1.40%)#9 |
| 5. | Los Banos | 349 | 8,659(4.03%)#5 | 25,748(1.36%)#10 |
| 6. | Atwater | 245 | 8,659(2.83%)#6 | 25,748(0.95%)#14 |
| 7. | Modesto | 228 | 8,659(2.63%)#7 | 25,748(0.89%)#16 |
| 8. | Novato | 201 | 8,659(2.32%)#8 | 25,748(0.78%)#17 |
| 9. | Santa Clara | 188 | 8,659(2.17%)#9 | 25,748(0.73%)#19 |
| 10. | Galt | 180 | 8,659(2.08%)#10 | 25,748(0.70%)#20 |
| 11. | Patterson | 145 | 8,659(1.67%)#11 | 25,748(0.56%)#23 |
| 12. | Hanford | 127 | 8,659(1.47%)#12 | 25,748(0.49%)#27 |
| 13. | Newman | 120 | 8,659(1.39%)#13 | 25,748(0.47%)#29 |
| 14. | Rancho Cucamonga | 114 | 8,659(1.32%)#14 | 25,748(0.44%)#30 |
| 15. | Franklin Cdp Merced County | 114 | 8,659(1.32%)#15 | 25,748(0.44%)#31 |
| 16. | Watsonville | 105 | 8,659(1.21%)#16 | 25,748(0.41%)#33 |
| 17. | Lemoore | 102 | 8,659(1.18%)#17 | 25,748(0.40%)#35 |
| 18. | Tracy | 97 | 8,659(1.12%)#18 | 25,748(0.38%)#36 |
| 19. | Manteca | 95 | 8,659(1.10%)#19 | 25,748(0.37%)#37 |
| 20. | Clovis | 88 | 8,659(1.02%)#20 | 25,748(0.34%)#38 |
| 21. | Winton | 84 | 8,659(0.97%)#21 | 25,748(0.33%)#42 |
| 22. | Prunedale | 77 | 8,659(0.89%)#22 | 25,748(0.30%)#46 |
| 23. | Vacaville | 72 | 8,659(0.83%)#23 | 25,748(0.28%)#49 |
| 24. | San Leandro | 66 | 8,659(0.76%)#24 | 25,748(0.26%)#50 |
| 25. | Orangevale | 60 | 8,659(0.69%)#25 | 25,748(0.23%)#51 |
| 26. | Eastvale | 57 | 8,659(0.66%)#26 | 25,748(0.22%)#53 |
| 27. | Cerritos | 53 | 8,659(0.61%)#27 | 25,748(0.21%)#54 |
| 28. | Crescent City | 49 | 8,659(0.57%)#28 | 25,748(0.19%)#58 |
| 29. | Chino | 48 | 8,659(0.55%)#29 | 25,748(0.19%)#59 |
| 30. | El Paso De Robles Paso Robles | 47 | 8,659(0.54%)#30 | 25,748(0.18%)#60 |
| 31. | Milpitas | 46 | 8,659(0.53%)#31 | 25,748(0.18%)#62 |
| 32. | Cherryland | 45 | 8,659(0.52%)#32 | 25,748(0.17%)#63 |
| 33. | Sacramento | 44 | 8,659(0.51%)#33 | 25,748(0.17%)#65 |
| 34. | Fort Bragg | 44 | 8,659(0.51%)#34 | 25,748(0.17%)#68 |
| 35. | Pleasanton | 42 | 8,659(0.49%)#35 | 25,748(0.16%)#71 |
| 36. | Brentwood | 42 | 8,659(0.49%)#36 | 25,748(0.16%)#72 |
| 37. | Grover Beach | 42 | 8,659(0.49%)#37 | 25,748(0.16%)#73 |
| 38. | San Diego | 40 | 8,659(0.46%)#38 | 25,748(0.16%)#75 |
| 39. | Merced | 40 | 8,659(0.46%)#39 | 25,748(0.16%)#76 |
| 40. | Los Gatos | 40 | 8,659(0.46%)#40 | 25,748(0.16%)#77 |
| 41. | Elverta | 38 | 8,659(0.44%)#41 | 25,748(0.15%)#82 |
| 42. | Oakland | 36 | 8,659(0.42%)#42 | 25,748(0.14%)#84 |
| 43. | Ceres | 36 | 8,659(0.42%)#43 | 25,748(0.14%)#85 |
| 44. | Newark | 35 | 8,659(0.40%)#44 | 25,748(0.14%)#86 |
| 45. | Castro Valley | 33 | 8,659(0.38%)#45 | 25,748(0.13%)#89 |
| 46. | Elk Grove | 32 | 8,659(0.37%)#46 | 25,748(0.12%)#91 |
| 47. | Redlands | 31 | 8,659(0.36%)#47 | 25,748(0.12%)#92 |
| 48. | Denair | 31 | 8,659(0.36%)#48 | 25,748(0.12%)#93 |
| 49. | Bakersfield | 30 | 8,659(0.35%)#49 | 25,748(0.12%)#94 |
| 50. | Nipomo | 30 | 8,659(0.35%)#50 | 25,748(0.12%)#96 |
| 51. | Seaside | 29 | 8,659(0.33%)#51 | 25,748(0.11%)#97 |
| 52. | Cowan | 29 | 8,659(0.33%)#52 | 25,748(0.11%)#99 |
| 53. | Madera | 28 | 8,659(0.32%)#53 | 25,748(0.11%)#100 |
| 54. | Silver Lakes | 28 | 8,659(0.32%)#54 | 25,748(0.11%)#102 |
| 55. | San Dimas | 27 | 8,659(0.31%)#55 | 25,748(0.10%)#103 |
| 56. | Union City | 26 | 8,659(0.30%)#56 | 25,748(0.10%)#108 |
| 57. | Riverbank | 26 | 8,659(0.30%)#57 | 25,748(0.10%)#110 |
| 58. | Petaluma | 25 | 8,659(0.29%)#58 | 25,748(0.10%)#112 |
| 59. | Atascadero | 25 | 8,659(0.29%)#59 | 25,748(0.10%)#114 |
| 60. | Vallejo | 24 | 8,659(0.28%)#60 | 25,748(0.09%)#115 |
| 61. | La Habra | 24 | 8,659(0.28%)#61 | 25,748(0.09%)#116 |
| 62. | South Whittier | 24 | 8,659(0.28%)#62 | 25,748(0.09%)#117 |
| 63. | Morgan Hill | 24 | 8,659(0.28%)#63 | 25,748(0.09%)#118 |
| 64. | Roseville | 23 | 8,659(0.27%)#64 | 25,748(0.09%)#120 |
| 65. | Victorville | 23 | 8,659(0.27%)#65 | 25,748(0.09%)#121 |
| 66. | Artesia | 23 | 8,659(0.27%)#66 | 25,748(0.09%)#123 |
| 67. | Half Moon Bay | 23 | 8,659(0.27%)#67 | 25,748(0.09%)#124 |
| 68. | Saratoga | 22 | 8,659(0.25%)#68 | 25,748(0.09%)#127 |
| 69. | Bayview Cdp Humboldt County | 22 | 8,659(0.25%)#69 | 25,748(0.09%)#128 |
| 70. | Escalon | 21 | 8,659(0.24%)#70 | 25,748(0.08%)#129 |
| 71. | Ballico | 21 | 8,659(0.24%)#71 | 25,748(0.08%)#130 |
| 72. | Ontario | 20 | 8,659(0.23%)#72 | 25,748(0.08%)#131 |
| 73. | Davis | 20 | 8,659(0.23%)#73 | 25,748(0.08%)#132 |
| 74. | Hayfork | 20 | 8,659(0.23%)#74 | 25,748(0.08%)#134 |
| 75. | Ripon | 19 | 8,659(0.22%)#75 | 25,748(0.07%)#137 |
| 76. | Norwalk | 18 | 8,659(0.21%)#76 | 25,748(0.07%)#138 |
| 77. | El Dorado Hills | 17 | 8,659(0.20%)#77 | 25,748(0.07%)#147 |
| 78. | Fremont | 16 | 8,659(0.18%)#78 | 25,748(0.06%)#150 |
| 79. | San Rafael | 16 | 8,659(0.18%)#79 | 25,748(0.06%)#151 |
| 80. | Oakdale | 16 | 8,659(0.18%)#80 | 25,748(0.06%)#153 |
| 81. | Richmond | 15 | 8,659(0.17%)#81 | 25,748(0.06%)#154 |
| 82. | Santa Maria | 15 | 8,659(0.17%)#82 | 25,748(0.06%)#155 |
| 83. | Alondra Park | 15 | 8,659(0.17%)#83 | 25,748(0.06%)#161 |
| 84. | Palermo | 15 | 8,659(0.17%)#84 | 25,748(0.06%)#163 |
| 85. | San Mateo | 14 | 8,659(0.16%)#85 | 25,748(0.05%)#165 |
| 86. | Alum Rock | 14 | 8,659(0.16%)#86 | 25,748(0.05%)#168 |
| 87. | Woodbridge | 14 | 8,659(0.16%)#87 | 25,748(0.05%)#170 |
| 88. | Los Angeles | 13 | 8,659(0.15%)#88 | 25,748(0.05%)#172 |
| 89. | Santa Clarita | 13 | 8,659(0.15%)#89 | 25,748(0.05%)#173 |
| 90. | Visalia | 13 | 8,659(0.15%)#90 | 25,748(0.05%)#175 |
| 91. | Rohnert Park | 13 | 8,659(0.15%)#91 | 25,748(0.05%)#177 |
| 92. | Corcoran | 13 | 8,659(0.15%)#92 | 25,748(0.05%)#178 |
| 93. | Tipton | 13 | 8,659(0.15%)#93 | 25,748(0.05%)#183 |
| 94. | Fresno | 12 | 8,659(0.14%)#94 | 25,748(0.05%)#184 |
| 95. | Antelope | 12 | 8,659(0.14%)#95 | 25,748(0.05%)#187 |
| 96. | Alpine | 12 | 8,659(0.14%)#96 | 25,748(0.05%)#191 |
| 97. | Waterford | 12 | 8,659(0.14%)#97 | 25,748(0.05%)#192 |
| 98. | Hartley | 12 | 8,659(0.14%)#98 | 25,748(0.05%)#194 |
| 99. | Stevinson | 12 | 8,659(0.14%)#99 | 25,748(0.05%)#195 |
| 100. | Palmdale | 11 | 8,659(0.13%)#100 | 25,748(0.04%)#197 |
Common Questions
What are the Top 10 Cities with the Most Immigrants from Azores in California?
Top 10 Cities with the Most Immigrants from Azores in California are:
#1
663
#2
592
#3
433
#4
361
#5
349
#6
245
#7
228
#8
201
#9
188
#10
180
What city has the Most Immigrants from Azores in California?
San Jose has the Most Immigrants from Azores in California with 663.
What is the Total Immigrants from Azores in the State of California?
Total Immigrants from Azores in California is 8,659.
What is the Total Immigrants from Azores in the United States?
Total Immigrants from Azores in the United States is 25,748.