Cities with the Highest Percentage of Population Employed in Construction in California
RELATED REPORTS & OPTIONS
Construction
California
Compare Cities
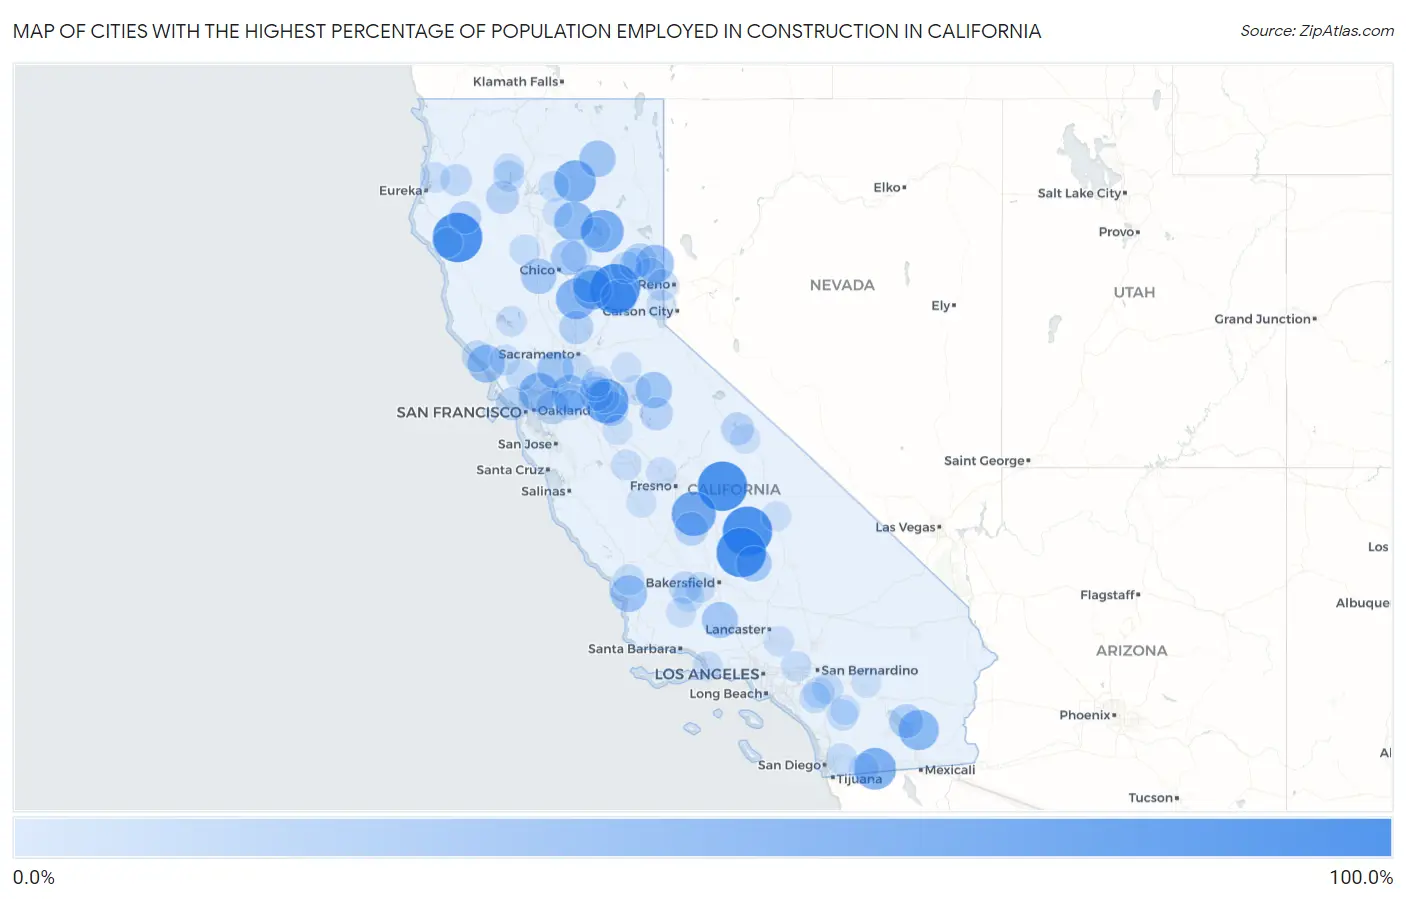
Map of Cities with the Highest Percentage of Population Employed in Construction in California
0.0%
100.0%
Cities with the Highest Percentage of Population Employed in Construction in California
| City | % Employed | vs State | vs National | |
| 1. | Alderpoint | 100.0% | 6.7%(+93.3)#1 | 6.9%(+93.1)#12 |
| 2. | Alleghany | 100.0% | 6.7%(+93.3)#2 | 6.9%(+93.1)#18 |
| 3. | Ponderosa | 100.0% | 6.7%(+93.3)#3 | 6.9%(+93.1)#21 |
| 4. | Panorama Heights | 100.0% | 6.7%(+93.3)#4 | 6.9%(+93.1)#24 |
| 5. | Wilsonia | 100.0% | 6.7%(+93.3)#5 | 6.9%(+93.1)#29 |
| 6. | Choctaw Valley | 82.8% | 6.7%(+76.1)#6 | 6.9%(+75.9)#54 |
| 7. | West Goshen | 77.6% | 6.7%(+71.0)#7 | 6.9%(+70.8)#69 |
| 8. | Farmington | 77.6% | 6.7%(+70.9)#8 | 6.9%(+70.8)#70 |
| 9. | Yosemite West | 71.4% | 6.7%(+64.7)#9 | 6.9%(+64.6)#84 |
| 10. | East Shore | 70.6% | 6.7%(+63.9)#10 | 6.9%(+63.7)#86 |
| 11. | Boulevard | 67.6% | 6.7%(+60.9)#11 | 6.9%(+60.7)#96 |
| 12. | Cassel | 67.4% | 6.7%(+60.8)#12 | 6.9%(+60.6)#97 |
| 13. | Honcut | 62.5% | 6.7%(+55.8)#13 | 6.9%(+55.6)#118 |
| 14. | Niland | 60.3% | 6.7%(+53.6)#14 | 6.9%(+53.4)#133 |
| 15. | Port Costa | 57.2% | 6.7%(+50.6)#15 | 6.9%(+50.4)#150 |
| 16. | Challenge Brownsville | 56.6% | 6.7%(+49.9)#16 | 6.9%(+49.7)#157 |
| 17. | Mineral | 56.2% | 6.7%(+49.6)#17 | 6.9%(+49.4)#161 |
| 18. | Chilcoot Vinton | 51.3% | 6.7%(+44.6)#18 | 6.9%(+44.4)#199 |
| 19. | Forbestown | 50.0% | 6.7%(+43.3)#19 | 6.9%(+43.1)#209 |
| 20. | Kep'el | 50.0% | 6.7%(+43.3)#20 | 6.9%(+43.1)#222 |
| 21. | Jenner | 50.0% | 6.7%(+43.3)#21 | 6.9%(+43.1)#225 |
| 22. | Bethel Island | 48.5% | 6.7%(+41.8)#22 | 6.9%(+41.6)#235 |
| 23. | Edna | 46.1% | 6.7%(+39.4)#23 | 6.9%(+39.2)#260 |
| 24. | Elmira | 45.4% | 6.7%(+38.7)#24 | 6.9%(+38.5)#271 |
| 25. | Lookout | 44.4% | 6.7%(+37.8)#25 | 6.9%(+37.6)#285 |
| 26. | Sierra Village | 44.2% | 6.7%(+37.5)#26 | 6.9%(+37.4)#289 |
| 27. | Lake Of The Woods | 43.4% | 6.7%(+36.7)#27 | 6.9%(+36.5)#297 |
| 28. | Washington | 42.1% | 6.7%(+35.4)#28 | 6.9%(+35.2)#317 |
| 29. | Mountain Mesa | 41.7% | 6.7%(+35.0)#29 | 6.9%(+34.8)#323 |
| 30. | Forest Ranch | 40.8% | 6.7%(+34.1)#30 | 6.9%(+33.9)#340 |
| 31. | Artois | 40.5% | 6.7%(+33.8)#31 | 6.9%(+33.6)#341 |
| 32. | Olde Stockdale | 38.3% | 6.7%(+31.6)#32 | 6.9%(+31.5)#401 |
| 33. | Valley Home | 37.3% | 6.7%(+30.6)#33 | 6.9%(+30.4)#438 |
| 34. | Waterloo | 36.9% | 6.7%(+30.2)#34 | 6.9%(+30.0)#451 |
| 35. | Castella | 35.2% | 6.7%(+28.5)#35 | 6.9%(+28.4)#505 |
| 36. | Bombay Beach | 35.0% | 6.7%(+28.3)#36 | 6.9%(+28.1)#513 |
| 37. | Spring Valley Cdp Lake County | 34.3% | 6.7%(+27.6)#37 | 6.9%(+27.4)#539 |
| 38. | Rio Oso | 34.0% | 6.7%(+27.3)#38 | 6.9%(+27.1)#547 |
| 39. | Waukena | 33.3% | 6.7%(+26.6)#39 | 6.9%(+26.5)#578 |
| 40. | Beckwourth | 33.2% | 6.7%(+26.5)#40 | 6.9%(+26.3)#596 |
| 41. | Diablo | 33.1% | 6.7%(+26.4)#41 | 6.9%(+26.2)#600 |
| 42. | Greeley Hill | 31.8% | 6.7%(+25.1)#42 | 6.9%(+24.9)#650 |
| 43. | Stinson Beach | 31.7% | 6.7%(+25.0)#43 | 6.9%(+24.9)#655 |
| 44. | Lewiston | 31.4% | 6.7%(+24.7)#44 | 6.9%(+24.5)#671 |
| 45. | Aspen Springs | 30.3% | 6.7%(+23.7)#45 | 6.9%(+23.5)#725 |
| 46. | Mad River | 29.9% | 6.7%(+23.2)#46 | 6.9%(+23.0)#755 |
| 47. | Woody | 29.8% | 6.7%(+23.1)#47 | 6.9%(+22.9)#757 |
| 48. | Mckittrick | 27.5% | 6.7%(+20.8)#48 | 6.9%(+20.6)#921 |
| 49. | Loyalton | 26.8% | 6.7%(+20.1)#49 | 6.9%(+19.9)#990 |
| 50. | Graeagle | 26.7% | 6.7%(+20.0)#50 | 6.9%(+19.8)#996 |
| 51. | Verdi | 25.9% | 6.7%(+19.2)#51 | 6.9%(+19.0)#1,050 |
| 52. | Timber Cove | 25.9% | 6.7%(+19.2)#52 | 6.9%(+19.0)#1,052 |
| 53. | Willow Creek | 25.5% | 6.7%(+18.8)#53 | 6.9%(+18.6)#1,084 |
| 54. | Peters | 25.4% | 6.7%(+18.7)#54 | 6.9%(+18.5)#1,092 |
| 55. | Ono | 25.0% | 6.7%(+18.3)#55 | 6.9%(+18.1)#1,147 |
| 56. | Delleker | 24.6% | 6.7%(+17.9)#56 | 6.9%(+17.8)#1,167 |
| 57. | Garden Farms | 24.5% | 6.7%(+17.8)#57 | 6.9%(+17.6)#1,181 |
| 58. | Trinity Center | 24.4% | 6.7%(+17.7)#58 | 6.9%(+17.5)#1,189 |
| 59. | Aguanga | 24.2% | 6.7%(+17.5)#59 | 6.9%(+17.3)#1,218 |
| 60. | Fellows | 24.0% | 6.7%(+17.3)#60 | 6.9%(+17.1)#1,244 |
| 61. | El Verano | 23.9% | 6.7%(+17.2)#61 | 6.9%(+17.0)#1,255 |
| 62. | Good Hope | 23.7% | 6.7%(+17.0)#62 | 6.9%(+16.8)#1,284 |
| 63. | Knightsen | 23.4% | 6.7%(+16.7)#63 | 6.9%(+16.5)#1,336 |
| 64. | Crest | 23.3% | 6.7%(+16.6)#64 | 6.9%(+16.4)#1,349 |
| 65. | Stirling City | 23.3% | 6.7%(+16.6)#65 | 6.9%(+16.4)#1,350 |
| 66. | Lakeview | 23.3% | 6.7%(+16.6)#66 | 6.9%(+16.4)#1,354 |
| 67. | Rancho Tehama Reserve | 23.2% | 6.7%(+16.5)#67 | 6.9%(+16.3)#1,359 |
| 68. | Hood | 22.9% | 6.7%(+16.2)#68 | 6.9%(+16.0)#1,404 |
| 69. | Warm Springs | 22.7% | 6.7%(+16.0)#69 | 6.9%(+15.9)#1,430 |
| 70. | Montgomery Creek | 22.7% | 6.7%(+16.0)#70 | 6.9%(+15.9)#1,433 |
| 71. | Sage | 22.6% | 6.7%(+15.9)#71 | 6.9%(+15.8)#1,451 |
| 72. | Campo | 22.5% | 6.7%(+15.8)#72 | 6.9%(+15.6)#1,474 |
| 73. | Lake Almanor West | 22.4% | 6.7%(+15.7)#73 | 6.9%(+15.5)#1,490 |
| 74. | Casa Loma | 22.3% | 6.7%(+15.6)#74 | 6.9%(+15.4)#1,500 |
| 75. | Dos Palos Y | 22.2% | 6.7%(+15.5)#75 | 6.9%(+15.3)#1,510 |
| 76. | Coffee Creek | 22.1% | 6.7%(+15.4)#76 | 6.9%(+15.2)#1,530 |
| 77. | Clearlake Oaks | 21.9% | 6.7%(+15.2)#77 | 6.9%(+15.0)#1,564 |
| 78. | Fulton | 21.8% | 6.7%(+15.1)#78 | 6.9%(+15.0)#1,567 |
| 79. | San Antonio Heights | 21.6% | 6.7%(+14.9)#79 | 6.9%(+14.7)#1,622 |
| 80. | Dogtown | 21.5% | 6.7%(+14.8)#80 | 6.9%(+14.6)#1,628 |
| 81. | Tupman | 21.4% | 6.7%(+14.7)#81 | 6.9%(+14.6)#1,635 |
| 82. | Fieldbrook | 21.4% | 6.7%(+14.7)#82 | 6.9%(+14.5)#1,649 |
| 83. | Byron | 21.3% | 6.7%(+14.6)#83 | 6.9%(+14.4)#1,655 |
| 84. | Littlerock | 21.2% | 6.7%(+14.5)#84 | 6.9%(+14.3)#1,672 |
| 85. | Jones Valley | 21.0% | 6.7%(+14.3)#85 | 6.9%(+14.1)#1,704 |
| 86. | Parkwood | 20.9% | 6.7%(+14.2)#86 | 6.9%(+14.1)#1,712 |
| 87. | Vallecito | 20.8% | 6.7%(+14.1)#87 | 6.9%(+14.0)#1,732 |
| 88. | Kings Beach | 20.3% | 6.7%(+13.6)#88 | 6.9%(+13.4)#1,829 |
| 89. | Channel Islands Beach | 20.2% | 6.7%(+13.5)#89 | 6.9%(+13.3)#1,852 |
| 90. | Three Rocks | 20.0% | 6.7%(+13.3)#90 | 6.9%(+13.1)#1,887 |
| 91. | Cartago | 20.0% | 6.7%(+13.3)#91 | 6.9%(+13.1)#1,899 |
| 92. | Pine Grove | 20.0% | 6.7%(+13.3)#92 | 6.9%(+13.1)#1,915 |
| 93. | Garberville | 19.9% | 6.7%(+13.2)#93 | 6.9%(+13.0)#1,920 |
| 94. | New Cuyama | 19.8% | 6.7%(+13.1)#94 | 6.9%(+13.0)#1,933 |
| 95. | Victor | 19.7% | 6.7%(+13.0)#95 | 6.9%(+12.9)#1,956 |
| 96. | Desert Edge | 19.6% | 6.7%(+13.0)#96 | 6.9%(+12.8)#1,985 |
| 97. | Denair | 19.6% | 6.7%(+12.9)#97 | 6.9%(+12.7)#1,993 |
| 98. | Shingletown | 19.5% | 6.7%(+12.8)#98 | 6.9%(+12.6)#2,014 |
| 99. | Round Valley | 19.4% | 6.7%(+12.7)#99 | 6.9%(+12.5)#2,044 |
| 100. | Lake Riverside | 19.4% | 6.7%(+12.7)#100 | 6.9%(+12.5)#2,048 |
Common Questions
What are the Top 10 Cities with the Highest Percentage of Population Employed in Construction in California?
Top 10 Cities with the Highest Percentage of Population Employed in Construction in California are:
#1
100.0%
#2
100.0%
#3
100.0%
#4
100.0%
#5
100.0%
#6
77.6%
#7
77.6%
#8
70.6%
#9
67.6%
#10
67.4%
What city has the Highest Percentage of Population Employed in Construction in California?
Alderpoint has the Highest Percentage of Population Employed in Construction in California with 100.0%.
What is the Percentage of Population Employed in Construction in the State of California?
Percentage of Population Employed in Construction in California is 6.7%.
What is the Percentage of Population Employed in Construction in the United States?
Percentage of Population Employed in Construction in the United States is 6.9%.