Cities with the Most Immigrants from Mexico in California
RELATED REPORTS & OPTIONS
Mexico
California
Compare Cities
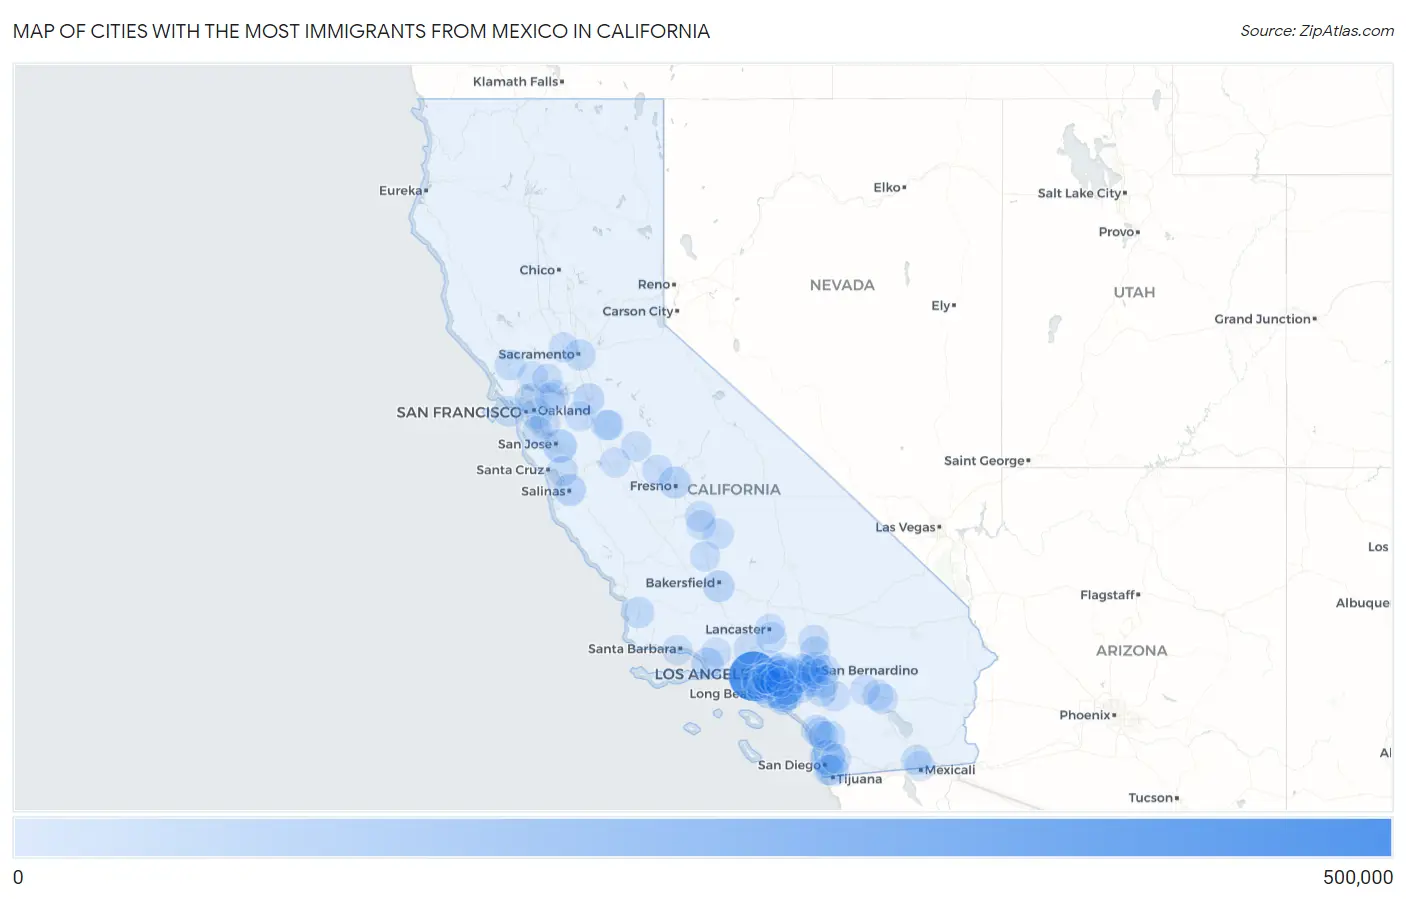
Map of Cities with the Most Immigrants from Mexico in California
0
500,000
Cities with the Most Immigrants from Mexico in California
| City | Mexico | vs State | vs National | |
| 1. | Los Angeles | 450,825 | 3,881,193(11.62%)#1 | 10,767,104(4.19%)#1 |
| 2. | San Diego | 110,404 | 3,881,193(2.84%)#2 | 10,767,104(1.03%)#9 |
| 3. | Santa Ana | 90,086 | 3,881,193(2.32%)#3 | 10,767,104(0.84%)#10 |
| 4. | San Jose | 84,963 | 3,881,193(2.19%)#4 | 10,767,104(0.79%)#11 |
| 5. | Anaheim | 57,566 | 3,881,193(1.48%)#5 | 10,767,104(0.53%)#14 |
| 6. | Oxnard | 53,460 | 3,881,193(1.38%)#6 | 10,767,104(0.50%)#17 |
| 7. | Long Beach | 52,140 | 3,881,193(1.34%)#7 | 10,767,104(0.48%)#18 |
| 8. | Chula Vista | 50,141 | 3,881,193(1.29%)#8 | 10,767,104(0.47%)#19 |
| 9. | Salinas | 49,073 | 3,881,193(1.26%)#9 | 10,767,104(0.46%)#20 |
| 10. | Fresno | 48,849 | 3,881,193(1.26%)#10 | 10,767,104(0.45%)#21 |
| 11. | Bakersfield | 42,912 | 3,881,193(1.11%)#11 | 10,767,104(0.40%)#25 |
| 12. | East Los Angeles | 38,631 | 3,881,193(1.00%)#12 | 10,767,104(0.36%)#26 |
| 13. | Riverside | 38,263 | 3,881,193(0.99%)#13 | 10,767,104(0.36%)#27 |
| 14. | Fontana | 36,162 | 3,881,193(0.93%)#14 | 10,767,104(0.34%)#28 |
| 15. | Stockton | 35,890 | 3,881,193(0.92%)#15 | 10,767,104(0.33%)#29 |
| 16. | Moreno Valley | 34,177 | 3,881,193(0.88%)#16 | 10,767,104(0.32%)#31 |
| 17. | San Bernardino | 33,766 | 3,881,193(0.87%)#17 | 10,767,104(0.31%)#32 |
| 18. | Ontario | 31,089 | 3,881,193(0.80%)#18 | 10,767,104(0.29%)#38 |
| 19. | Pomona | 30,525 | 3,881,193(0.79%)#19 | 10,767,104(0.28%)#40 |
| 20. | South Gate | 30,228 | 3,881,193(0.78%)#20 | 10,767,104(0.28%)#41 |
| 21. | Sacramento | 30,114 | 3,881,193(0.78%)#21 | 10,767,104(0.28%)#42 |
| 22. | Santa Maria | 29,811 | 3,881,193(0.77%)#22 | 10,767,104(0.28%)#44 |
| 23. | Oakland | 29,632 | 3,881,193(0.76%)#23 | 10,767,104(0.28%)#45 |
| 24. | Escondido | 28,104 | 3,881,193(0.72%)#24 | 10,767,104(0.26%)#49 |
| 25. | El Monte | 24,743 | 3,881,193(0.64%)#25 | 10,767,104(0.23%)#53 |
| 26. | Jurupa Valley | 22,607 | 3,881,193(0.58%)#26 | 10,767,104(0.21%)#57 |
| 27. | Compton | 22,027 | 3,881,193(0.57%)#27 | 10,767,104(0.20%)#58 |
| 28. | Santa Rosa | 21,083 | 3,881,193(0.54%)#28 | 10,767,104(0.20%)#62 |
| 29. | San Francisco | 20,457 | 3,881,193(0.53%)#29 | 10,767,104(0.19%)#64 |
| 30. | Palmdale | 20,081 | 3,881,193(0.52%)#30 | 10,767,104(0.19%)#65 |
| 31. | Modesto | 19,991 | 3,881,193(0.52%)#31 | 10,767,104(0.19%)#66 |
| 32. | Garden Grove | 19,384 | 3,881,193(0.50%)#32 | 10,767,104(0.18%)#68 |
| 33. | Lynwood | 19,184 | 3,881,193(0.49%)#33 | 10,767,104(0.18%)#69 |
| 34. | Rialto | 19,103 | 3,881,193(0.49%)#34 | 10,767,104(0.18%)#70 |
| 35. | Downey | 19,072 | 3,881,193(0.49%)#35 | 10,767,104(0.18%)#71 |
| 36. | Huntington Park | 18,960 | 3,881,193(0.49%)#36 | 10,767,104(0.18%)#72 |
| 37. | Florence Graham | 18,804 | 3,881,193(0.48%)#37 | 10,767,104(0.17%)#73 |
| 38. | Perris | 18,367 | 3,881,193(0.47%)#38 | 10,767,104(0.17%)#75 |
| 39. | Hayward | 18,033 | 3,881,193(0.46%)#39 | 10,767,104(0.17%)#76 |
| 40. | Oceanside | 17,578 | 3,881,193(0.45%)#40 | 10,767,104(0.16%)#77 |
| 41. | Corona | 17,510 | 3,881,193(0.45%)#41 | 10,767,104(0.16%)#78 |
| 42. | Norwalk | 17,174 | 3,881,193(0.44%)#42 | 10,767,104(0.16%)#79 |
| 43. | Indio | 16,777 | 3,881,193(0.43%)#43 | 10,767,104(0.16%)#80 |
| 44. | Coachella | 16,597 | 3,881,193(0.43%)#44 | 10,767,104(0.15%)#82 |
| 45. | Baldwin Park | 16,434 | 3,881,193(0.42%)#45 | 10,767,104(0.15%)#85 |
| 46. | Watsonville | 16,394 | 3,881,193(0.42%)#46 | 10,767,104(0.15%)#86 |
| 47. | Inglewood | 16,319 | 3,881,193(0.42%)#47 | 10,767,104(0.15%)#87 |
| 48. | Madera | 16,243 | 3,881,193(0.42%)#48 | 10,767,104(0.15%)#90 |
| 49. | Vista | 16,198 | 3,881,193(0.42%)#49 | 10,767,104(0.15%)#91 |
| 50. | Calexico | 15,944 | 3,881,193(0.41%)#50 | 10,767,104(0.15%)#93 |
| 51. | Victorville | 15,713 | 3,881,193(0.40%)#51 | 10,767,104(0.15%)#94 |
| 52. | Paramount | 14,778 | 3,881,193(0.38%)#52 | 10,767,104(0.14%)#99 |
| 53. | Pico Rivera | 14,256 | 3,881,193(0.37%)#53 | 10,767,104(0.13%)#102 |
| 54. | Porterville | 14,116 | 3,881,193(0.36%)#54 | 10,767,104(0.13%)#103 |
| 55. | Santa Clarita | 13,960 | 3,881,193(0.36%)#55 | 10,767,104(0.13%)#105 |
| 56. | Richmond | 13,889 | 3,881,193(0.36%)#56 | 10,767,104(0.13%)#106 |
| 57. | Merced | 13,812 | 3,881,193(0.36%)#57 | 10,767,104(0.13%)#107 |
| 58. | National City | 13,305 | 3,881,193(0.34%)#58 | 10,767,104(0.12%)#108 |
| 59. | Visalia | 13,128 | 3,881,193(0.34%)#59 | 10,767,104(0.12%)#109 |
| 60. | Bell Gardens | 13,056 | 3,881,193(0.34%)#60 | 10,767,104(0.12%)#110 |
| 61. | Hesperia | 12,577 | 3,881,193(0.32%)#61 | 10,767,104(0.12%)#114 |
| 62. | Hawthorne | 12,537 | 3,881,193(0.32%)#62 | 10,767,104(0.12%)#115 |
| 63. | Delano | 12,423 | 3,881,193(0.32%)#63 | 10,767,104(0.12%)#116 |
| 64. | Montebello | 12,401 | 3,881,193(0.32%)#64 | 10,767,104(0.12%)#117 |
| 65. | Bellflower | 12,098 | 3,881,193(0.31%)#65 | 10,767,104(0.11%)#119 |
| 66. | El Centro | 12,063 | 3,881,193(0.31%)#66 | 10,767,104(0.11%)#120 |
| 67. | Fullerton | 12,017 | 3,881,193(0.31%)#67 | 10,767,104(0.11%)#121 |
| 68. | Napa | 12,002 | 3,881,193(0.31%)#68 | 10,767,104(0.11%)#122 |
| 69. | Orange | 11,955 | 3,881,193(0.31%)#69 | 10,767,104(0.11%)#123 |
| 70. | Costa Mesa | 11,599 | 3,881,193(0.30%)#70 | 10,767,104(0.11%)#124 |
| 71. | Carson | 11,282 | 3,881,193(0.29%)#71 | 10,767,104(0.10%)#128 |
| 72. | San Marcos | 11,225 | 3,881,193(0.29%)#72 | 10,767,104(0.10%)#130 |
| 73. | Hemet | 11,196 | 3,881,193(0.29%)#73 | 10,767,104(0.10%)#131 |
| 74. | Pasadena | 11,066 | 3,881,193(0.29%)#74 | 10,767,104(0.10%)#132 |
| 75. | West Covina | 10,071 | 3,881,193(0.26%)#75 | 10,767,104(0.09%)#143 |
| 76. | Santa Barbara | 9,904 | 3,881,193(0.26%)#76 | 10,767,104(0.09%)#147 |
| 77. | Bell | 9,875 | 3,881,193(0.25%)#77 | 10,767,104(0.09%)#148 |
| 78. | Pittsburg | 9,691 | 3,881,193(0.25%)#78 | 10,767,104(0.09%)#150 |
| 79. | Concord | 9,688 | 3,881,193(0.25%)#79 | 10,767,104(0.09%)#151 |
| 80. | Los Banos | 9,680 | 3,881,193(0.25%)#80 | 10,767,104(0.09%)#152 |
| 81. | Ceres | 9,679 | 3,881,193(0.25%)#81 | 10,767,104(0.09%)#153 |
| 82. | Chino | 9,655 | 3,881,193(0.25%)#82 | 10,767,104(0.09%)#155 |
| 83. | Fairfield | 9,573 | 3,881,193(0.25%)#83 | 10,767,104(0.09%)#157 |
| 84. | Woodland | 9,563 | 3,881,193(0.25%)#84 | 10,767,104(0.09%)#159 |
| 85. | Maywood | 9,563 | 3,881,193(0.25%)#85 | 10,767,104(0.09%)#160 |
| 86. | South Whittier | 9,502 | 3,881,193(0.24%)#86 | 10,767,104(0.09%)#161 |
| 87. | Cathedral City | 9,215 | 3,881,193(0.24%)#87 | 10,767,104(0.09%)#163 |
| 88. | Tulare | 9,198 | 3,881,193(0.24%)#88 | 10,767,104(0.09%)#164 |
| 89. | La Puente | 8,988 | 3,881,193(0.23%)#89 | 10,767,104(0.08%)#166 |
| 90. | Rancho Cucamonga | 8,948 | 3,881,193(0.23%)#90 | 10,767,104(0.08%)#167 |
| 91. | Lancaster | 8,911 | 3,881,193(0.23%)#91 | 10,767,104(0.08%)#168 |
| 92. | El Cajon | 8,887 | 3,881,193(0.23%)#92 | 10,767,104(0.08%)#170 |
| 93. | Santa Paula | 8,770 | 3,881,193(0.23%)#93 | 10,767,104(0.08%)#173 |
| 94. | Tracy | 8,608 | 3,881,193(0.22%)#94 | 10,767,104(0.08%)#176 |
| 95. | Tustin | 8,429 | 3,881,193(0.22%)#95 | 10,767,104(0.08%)#177 |
| 96. | Azusa | 8,425 | 3,881,193(0.22%)#96 | 10,767,104(0.08%)#178 |
| 97. | Redwood City | 8,349 | 3,881,193(0.22%)#97 | 10,767,104(0.08%)#180 |
| 98. | La Habra | 8,114 | 3,881,193(0.21%)#98 | 10,767,104(0.08%)#181 |
| 99. | Colton | 7,987 | 3,881,193(0.21%)#99 | 10,767,104(0.07%)#184 |
| 100. | Highland | 7,970 | 3,881,193(0.21%)#100 | 10,767,104(0.07%)#185 |
Common Questions
What are the Top 10 Cities with the Most Immigrants from Mexico in California?
Top 10 Cities with the Most Immigrants from Mexico in California are:
#1
450,825
#2
110,404
#3
90,086
#4
84,963
#5
57,566
#6
53,460
#7
52,140
#8
50,141
#9
49,073
#10
48,849
What city has the Most Immigrants from Mexico in California?
Los Angeles has the Most Immigrants from Mexico in California with 450,825.
What is the Total Immigrants from Mexico in the State of California?
Total Immigrants from Mexico in California is 3,881,193.
What is the Total Immigrants from Mexico in the United States?
Total Immigrants from Mexico in the United States is 10,767,104.