Cities with the Fewest Births per 1,000 Teenage Women Under the Age of 20 in California
RELATED REPORTS & OPTIONS
Lowest Birth Rate | Women 15-19
California
Compare Cities
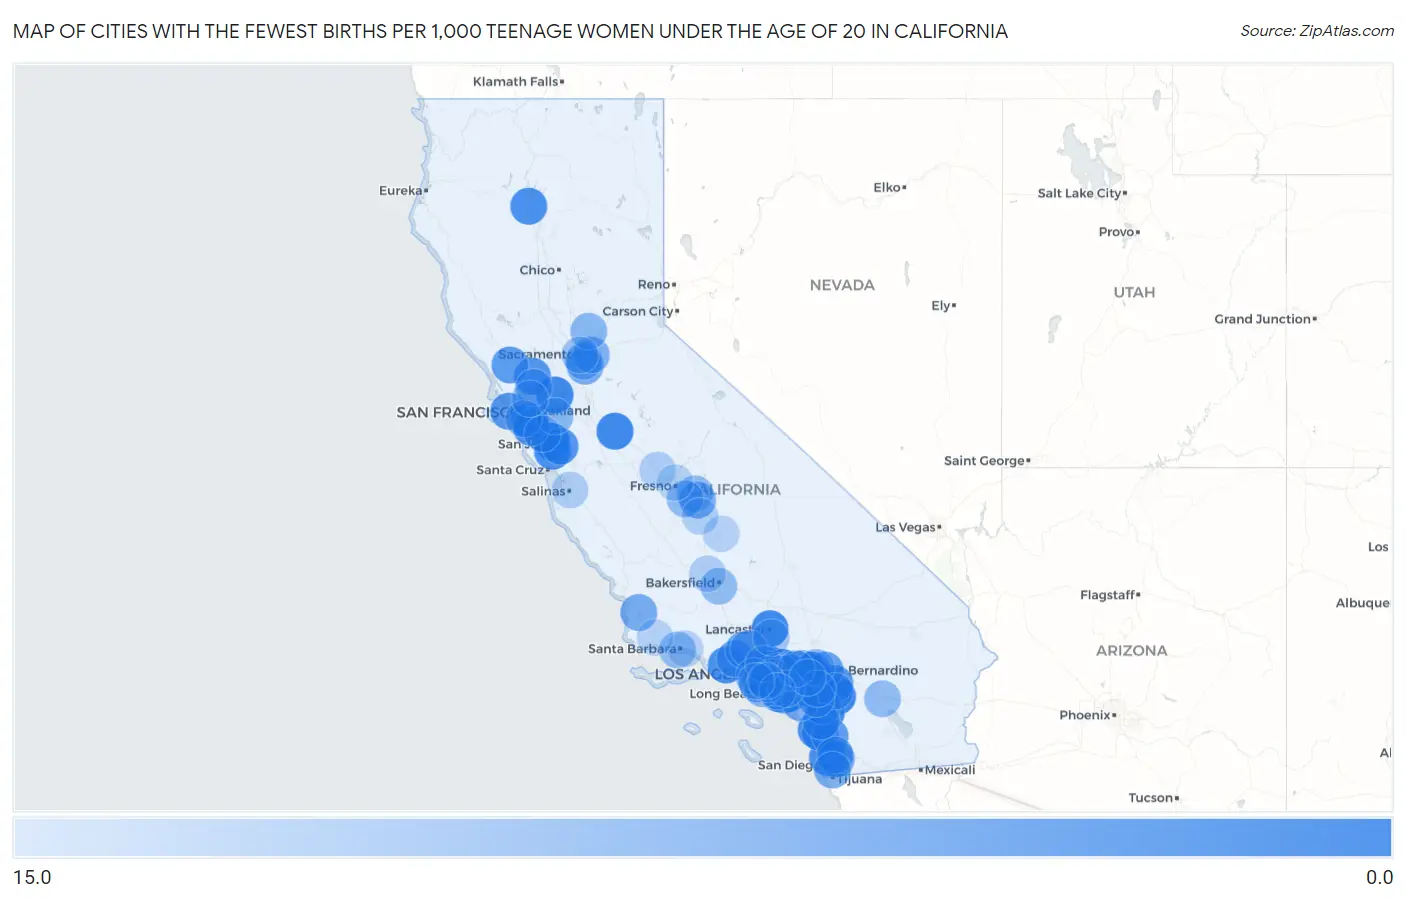
Map of Cities with the Fewest Births per 1,000 Teenage Women Under the Age of 20 in California
15.0
0.0
Cities with the Fewest Births per 1,000 Teenage Women Under the Age of 20 in California
| City | Births / 1,000 Women | vs State | vs National | |
| 1. | Fullerton | 1.0 | 7.0(-6.00)#1 | 10.0(-9.00)#4 |
| 2. | Pasadena | 1.0 | 7.0(-6.00)#2 | 10.0(-9.00)#5 |
| 3. | Santa Clara | 1.0 | 7.0(-6.00)#3 | 10.0(-9.00)#6 |
| 4. | South San Francisco | 1.0 | 7.0(-6.00)#4 | 10.0(-9.00)#14 |
| 5. | Covina | 1.0 | 7.0(-6.00)#5 | 10.0(-9.00)#16 |
| 6. | Azusa | 1.0 | 7.0(-6.00)#6 | 10.0(-9.00)#17 |
| 7. | South Pasadena | 1.0 | 7.0(-6.00)#7 | 10.0(-9.00)#22 |
| 8. | Bloomington | 1.0 | 7.0(-6.00)#8 | 10.0(-9.00)#23 |
| 9. | East Hemet | 1.0 | 7.0(-6.00)#9 | 10.0(-9.00)#25 |
| 10. | Santa Ana | 2.0 | 7.0(-5.00)#10 | 10.0(-8.00)#28 |
| 11. | Moreno Valley | 2.0 | 7.0(-5.00)#11 | 10.0(-8.00)#30 |
| 12. | Oceanside | 2.0 | 7.0(-5.00)#12 | 10.0(-8.00)#33 |
| 13. | Lancaster | 2.0 | 7.0(-5.00)#13 | 10.0(-8.00)#34 |
| 14. | Temecula | 2.0 | 7.0(-5.00)#14 | 10.0(-8.00)#38 |
| 15. | El Monte | 2.0 | 7.0(-5.00)#15 | 10.0(-8.00)#39 |
| 16. | Menifee | 2.0 | 7.0(-5.00)#16 | 10.0(-8.00)#40 |
| 17. | Pittsburg | 2.0 | 7.0(-5.00)#17 | 10.0(-8.00)#42 |
| 18. | Turlock | 2.0 | 7.0(-5.00)#18 | 10.0(-8.00)#44 |
| 19. | North Tustin | 2.0 | 7.0(-5.00)#19 | 10.0(-8.00)#52 |
| 20. | San Diego | 3.0 | 7.0(-4.00)#20 | 10.0(-7.00)#56 |
| 21. | Thousand Oaks | 3.0 | 7.0(-4.00)#21 | 10.0(-7.00)#63 |
| 22. | East Los Angeles | 3.0 | 7.0(-4.00)#22 | 10.0(-7.00)#66 |
| 23. | Vista | 3.0 | 7.0(-4.00)#23 | 10.0(-7.00)#70 |
| 24. | Redding | 3.0 | 7.0(-4.00)#24 | 10.0(-7.00)#72 |
| 25. | Los Gatos | 3.0 | 7.0(-4.00)#25 | 10.0(-7.00)#80 |
| 26. | San Jose | 4.0 | 7.0(-3.00)#26 | 10.0(-6.00)#87 |
| 27. | San Francisco | 4.0 | 7.0(-3.00)#27 | 10.0(-6.00)#88 |
| 28. | Ontario | 4.0 | 7.0(-3.00)#28 | 10.0(-6.00)#97 |
| 29. | Rancho Cucamonga | 4.0 | 7.0(-3.00)#29 | 10.0(-6.00)#98 |
| 30. | Garden Grove | 4.0 | 7.0(-3.00)#30 | 10.0(-6.00)#99 |
| 31. | San Mateo | 4.0 | 7.0(-3.00)#31 | 10.0(-6.00)#113 |
| 32. | Napa | 4.0 | 7.0(-3.00)#32 | 10.0(-6.00)#117 |
| 33. | Baldwin Park | 4.0 | 7.0(-3.00)#33 | 10.0(-6.00)#120 |
| 34. | Eastvale | 4.0 | 7.0(-3.00)#34 | 10.0(-6.00)#122 |
| 35. | Beaumont | 4.0 | 7.0(-3.00)#35 | 10.0(-6.00)#128 |
| 36. | Santa Rosa | 5.0 | 7.0(-2.00)#36 | 10.0(-5.00)#145 |
| 37. | Corona | 5.0 | 7.0(-2.00)#37 | 10.0(-5.00)#148 |
| 38. | Escondido | 5.0 | 7.0(-2.00)#38 | 10.0(-5.00)#150 |
| 39. | Hawthorne | 5.0 | 7.0(-2.00)#39 | 10.0(-5.00)#160 |
| 40. | Hacienda Heights | 5.0 | 7.0(-2.00)#40 | 10.0(-5.00)#167 |
| 41. | Simi Valley | 6.0 | 7.0(-1.000)#41 | 10.0(-4.00)#192 |
| 42. | El Cajon | 6.0 | 7.0(-1.000)#42 | 10.0(-4.00)#194 |
| 43. | Norwalk | 6.0 | 7.0(-1.000)#43 | 10.0(-4.00)#195 |
| 44. | Highland | 6.0 | 7.0(-1.000)#44 | 10.0(-4.00)#206 |
| 45. | Stevenson Ranch | 6.0 | 7.0(-1.000)#45 | 10.0(-4.00)#214 |
| 46. | Fontana | 7.0 | 7.0(=0.000)#46 | 10.0(-3.00)#224 |
| 47. | Vallejo | 7.0 | 7.0(=0.000)#47 | 10.0(-3.00)#230 |
| 48. | Buena Park | 7.0 | 7.0(=0.000)#48 | 10.0(-3.00)#236 |
| 49. | Santee | 7.0 | 7.0(=0.000)#49 | 10.0(-3.00)#241 |
| 50. | Rosemead | 7.0 | 7.0(=0.000)#50 | 10.0(-3.00)#242 |
| 51. | Chula Vista | 8.0 | 7.0(+1.000)#51 | 10.0(-2.00)#267 |
| 52. | Elk Grove | 8.0 | 7.0(+1.000)#52 | 10.0(-2.00)#269 |
| 53. | Murrieta | 8.0 | 7.0(+1.000)#53 | 10.0(-2.00)#271 |
| 54. | Santa Maria | 8.0 | 7.0(+1.000)#54 | 10.0(-2.00)#272 |
| 55. | West Covina | 8.0 | 7.0(+1.000)#55 | 10.0(-2.00)#273 |
| 56. | Rialto | 8.0 | 7.0(+1.000)#56 | 10.0(-2.00)#274 |
| 57. | San Jacinto | 8.0 | 7.0(+1.000)#57 | 10.0(-2.00)#284 |
| 58. | Florin | 8.0 | 7.0(+1.000)#58 | 10.0(-2.00)#287 |
| 59. | Fallbrook | 8.0 | 7.0(+1.000)#59 | 10.0(-2.00)#293 |
| 60. | Dinuba | 8.0 | 7.0(+1.000)#60 | 10.0(-2.00)#296 |
| 61. | Santa Clarita | 9.0 | 7.0(+2.00)#61 | 10.0(-1.000)#306 |
| 62. | Rancho Cordova | 9.0 | 7.0(+2.00)#62 | 10.0(-1.000)#316 |
| 63. | Pico Rivera | 9.0 | 7.0(+2.00)#63 | 10.0(-1.000)#323 |
| 64. | Rancho Santa Margarita | 9.0 | 7.0(+2.00)#64 | 10.0(-1.000)#327 |
| 65. | Westmont | 9.0 | 7.0(+2.00)#65 | 10.0(-1.000)#333 |
| 66. | Los Angeles | 10.0 | 7.0(+3.00)#66 | 10.0(=0.000)#338 |
| 67. | Pomona | 10.0 | 7.0(+3.00)#67 | 10.0(=0.000)#342 |
| 68. | Carson | 10.0 | 7.0(+3.00)#68 | 10.0(=0.000)#347 |
| 69. | Dublin | 10.0 | 7.0(+3.00)#69 | 10.0(=0.000)#351 |
| 70. | Lake Elsinore | 10.0 | 7.0(+3.00)#70 | 10.0(=0.000)#352 |
| 71. | Paramount | 10.0 | 7.0(+3.00)#71 | 10.0(=0.000)#356 |
| 72. | Lincoln | 10.0 | 7.0(+3.00)#72 | 10.0(=0.000)#358 |
| 73. | Bakersfield | 11.0 | 7.0(+4.00)#73 | 10.0(+1.000)#375 |
| 74. | San Bernardino | 11.0 | 7.0(+4.00)#74 | 10.0(+1.000)#382 |
| 75. | Daly City | 11.0 | 7.0(+4.00)#75 | 10.0(+1.000)#389 |
| 76. | Santa Barbara | 11.0 | 7.0(+4.00)#76 | 10.0(+1.000)#392 |
| 77. | Coachella | 11.0 | 7.0(+4.00)#77 | 10.0(+1.000)#398 |
| 78. | Reedley | 11.0 | 7.0(+4.00)#78 | 10.0(+1.000)#405 |
| 79. | Selma | 11.0 | 7.0(+4.00)#79 | 10.0(+1.000)#407 |
| 80. | Cudahy | 11.0 | 7.0(+4.00)#80 | 10.0(+1.000)#410 |
| 81. | Mead Valley | 11.0 | 7.0(+4.00)#81 | 10.0(+1.000)#411 |
| 82. | Sacramento | 12.0 | 7.0(+5.00)#82 | 10.0(+2.00)#421 |
| 83. | Anaheim | 12.0 | 7.0(+5.00)#83 | 10.0(+2.00)#423 |
| 84. | Glendale | 12.0 | 7.0(+5.00)#84 | 10.0(+2.00)#430 |
| 85. | Upland | 12.0 | 7.0(+5.00)#85 | 10.0(+2.00)#438 |
| 86. | Palmdale | 13.0 | 7.0(+6.00)#86 | 10.0(+3.00)#459 |
| 87. | Richmond | 13.0 | 7.0(+6.00)#87 | 10.0(+3.00)#460 |
| 88. | Jurupa Valley | 13.0 | 7.0(+6.00)#88 | 10.0(+3.00)#461 |
| 89. | Salinas | 14.0 | 7.0(+7.00)#89 | 10.0(+4.00)#490 |
| 90. | Visalia | 14.0 | 7.0(+7.00)#90 | 10.0(+4.00)#491 |
| 91. | South Gate | 14.0 | 7.0(+7.00)#91 | 10.0(+4.00)#494 |
| 92. | Madera | 14.0 | 7.0(+7.00)#92 | 10.0(+4.00)#500 |
| 93. | East Palo Alto | 14.0 | 7.0(+7.00)#93 | 10.0(+4.00)#510 |
| 94. | Shafter | 14.0 | 7.0(+7.00)#94 | 10.0(+4.00)#516 |
| 95. | Fresno | 15.0 | 7.0(+8.00)#95 | 10.0(+5.00)#528 |
| 96. | Stanton | 15.0 | 7.0(+8.00)#96 | 10.0(+5.00)#546 |
| 97. | Lennox | 15.0 | 7.0(+8.00)#97 | 10.0(+5.00)#548 |
| 98. | Montecito | 15.0 | 7.0(+8.00)#98 | 10.0(+5.00)#554 |
| 99. | Solvang | 15.0 | 7.0(+8.00)#99 | 10.0(+5.00)#555 |
| 100. | East Porterville | 15.0 | 7.0(+8.00)#100 | 10.0(+5.00)#557 |
Common Questions
What are the Top 10 Cities with the Fewest Births per 1,000 Teenage Women Under the Age of 20 in California?
Top 10 Cities with the Fewest Births per 1,000 Teenage Women Under the Age of 20 in California are:
#1
1.0
#2
1.0
#3
1.0
#4
1.0
#5
1.0
#6
1.0
#7
1.0
#8
1.0
#9
1.0
#10
2.0
What city has the Fewest Births per 1,000 Teenage Women Under the Age of 20 in California?
Fullerton has the Fewest Births per 1,000 Teenage Women Under the Age of 20 in California with 1.0.
What is the Number of Births per 1,000 Teenage Women Under the Age of 20 in the State of California?
Number of Births per 1,000 Teenage Women Under the Age of 20 in California is 7.0.
What is the Number of Births per 1,000 Teenage Women Under the Age of 20 in the United States?
Number of Births per 1,000 Teenage Women Under the Age of 20 in the United States is 10.0.