Cities with the Highest Percentage of Households Without a Vehicle in California
RELATED REPORTS & OPTIONS
Households without a Cars
California
Compare Cities
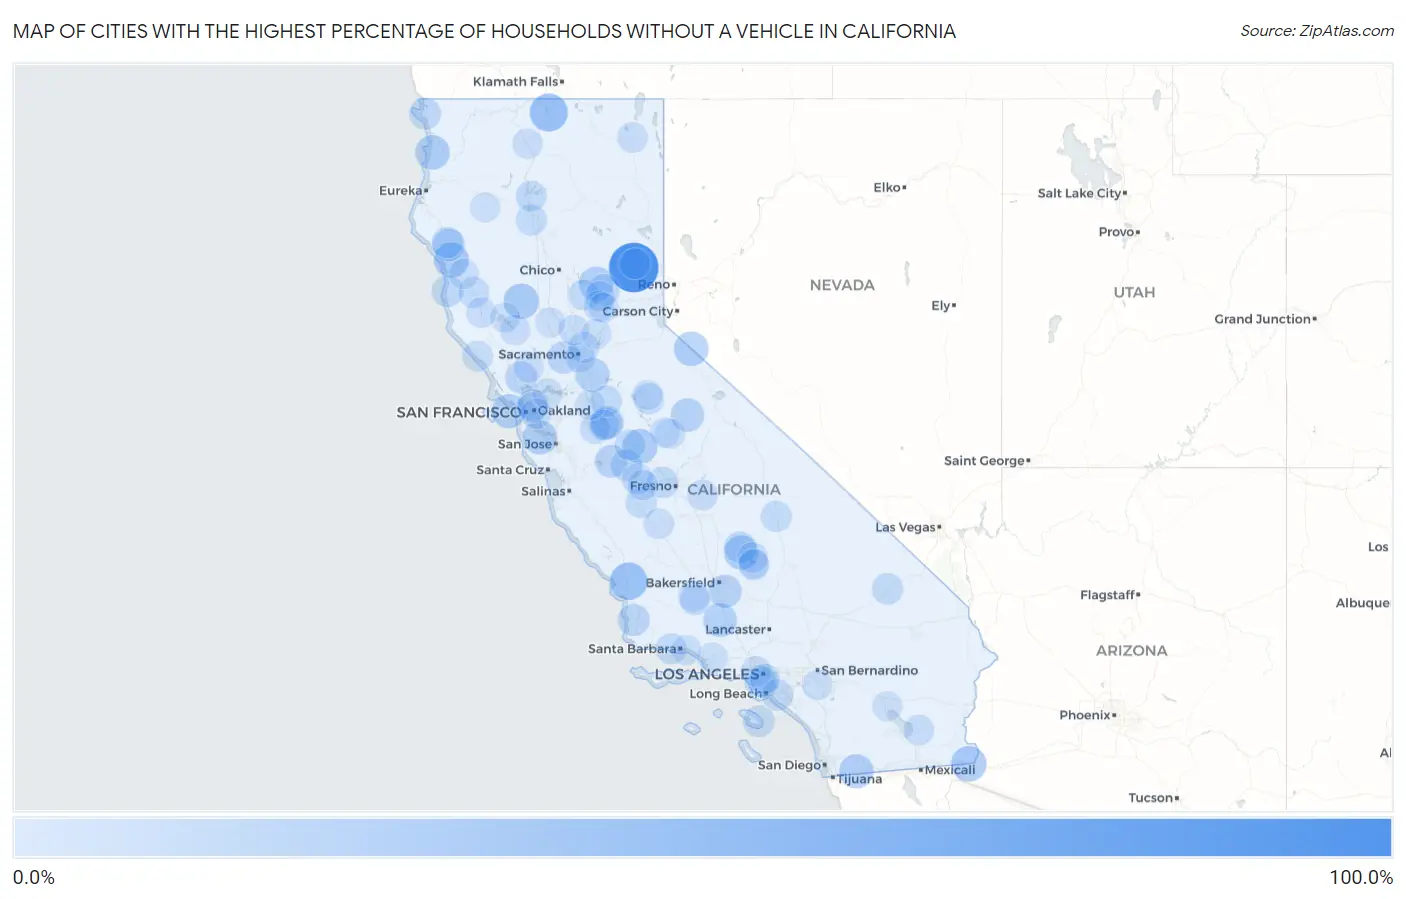
Map of Cities with the Highest Percentage of Households Without a Vehicle in California
0.0%
100.0%
Cities with the Highest Percentage of Households Without a Vehicle in California
| City | Housholds Without a Car | vs State | vs National | |
| 1. | Gold Mountain | 100.0% | 6.9%(+93.1)#1 | 8.3%(+91.7)#15 |
| 2. | Strawberry Cdp Tuolumne County | 75.4% | 6.9%(+68.5)#2 | 8.3%(+67.1)#138 |
| 3. | Dales | 52.0% | 6.9%(+45.1)#3 | 8.3%(+43.7)#226 |
| 4. | Macdoel | 47.1% | 6.9%(+40.2)#4 | 8.3%(+38.8)#258 |
| 5. | Pumpkin Center | 44.9% | 6.9%(+38.0)#5 | 8.3%(+36.6)#282 |
| 6. | Santa Margarita | 44.3% | 6.9%(+37.4)#6 | 8.3%(+36.0)#287 |
| 7. | Winterhaven | 35.8% | 6.9%(+28.9)#7 | 8.3%(+27.5)#410 |
| 8. | Lodoga | 35.4% | 6.9%(+28.5)#8 | 8.3%(+27.1)#424 |
| 9. | Leggett | 34.2% | 6.9%(+27.3)#9 | 8.3%(+25.9)#456 |
| 10. | Bear Creek | 33.3% | 6.9%(+26.4)#10 | 8.3%(+25.0)#478 |
| 11. | Wautec | 33.3% | 6.9%(+26.4)#11 | 8.3%(+25.0)#488 |
| 12. | Orick | 31.7% | 6.9%(+24.8)#12 | 8.3%(+23.4)#529 |
| 13. | Topaz | 31.7% | 6.9%(+24.8)#13 | 8.3%(+23.4)#530 |
| 14. | Panorama Heights | 31.3% | 6.9%(+24.4)#14 | 8.3%(+23.0)#538 |
| 15. | Stanford | 30.6% | 6.9%(+23.7)#15 | 8.3%(+22.3)#560 |
| 16. | Potrero | 30.5% | 6.9%(+23.6)#16 | 8.3%(+22.2)#564 |
| 17. | Clipper Mills | 30.4% | 6.9%(+23.5)#17 | 8.3%(+22.1)#569 |
| 18. | San Francisco | 29.9% | 6.9%(+23.0)#18 | 8.3%(+21.6)#593 |
| 19. | Herald | 29.7% | 6.9%(+22.8)#19 | 8.3%(+21.4)#604 |
| 20. | Jovista | 29.4% | 6.9%(+22.5)#20 | 8.3%(+21.1)#621 |
| 21. | Lake Of The Woods | 28.5% | 6.9%(+21.6)#21 | 8.3%(+20.2)#658 |
| 22. | Kep'el | 27.3% | 6.9%(+20.4)#22 | 8.3%(+19.0)#712 |
| 23. | Yosemite Valley | 27.0% | 6.9%(+20.1)#23 | 8.3%(+18.7)#726 |
| 24. | Weedpatch | 26.5% | 6.9%(+19.6)#24 | 8.3%(+18.2)#753 |
| 25. | Volta | 24.5% | 6.9%(+17.6)#25 | 8.3%(+16.2)#886 |
| 26. | Airport | 23.9% | 6.9%(+17.0)#26 | 8.3%(+15.6)#932 |
| 27. | Benbow | 23.9% | 6.9%(+17.0)#27 | 8.3%(+15.6)#938 |
| 28. | University Of California Davis | 23.8% | 6.9%(+16.9)#28 | 8.3%(+15.5)#940 |
| 29. | Temelec | 22.4% | 6.9%(+15.5)#29 | 8.3%(+14.1)#1,064 |
| 30. | Rouse | 22.4% | 6.9%(+15.5)#30 | 8.3%(+14.1)#1,066 |
| 31. | Post Mountain | 21.8% | 6.9%(+14.9)#31 | 8.3%(+13.5)#1,155 |
| 32. | Casmalia | 21.6% | 6.9%(+14.7)#32 | 8.3%(+13.3)#1,171 |
| 33. | Bayview Cdp Humboldt County | 20.7% | 6.9%(+13.8)#33 | 8.3%(+12.4)#1,300 |
| 34. | Pine Flat | 20.6% | 6.9%(+13.7)#34 | 8.3%(+12.3)#1,326 |
| 35. | Dos Palos Y | 20.4% | 6.9%(+13.5)#35 | 8.3%(+12.1)#1,351 |
| 36. | Fort Bragg | 20.1% | 6.9%(+13.2)#36 | 8.3%(+11.8)#1,384 |
| 37. | Crescent City | 20.1% | 6.9%(+13.2)#37 | 8.3%(+11.8)#1,385 |
| 38. | Camptonville | 20.0% | 6.9%(+13.1)#38 | 8.3%(+11.7)#1,403 |
| 39. | East Bakersfield | 19.4% | 6.9%(+12.5)#39 | 8.3%(+11.1)#1,508 |
| 40. | Avalon | 19.4% | 6.9%(+12.5)#40 | 8.3%(+11.1)#1,512 |
| 41. | Berkeley | 19.3% | 6.9%(+12.4)#41 | 8.3%(+11.0)#1,526 |
| 42. | Baker | 19.2% | 6.9%(+12.3)#42 | 8.3%(+10.9)#1,556 |
| 43. | Farmington | 19.1% | 6.9%(+12.2)#43 | 8.3%(+10.8)#1,572 |
| 44. | Biola | 19.0% | 6.9%(+12.1)#44 | 8.3%(+10.7)#1,582 |
| 45. | Westmont | 18.7% | 6.9%(+11.8)#45 | 8.3%(+10.4)#1,631 |
| 46. | Midway City | 18.6% | 6.9%(+11.7)#46 | 8.3%(+10.3)#1,647 |
| 47. | Tuolumne City | 17.9% | 6.9%(+11.0)#47 | 8.3%(+9.60)#1,801 |
| 48. | Cartago | 17.9% | 6.9%(+11.0)#48 | 8.3%(+9.60)#1,814 |
| 49. | Ford City | 17.5% | 6.9%(+10.6)#49 | 8.3%(+9.20)#1,896 |
| 50. | Garberville | 17.5% | 6.9%(+10.6)#50 | 8.3%(+9.20)#1,902 |
| 51. | Three Rocks | 17.5% | 6.9%(+10.6)#51 | 8.3%(+9.20)#1,917 |
| 52. | Firebaugh | 17.3% | 6.9%(+10.4)#52 | 8.3%(+9.00)#1,948 |
| 53. | Cottonwood | 17.3% | 6.9%(+10.4)#53 | 8.3%(+9.00)#1,949 |
| 54. | Willits | 17.3% | 6.9%(+10.4)#54 | 8.3%(+9.00)#1,950 |
| 55. | Isla Vista | 17.1% | 6.9%(+10.2)#55 | 8.3%(+8.80)#1,994 |
| 56. | Mcswain | 17.1% | 6.9%(+10.2)#56 | 8.3%(+8.80)#1,997 |
| 57. | Mcclellan Park | 17.1% | 6.9%(+10.2)#57 | 8.3%(+8.80)#2,003 |
| 58. | Mountain Gate | 17.1% | 6.9%(+10.2)#58 | 8.3%(+8.80)#2,004 |
| 59. | Bangor | 16.8% | 6.9%(+9.90)#59 | 8.3%(+8.50)#2,082 |
| 60. | Rough And Ready | 16.4% | 6.9%(+9.50)#60 | 8.3%(+8.10)#2,206 |
| 61. | Delleker | 16.4% | 6.9%(+9.50)#61 | 8.3%(+8.10)#2,209 |
| 62. | Willowbrook | 16.3% | 6.9%(+9.40)#62 | 8.3%(+8.00)#2,218 |
| 63. | Timber Cove | 16.3% | 6.9%(+9.40)#63 | 8.3%(+8.00)#2,246 |
| 64. | Squirrel Mountain Valley | 16.0% | 6.9%(+9.10)#64 | 8.3%(+7.70)#2,324 |
| 65. | Mendota | 15.6% | 6.9%(+8.70)#65 | 8.3%(+7.30)#2,456 |
| 66. | Alturas | 15.5% | 6.9%(+8.60)#66 | 8.3%(+7.20)#2,506 |
| 67. | Orange Cove | 15.4% | 6.9%(+8.50)#67 | 8.3%(+7.10)#2,531 |
| 68. | Kernville | 15.3% | 6.9%(+8.40)#68 | 8.3%(+7.00)#2,592 |
| 69. | Niland | 15.3% | 6.9%(+8.40)#69 | 8.3%(+7.00)#2,594 |
| 70. | Fruitridge Pocket | 14.9% | 6.9%(+8.00)#70 | 8.3%(+6.60)#2,712 |
| 71. | Riverdale Park | 14.9% | 6.9%(+8.00)#71 | 8.3%(+6.60)#2,732 |
| 72. | Nicolaus | 14.9% | 6.9%(+8.00)#72 | 8.3%(+6.60)#2,746 |
| 73. | Oakland | 14.8% | 6.9%(+7.90)#73 | 8.3%(+6.50)#2,748 |
| 74. | Taft | 14.8% | 6.9%(+7.90)#74 | 8.3%(+6.50)#2,754 |
| 75. | West Hollywood | 14.6% | 6.9%(+7.70)#75 | 8.3%(+6.30)#2,820 |
| 76. | Ukiah | 14.5% | 6.9%(+7.60)#76 | 8.3%(+6.20)#2,865 |
| 77. | Emeryville | 14.5% | 6.9%(+7.60)#77 | 8.3%(+6.20)#2,868 |
| 78. | Lower Lake | 14.5% | 6.9%(+7.60)#78 | 8.3%(+6.20)#2,891 |
| 79. | Laytonville | 14.5% | 6.9%(+7.60)#79 | 8.3%(+6.20)#2,899 |
| 80. | Huron | 14.4% | 6.9%(+7.50)#80 | 8.3%(+6.10)#2,924 |
| 81. | Weed | 14.4% | 6.9%(+7.50)#81 | 8.3%(+6.10)#2,929 |
| 82. | North San Juan | 14.4% | 6.9%(+7.50)#82 | 8.3%(+6.10)#2,960 |
| 83. | March Arb | 14.2% | 6.9%(+7.30)#83 | 8.3%(+5.90)#3,032 |
| 84. | Westley | 14.0% | 6.9%(+7.10)#84 | 8.3%(+5.70)#3,117 |
| 85. | Yountville | 13.9% | 6.9%(+7.00)#85 | 8.3%(+5.60)#3,148 |
| 86. | Clyde | 13.9% | 6.9%(+7.00)#86 | 8.3%(+5.60)#3,162 |
| 87. | Mountain Mesa | 13.8% | 6.9%(+6.90)#87 | 8.3%(+5.50)#3,208 |
| 88. | Bootjack | 13.8% | 6.9%(+6.90)#88 | 8.3%(+5.50)#3,210 |
| 89. | Mecca | 13.7% | 6.9%(+6.80)#89 | 8.3%(+5.40)#3,232 |
| 90. | French Camp | 13.6% | 6.9%(+6.70)#90 | 8.3%(+5.30)#3,282 |
| 91. | Saticoy | 13.6% | 6.9%(+6.70)#91 | 8.3%(+5.30)#3,289 |
| 92. | Mono Vista | 13.5% | 6.9%(+6.60)#92 | 8.3%(+5.20)#3,320 |
| 93. | Mariposa | 13.5% | 6.9%(+6.60)#93 | 8.3%(+5.20)#3,333 |
| 94. | Huntington Park | 13.4% | 6.9%(+6.50)#94 | 8.3%(+5.10)#3,351 |
| 95. | Hayfork | 13.4% | 6.9%(+6.50)#95 | 8.3%(+5.10)#3,369 |
| 96. | Lucerne | 13.4% | 6.9%(+6.50)#96 | 8.3%(+5.10)#3,372 |
| 97. | College City | 13.4% | 6.9%(+6.50)#97 | 8.3%(+5.10)#3,391 |
| 98. | Grass Valley | 13.3% | 6.9%(+6.40)#98 | 8.3%(+5.00)#3,398 |
| 99. | Summerland | 13.2% | 6.9%(+6.30)#99 | 8.3%(+4.90)#3,470 |
| 100. | Penryn | 13.1% | 6.9%(+6.20)#100 | 8.3%(+4.80)#3,517 |
Common Questions
What are the Top 10 Cities with the Highest Percentage of Households Without a Vehicle in California?
Top 10 Cities with the Highest Percentage of Households Without a Vehicle in California are:
#1
100.0%
#2
47.1%
#3
44.3%
#4
35.8%
#5
35.4%
#6
34.2%
#7
33.3%
#8
31.7%
#9
31.7%
#10
31.3%
What city has the Highest Percentage of Households Without a Vehicle in California?
Gold Mountain has the Highest Percentage of Households Without a Vehicle in California with 100.0%.
What is the Percentage of Households Without a Vehicle in the State of California?
Percentage of Households Without a Vehicle in California is 6.9%.
What is the Percentage of Households Without a Vehicle in the United States?
Percentage of Households Without a Vehicle in the United States is 8.3%.