Cities with the Largest African Community in California
RELATED REPORTS & OPTIONS
African
California
Compare Cities
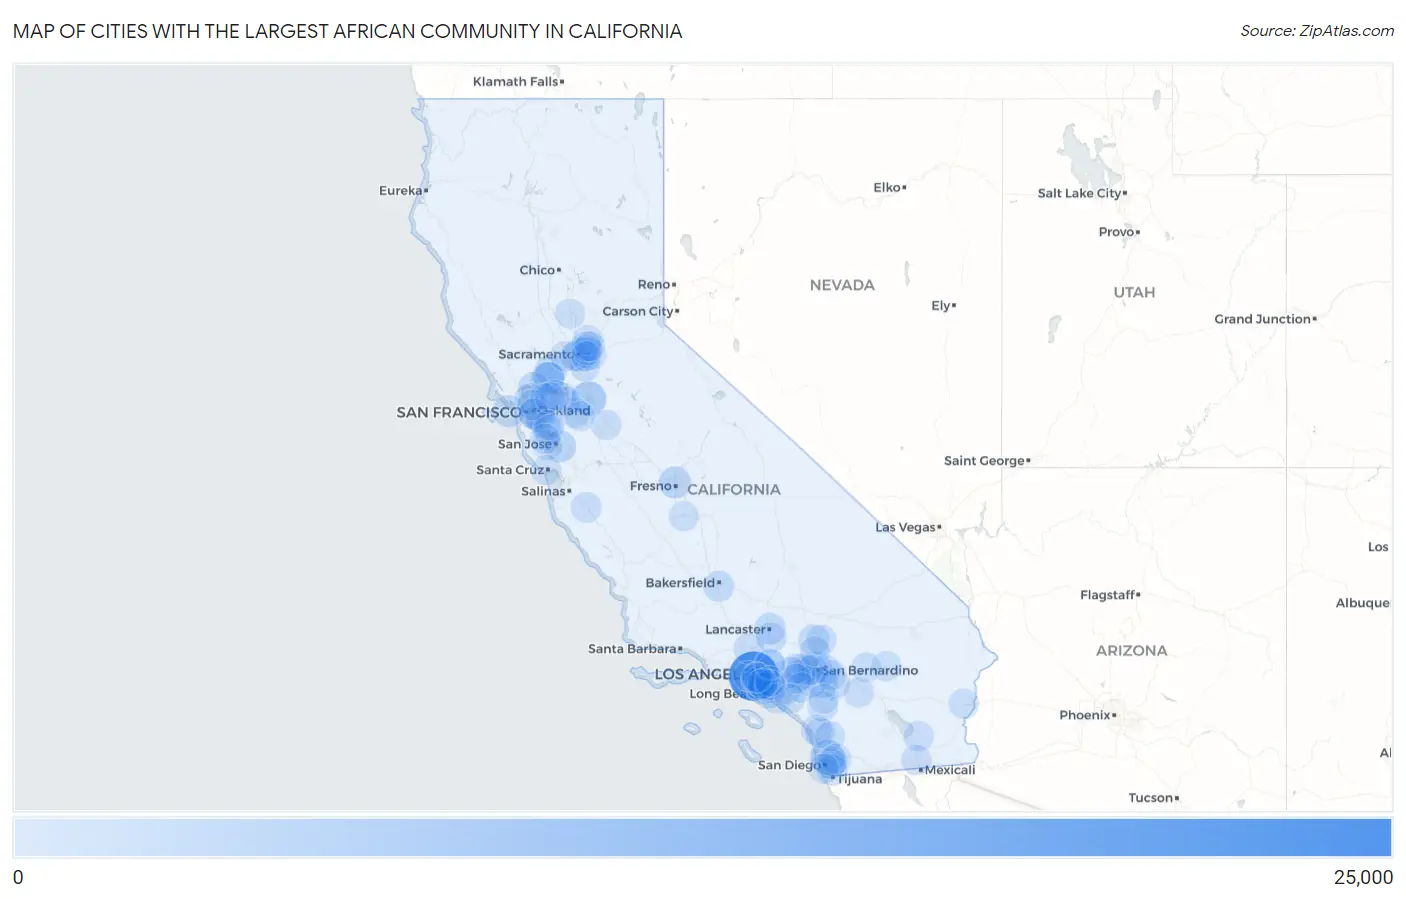
Map of Cities with the Largest African Community in California
0
25,000
Cities with the Largest African Community in California
| City | African | vs State | vs National | |
| 1. | Los Angeles | 22,522 | 144,343(15.60%)#1 | 1,871,898(1.20%)#3 |
| 2. | San Diego | 5,342 | 144,343(3.70%)#2 | 1,871,898(0.29%)#33 |
| 3. | Stockton | 5,334 | 144,343(3.70%)#3 | 1,871,898(0.28%)#34 |
| 4. | Oakland | 3,766 | 144,343(2.61%)#4 | 1,871,898(0.20%)#53 |
| 5. | Fairfield | 3,676 | 144,343(2.55%)#5 | 1,871,898(0.20%)#54 |
| 6. | Sacramento | 3,266 | 144,343(2.26%)#6 | 1,871,898(0.17%)#62 |
| 7. | San Jose | 2,399 | 144,343(1.66%)#7 | 1,871,898(0.13%)#95 |
| 8. | Fresno | 2,384 | 144,343(1.65%)#8 | 1,871,898(0.13%)#97 |
| 9. | San Francisco | 2,232 | 144,343(1.55%)#9 | 1,871,898(0.12%)#108 |
| 10. | Long Beach | 2,085 | 144,343(1.44%)#10 | 1,871,898(0.11%)#124 |
| 11. | Vacaville | 2,072 | 144,343(1.44%)#11 | 1,871,898(0.11%)#126 |
| 12. | San Bernardino | 1,754 | 144,343(1.22%)#12 | 1,871,898(0.09%)#145 |
| 13. | Lancaster | 1,710 | 144,343(1.18%)#13 | 1,871,898(0.09%)#151 |
| 14. | Inglewood | 1,600 | 144,343(1.11%)#14 | 1,871,898(0.09%)#160 |
| 15. | Vallejo | 1,534 | 144,343(1.06%)#15 | 1,871,898(0.08%)#167 |
| 16. | Riverside | 1,499 | 144,343(1.04%)#16 | 1,871,898(0.08%)#171 |
| 17. | Victorville | 1,375 | 144,343(0.95%)#17 | 1,871,898(0.07%)#185 |
| 18. | Moreno Valley | 1,314 | 144,343(0.91%)#18 | 1,871,898(0.07%)#191 |
| 19. | Hawthorne | 1,297 | 144,343(0.90%)#19 | 1,871,898(0.07%)#193 |
| 20. | Suisun City | 1,276 | 144,343(0.88%)#20 | 1,871,898(0.07%)#196 |
| 21. | Richmond | 1,257 | 144,343(0.87%)#21 | 1,871,898(0.07%)#201 |
| 22. | Chula Vista | 1,237 | 144,343(0.86%)#22 | 1,871,898(0.07%)#204 |
| 23. | Carson | 1,227 | 144,343(0.85%)#23 | 1,871,898(0.07%)#208 |
| 24. | Bakersfield | 1,222 | 144,343(0.85%)#24 | 1,871,898(0.07%)#209 |
| 25. | Compton | 1,170 | 144,343(0.81%)#25 | 1,871,898(0.06%)#214 |
| 26. | Anaheim | 1,096 | 144,343(0.76%)#26 | 1,871,898(0.06%)#227 |
| 27. | Rancho Cucamonga | 901 | 144,343(0.62%)#27 | 1,871,898(0.05%)#290 |
| 28. | Soledad | 821 | 144,343(0.57%)#28 | 1,871,898(0.04%)#318 |
| 29. | Hayward | 810 | 144,343(0.56%)#29 | 1,871,898(0.04%)#322 |
| 30. | Ontario | 771 | 144,343(0.53%)#30 | 1,871,898(0.04%)#335 |
| 31. | Elk Grove | 770 | 144,343(0.53%)#31 | 1,871,898(0.04%)#336 |
| 32. | Mountain House | 716 | 144,343(0.50%)#32 | 1,871,898(0.04%)#368 |
| 33. | San Leandro | 705 | 144,343(0.49%)#33 | 1,871,898(0.04%)#376 |
| 34. | Berkeley | 704 | 144,343(0.49%)#34 | 1,871,898(0.04%)#377 |
| 35. | Antioch | 693 | 144,343(0.48%)#35 | 1,871,898(0.04%)#385 |
| 36. | Palm Springs | 659 | 144,343(0.46%)#36 | 1,871,898(0.04%)#405 |
| 37. | Oceanside | 657 | 144,343(0.46%)#37 | 1,871,898(0.04%)#408 |
| 38. | Palmdale | 644 | 144,343(0.45%)#38 | 1,871,898(0.03%)#418 |
| 39. | Highland | 644 | 144,343(0.45%)#39 | 1,871,898(0.03%)#420 |
| 40. | Brentwood | 643 | 144,343(0.45%)#40 | 1,871,898(0.03%)#422 |
| 41. | Rialto | 642 | 144,343(0.44%)#41 | 1,871,898(0.03%)#423 |
| 42. | Calipatria | 608 | 144,343(0.42%)#42 | 1,871,898(0.03%)#450 |
| 43. | Santa Clarita | 597 | 144,343(0.41%)#43 | 1,871,898(0.03%)#459 |
| 44. | Arden Arcade | 595 | 144,343(0.41%)#44 | 1,871,898(0.03%)#463 |
| 45. | El Centro | 584 | 144,343(0.40%)#45 | 1,871,898(0.03%)#475 |
| 46. | Rancho Cordova | 582 | 144,343(0.40%)#46 | 1,871,898(0.03%)#476 |
| 47. | Fontana | 560 | 144,343(0.39%)#47 | 1,871,898(0.03%)#499 |
| 48. | Pittsburg | 560 | 144,343(0.39%)#48 | 1,871,898(0.03%)#501 |
| 49. | Apple Valley | 558 | 144,343(0.39%)#49 | 1,871,898(0.03%)#502 |
| 50. | Pleasant Hill | 549 | 144,343(0.38%)#50 | 1,871,898(0.03%)#508 |
| 51. | Alameda | 544 | 144,343(0.38%)#51 | 1,871,898(0.03%)#513 |
| 52. | Pomona | 532 | 144,343(0.37%)#52 | 1,871,898(0.03%)#525 |
| 53. | Murrieta | 530 | 144,343(0.37%)#53 | 1,871,898(0.03%)#526 |
| 54. | Lakewood | 528 | 144,343(0.37%)#54 | 1,871,898(0.03%)#529 |
| 55. | Concord | 522 | 144,343(0.36%)#55 | 1,871,898(0.03%)#536 |
| 56. | Blythe | 520 | 144,343(0.36%)#56 | 1,871,898(0.03%)#539 |
| 57. | Westmont | 496 | 144,343(0.34%)#57 | 1,871,898(0.03%)#566 |
| 58. | Gardena | 486 | 144,343(0.34%)#58 | 1,871,898(0.03%)#579 |
| 59. | El Cajon | 460 | 144,343(0.32%)#59 | 1,871,898(0.02%)#623 |
| 60. | Camp Pendleton Mainside | 456 | 144,343(0.32%)#60 | 1,871,898(0.02%)#625 |
| 61. | Davis | 453 | 144,343(0.31%)#61 | 1,871,898(0.02%)#628 |
| 62. | Santa Monica | 450 | 144,343(0.31%)#62 | 1,871,898(0.02%)#636 |
| 63. | Twentynine Palms | 443 | 144,343(0.31%)#63 | 1,871,898(0.02%)#646 |
| 64. | Cupertino | 395 | 144,343(0.27%)#64 | 1,871,898(0.02%)#714 |
| 65. | Upland | 394 | 144,343(0.27%)#65 | 1,871,898(0.02%)#717 |
| 66. | Lemon Grove | 390 | 144,343(0.27%)#66 | 1,871,898(0.02%)#729 |
| 67. | West Sacramento | 384 | 144,343(0.27%)#67 | 1,871,898(0.02%)#744 |
| 68. | Hesperia | 383 | 144,343(0.27%)#68 | 1,871,898(0.02%)#749 |
| 69. | View Park Windsor Hills | 383 | 144,343(0.27%)#69 | 1,871,898(0.02%)#752 |
| 70. | La Mesa | 377 | 144,343(0.26%)#70 | 1,871,898(0.02%)#762 |
| 71. | Yucaipa | 374 | 144,343(0.26%)#71 | 1,871,898(0.02%)#769 |
| 72. | Vista | 353 | 144,343(0.24%)#72 | 1,871,898(0.02%)#804 |
| 73. | Yuba City | 351 | 144,343(0.24%)#73 | 1,871,898(0.02%)#810 |
| 74. | Roseville | 347 | 144,343(0.24%)#74 | 1,871,898(0.02%)#818 |
| 75. | Escondido | 343 | 144,343(0.24%)#75 | 1,871,898(0.02%)#825 |
| 76. | Pasadena | 342 | 144,343(0.24%)#76 | 1,871,898(0.02%)#827 |
| 77. | Carmichael | 340 | 144,343(0.24%)#77 | 1,871,898(0.02%)#832 |
| 78. | Fremont | 336 | 144,343(0.23%)#78 | 1,871,898(0.02%)#837 |
| 79. | Union City | 336 | 144,343(0.23%)#79 | 1,871,898(0.02%)#838 |
| 80. | Beaumont | 330 | 144,343(0.23%)#80 | 1,871,898(0.02%)#849 |
| 81. | Foothill Farms | 310 | 144,343(0.21%)#81 | 1,871,898(0.02%)#877 |
| 82. | Corona | 309 | 144,343(0.21%)#82 | 1,871,898(0.02%)#879 |
| 83. | Rosemont | 309 | 144,343(0.21%)#83 | 1,871,898(0.02%)#881 |
| 84. | Modesto | 308 | 144,343(0.21%)#84 | 1,871,898(0.02%)#882 |
| 85. | Huntington Beach | 307 | 144,343(0.21%)#85 | 1,871,898(0.02%)#883 |
| 86. | Altadena | 306 | 144,343(0.21%)#86 | 1,871,898(0.02%)#887 |
| 87. | Bellflower | 304 | 144,343(0.21%)#87 | 1,871,898(0.02%)#898 |
| 88. | Tracy | 288 | 144,343(0.20%)#88 | 1,871,898(0.02%)#938 |
| 89. | Santa Cruz | 287 | 144,343(0.20%)#89 | 1,871,898(0.02%)#942 |
| 90. | Citrus Heights | 283 | 144,343(0.20%)#90 | 1,871,898(0.02%)#955 |
| 91. | Yucca Valley | 280 | 144,343(0.19%)#91 | 1,871,898(0.01%)#965 |
| 92. | Ladera Heights | 279 | 144,343(0.19%)#92 | 1,871,898(0.01%)#967 |
| 93. | Downey | 278 | 144,343(0.19%)#93 | 1,871,898(0.01%)#968 |
| 94. | Chino | 275 | 144,343(0.19%)#94 | 1,871,898(0.01%)#974 |
| 95. | Hanford | 274 | 144,343(0.19%)#95 | 1,871,898(0.01%)#979 |
| 96. | Menifee | 273 | 144,343(0.19%)#96 | 1,871,898(0.01%)#983 |
| 97. | Irvine | 272 | 144,343(0.19%)#97 | 1,871,898(0.01%)#984 |
| 98. | Mountain View | 272 | 144,343(0.19%)#98 | 1,871,898(0.01%)#986 |
| 99. | Coronado | 269 | 144,343(0.19%)#99 | 1,871,898(0.01%)#995 |
| 100. | West Rancho Dominguez | 266 | 144,343(0.18%)#100 | 1,871,898(0.01%)#1,008 |
Common Questions
What are the Top 10 Cities with the Largest African Community in California?
Top 10 Cities with the Largest African Community in California are:
#1
22,522
#2
5,342
#3
5,334
#4
3,766
#5
3,676
#6
3,266
#7
2,399
#8
2,384
#9
2,232
#10
2,085
What city has the Largest African Community in California?
Los Angeles has the Largest African Community in California with 22,522.
What is the Total African Population in the State of California?
Total African Population in California is 144,343.
What is the Total African Population in the United States?
Total African Population in the United States is 1,871,898.