Alabama Map & Demographics
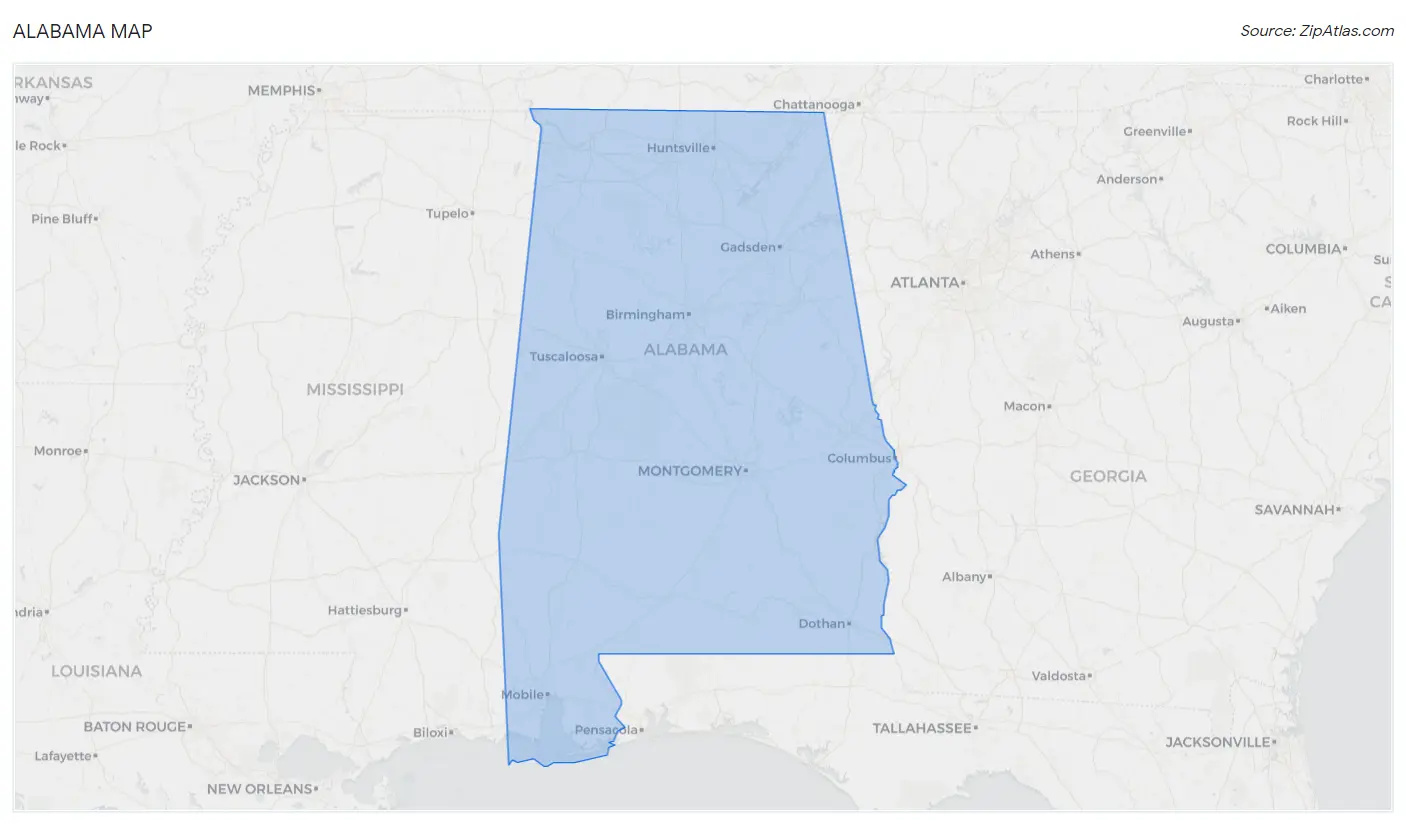
Alabama Map
Alabama Overview
Dec 14, 1819
INCORPORATED
52,420
TOTAL AREA [ SQ MI ]
50,644
LAND AREA [ SQ MI ]
1,776
WATER AREA [ SQ MI ]
500
ELEVATION AVG [ FT ]
2,407
ELEVATION HIGH [ FT ]
Sea Level
ELEVATION LOW [ FT ]
99.3
POP DENSITY [ PPL / SQ MI ]
$33,344
PER CAPITA INCOME
$77,363
AVG FAMILY INCOME
$59,609
AVG HOUSEHOLD INCOME
34.0%
WAGE / INCOME GAP [ % ]
66.0¢/ $1
WAGE / INCOME GAP [ $ ]
$10,802
FAMILY INCOME DEFICIT
0.48
INEQUALITY / GINI INDEX
35242
LARGEST ZIP CODE
Huntsville
LARGEST CITY
Jefferson County
LARGEST COUNTY
5,028,092
TOTAL POPULATION
2,445,995
MALE POPULATION
2,582,097
FEMALE POPULATION
94.73
MALES / 100 FEMALES
105.56
FEMALES / 100 MALES
39.3
MEDIAN AGE
3.2
AVG FAMILY SIZE
2.5
AVG HOUSEHOLD SIZE
2,347,036
LABOR FORCE [ PEOPLE ]
58.0%
PERCENT IN LABOR FORCE
5.2%
UNEMPLOYMENT RATE
Income in Alabama
Income Overview in Alabama
Per Capita Income in Alabama is $33,344, while median incomes of families and households are $77,363 and $59,609 respectively.
| Characteristic | Number | Measure |
| Per Capita Income | 5,028,092 | $33,344 |
| Median Family Income | 1,255,864 | $77,363 |
| Mean Family Income | 1,255,864 | $100,358 |
| Median Household Income | 1,933,150 | $59,609 |
| Mean Household Income | 1,933,150 | $82,992 |
| Income Deficit | 1,255,864 | $10,802 |
| Wage / Income Gap (%) | 5,028,092 | 34.01% |
| Wage / Income Gap ($) | 5,028,092 | 65.99¢ per $1 |
| Gini / Inequality Index | 5,028,092 | 0.48 |
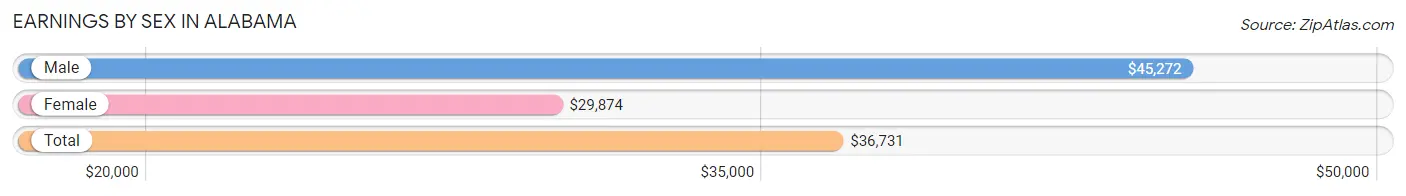
Earnings by Sex in Alabama
Average Earnings in Alabama are $36,731, $45,272 for men and $29,874 for women, a difference of 34.0%.
| Sex | Number | Average Earnings |
| Male | 1,282,085 (52.3%) | $45,272 |
| Female | 1,171,172 (47.7%) | $29,874 |
| Total | 2,453,257 (100.0%) | $36,731 |
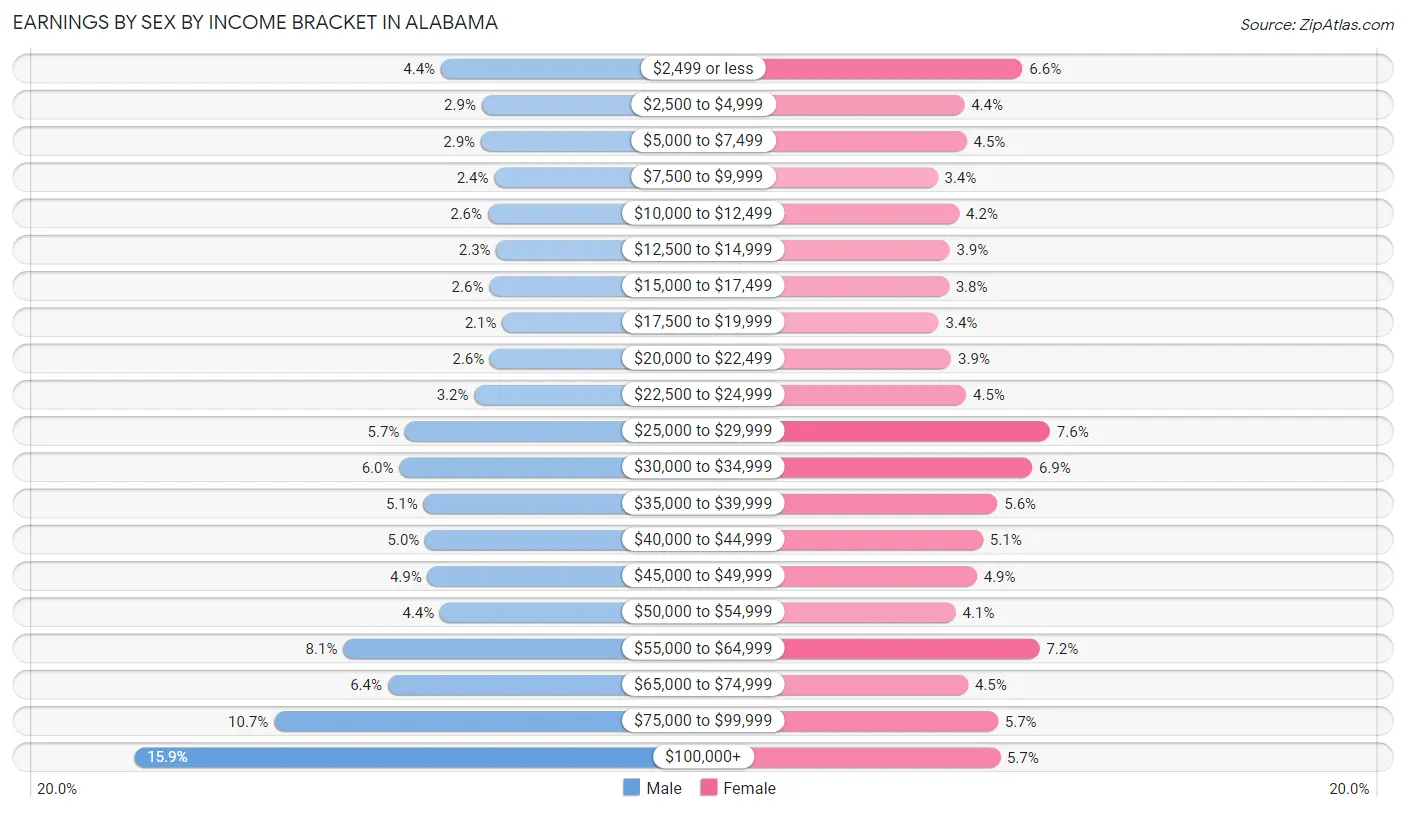
Earnings by Sex by Income Bracket in Alabama
The most common earnings brackets in Alabama are $100,000+ for men (203,692 | 15.9%) and $25,000 to $29,999 for women (89,158 | 7.6%).
| Income | Male | Female |
| $2,499 or less | 56,362 (4.4%) | 77,076 (6.6%) |
| $2,500 to $4,999 | 36,806 (2.9%) | 51,550 (4.4%) |
| $5,000 to $7,499 | 37,185 (2.9%) | 52,616 (4.5%) |
| $7,500 to $9,999 | 30,802 (2.4%) | 39,872 (3.4%) |
| $10,000 to $12,499 | 33,900 (2.6%) | 49,306 (4.2%) |
| $12,500 to $14,999 | 29,688 (2.3%) | 45,110 (3.8%) |
| $15,000 to $17,499 | 33,219 (2.6%) | 44,723 (3.8%) |
| $17,500 to $19,999 | 26,900 (2.1%) | 40,339 (3.4%) |
| $20,000 to $22,499 | 32,792 (2.6%) | 45,786 (3.9%) |
| $22,500 to $24,999 | 40,375 (3.2%) | 52,404 (4.5%) |
| $25,000 to $29,999 | 73,622 (5.7%) | 89,158 (7.6%) |
| $30,000 to $34,999 | 76,443 (6.0%) | 81,328 (6.9%) |
| $35,000 to $39,999 | 64,790 (5.1%) | 66,098 (5.6%) |
| $40,000 to $44,999 | 63,935 (5.0%) | 59,716 (5.1%) |
| $45,000 to $49,999 | 62,876 (4.9%) | 57,056 (4.9%) |
| $50,000 to $54,999 | 56,860 (4.4%) | 47,786 (4.1%) |
| $55,000 to $64,999 | 103,349 (8.1%) | 84,568 (7.2%) |
| $65,000 to $74,999 | 81,907 (6.4%) | 53,156 (4.5%) |
| $75,000 to $99,999 | 136,582 (10.6%) | 66,312 (5.7%) |
| $100,000+ | 203,692 (15.9%) | 67,212 (5.7%) |
| Total | 1,282,085 (100.0%) | 1,171,172 (100.0%) |
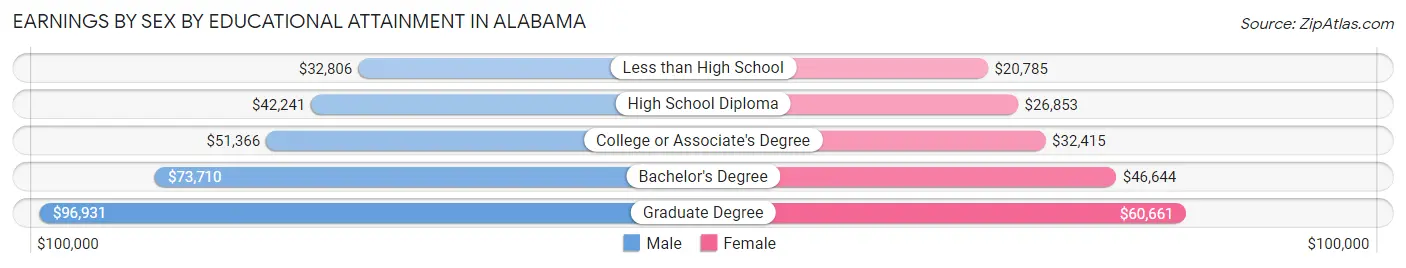
Earnings by Sex by Educational Attainment in Alabama
Average earnings in Alabama are $52,287 for men and $34,853 for women, a difference of 33.3%. Men with an educational attainment of graduate degree enjoy the highest average annual earnings of $96,931, while those with less than high school education earn the least with $32,806. Women with an educational attainment of graduate degree earn the most with the average annual earnings of $60,661, while those with less than high school education have the smallest earnings of $20,785.
| Educational Attainment | Male Income | Female Income |
| Less than High School | $32,806 | $20,785 |
| High School Diploma | $42,241 | $26,853 |
| College or Associate's Degree | $51,366 | $32,415 |
| Bachelor's Degree | $73,710 | $46,644 |
| Graduate Degree | $96,931 | $60,661 |
| Total | $52,287 | $34,853 |
Family Income in Alabama
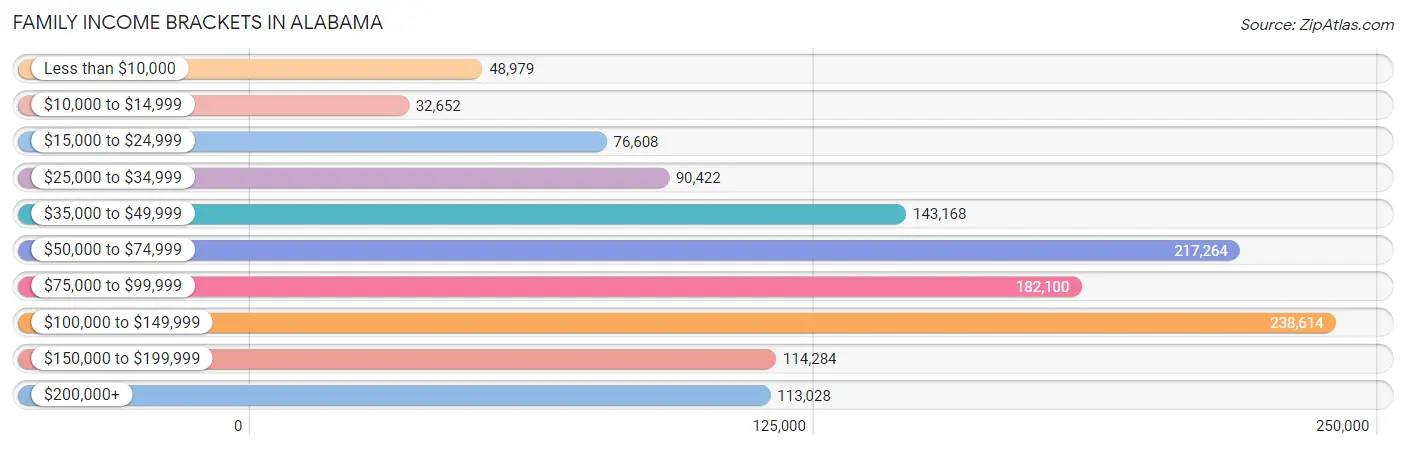
Family Income Brackets in Alabama
According to the Alabama family income data, there are 238,614 families falling into the $100,000 to $149,999 income range, which is the most common income bracket and makes up 19.0% of all families. Conversely, the $10,000 to $14,999 income bracket is the least frequent group with only 32,652 families (2.6%) belonging to this category.
| Income Bracket | # Families | % Families |
| Less than $10,000 | 48,979 | 3.9% |
| $10,000 to $14,999 | 32,652 | 2.6% |
| $15,000 to $24,999 | 76,608 | 6.1% |
| $25,000 to $34,999 | 90,422 | 7.2% |
| $35,000 to $49,999 | 143,168 | 11.4% |
| $50,000 to $74,999 | 217,264 | 17.3% |
| $75,000 to $99,999 | 182,100 | 14.5% |
| $100,000 to $149,999 | 238,614 | 19.0% |
| $150,000 to $199,999 | 114,284 | 9.1% |
| $200,000+ | 113,028 | 9.0% |
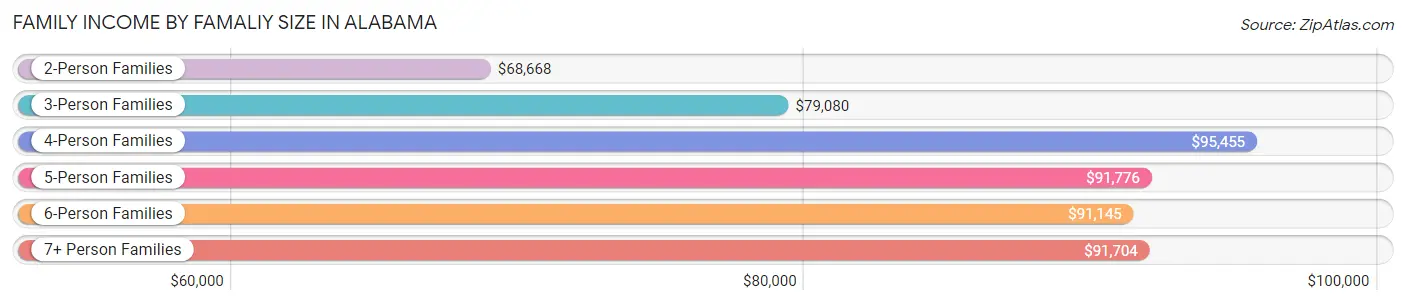
Family Income by Famaliy Size in Alabama
4-person families (213,420 | 17.0%) account for the highest median family income in Alabama with $95,455 per family, while 2-person families (628,326 | 50.0%) have the highest median income of $34,334 per family member.
| Income Bracket | # Families | Median Income |
| 2-Person Families | 628,326 (50.0%) | $68,668 |
| 3-Person Families | 282,008 (22.5%) | $79,080 |
| 4-Person Families | 213,420 (17.0%) | $95,455 |
| 5-Person Families | 89,477 (7.1%) | $91,776 |
| 6-Person Families | 28,979 (2.3%) | $91,145 |
| 7+ Person Families | 13,654 (1.1%) | $91,704 |
| Total | 1,255,864 (100.0%) | $77,363 |
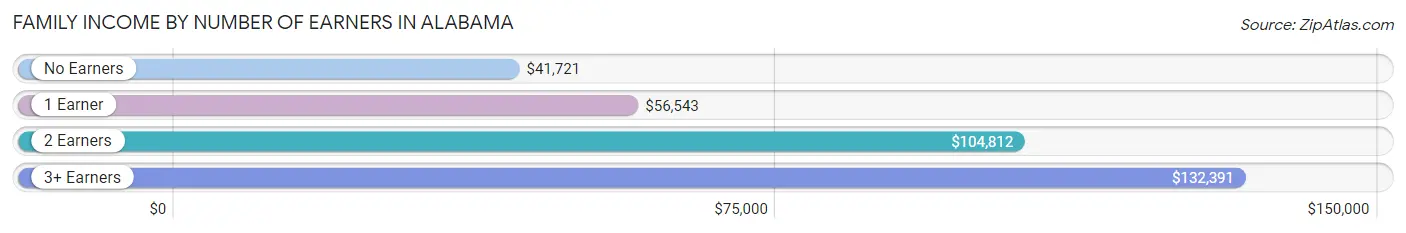
Family Income by Number of Earners in Alabama
The median family income in Alabama is $77,363, with families comprising 3+ earners (108,169) having the highest median family income of $132,391, while families with no earners (232,458) have the lowest median family income of $41,721, accounting for 8.6% and 18.5% of families, respectively.
| Number of Earners | # Families | Median Income |
| No Earners | 232,458 (18.5%) | $41,721 |
| 1 Earner | 428,664 (34.1%) | $56,543 |
| 2 Earners | 486,573 (38.7%) | $104,812 |
| 3+ Earners | 108,169 (8.6%) | $132,391 |
| Total | 1,255,864 (100.0%) | $77,363 |
Household Income in Alabama
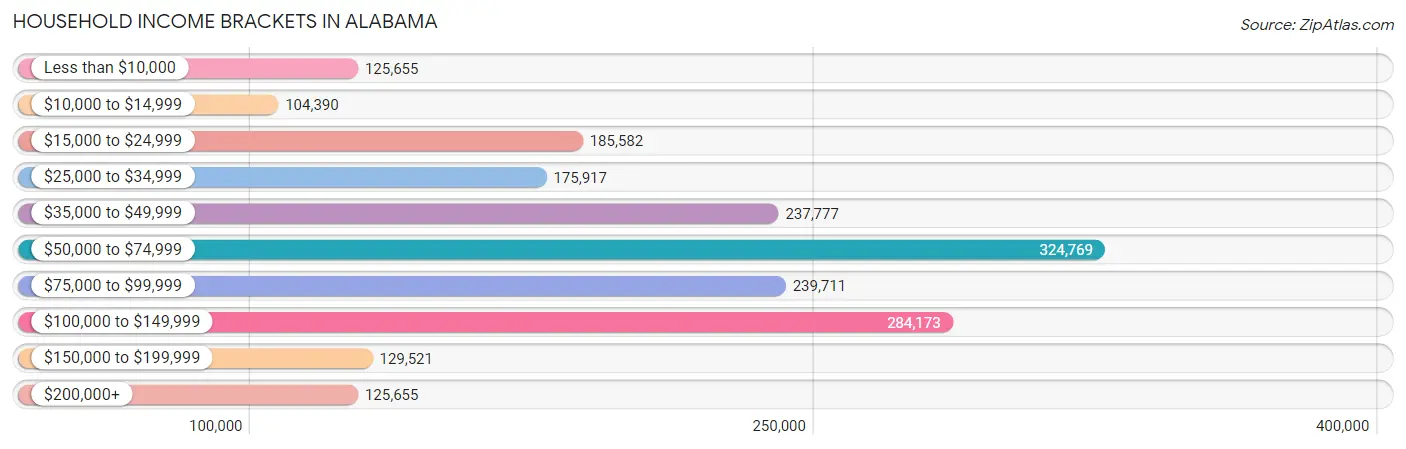
Household Income Brackets in Alabama
With 324,769 households falling in the category, the $50,000 to $74,999 income range is the most frequent in Alabama, accounting for 16.8% of all households. In contrast, only 104,390 households (5.4%) fall into the $10,000 to $14,999 income bracket, making it the least populous group.
| Income Bracket | # Households | % Households |
| Less than $10,000 | 125,655 | 6.5% |
| $10,000 to $14,999 | 104,390 | 5.4% |
| $15,000 to $24,999 | 185,582 | 9.6% |
| $25,000 to $34,999 | 175,917 | 9.1% |
| $35,000 to $49,999 | 237,777 | 12.3% |
| $50,000 to $74,999 | 324,769 | 16.8% |
| $75,000 to $99,999 | 239,711 | 12.4% |
| $100,000 to $149,999 | 284,173 | 14.7% |
| $150,000 to $199,999 | 129,521 | 6.7% |
| $200,000+ | 125,655 | 6.5% |
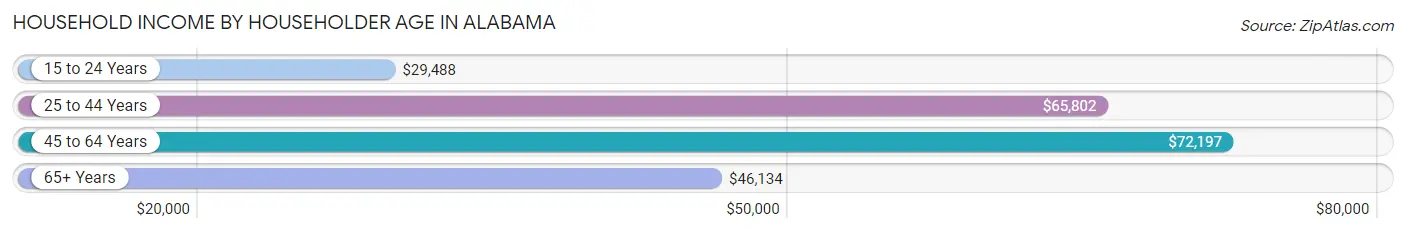
Household Income by Householder Age in Alabama
The median household income in Alabama is $59,609, with the highest median household income of $72,197 found in the 45 to 64 years age bracket for the primary householder. A total of 719,733 households (37.2%) fall into this category. Meanwhile, the 15 to 24 years age bracket for the primary householder has the lowest median household income of $29,488, with 74,056 households (3.8%) in this group.
| Income Bracket | # Households | Median Income |
| 15 to 24 Years | 74,056 (3.8%) | $29,488 |
| 25 to 44 Years | 590,100 (30.5%) | $65,802 |
| 45 to 64 Years | 719,733 (37.2%) | $72,197 |
| 65+ Years | 549,261 (28.4%) | $46,134 |
| Total | 1,933,150 (100.0%) | $59,609 |
Poverty in Alabama
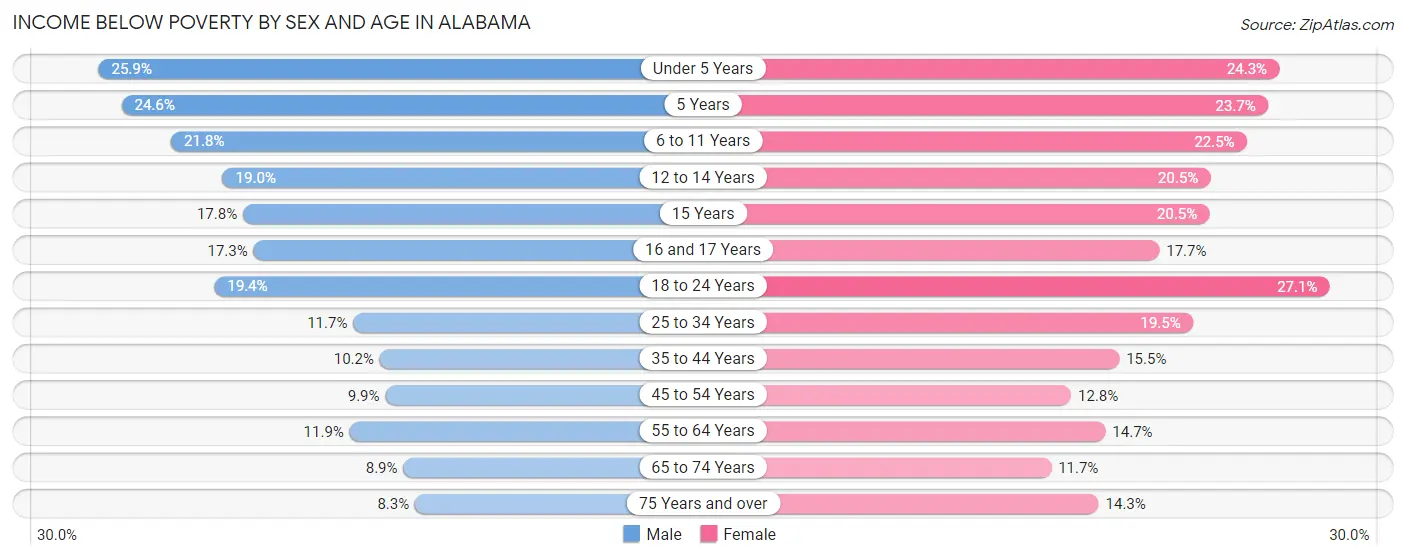
Income Below Poverty by Sex and Age in Alabama
With 13.9% poverty level for males and 17.4% for females among the residents of Alabama, under 5 year old males and 18 to 24 year old females are the most vulnerable to poverty, with 37,877 males (25.9%) and 57,263 females (27.1%) in their respective age groups living below the poverty level.
| Age Bracket | Male | Female |
| Under 5 Years | 37,877 (25.9%) | 34,013 (24.3%) |
| 5 Years | 7,211 (24.6%) | 6,780 (23.7%) |
| 6 to 11 Years | 41,060 (21.8%) | 39,939 (22.5%) |
| 12 to 14 Years | 18,394 (19.0%) | 19,433 (20.5%) |
| 15 Years | 6,010 (17.8%) | 6,219 (20.4%) |
| 16 and 17 Years | 11,110 (17.2%) | 11,195 (17.7%) |
| 18 to 24 Years | 43,043 (19.4%) | 57,263 (27.1%) |
| 25 to 34 Years | 36,441 (11.7%) | 63,603 (19.5%) |
| 35 to 44 Years | 29,814 (10.2%) | 48,322 (15.4%) |
| 45 to 54 Years | 29,659 (9.9%) | 40,438 (12.8%) |
| 55 to 64 Years | 37,654 (11.9%) | 50,364 (14.7%) |
| 65 to 74 Years | 21,119 (8.9%) | 32,088 (11.7%) |
| 75 Years and over | 11,172 (8.3%) | 28,676 (14.3%) |
| Total | 330,564 (13.9%) | 438,333 (17.4%) |
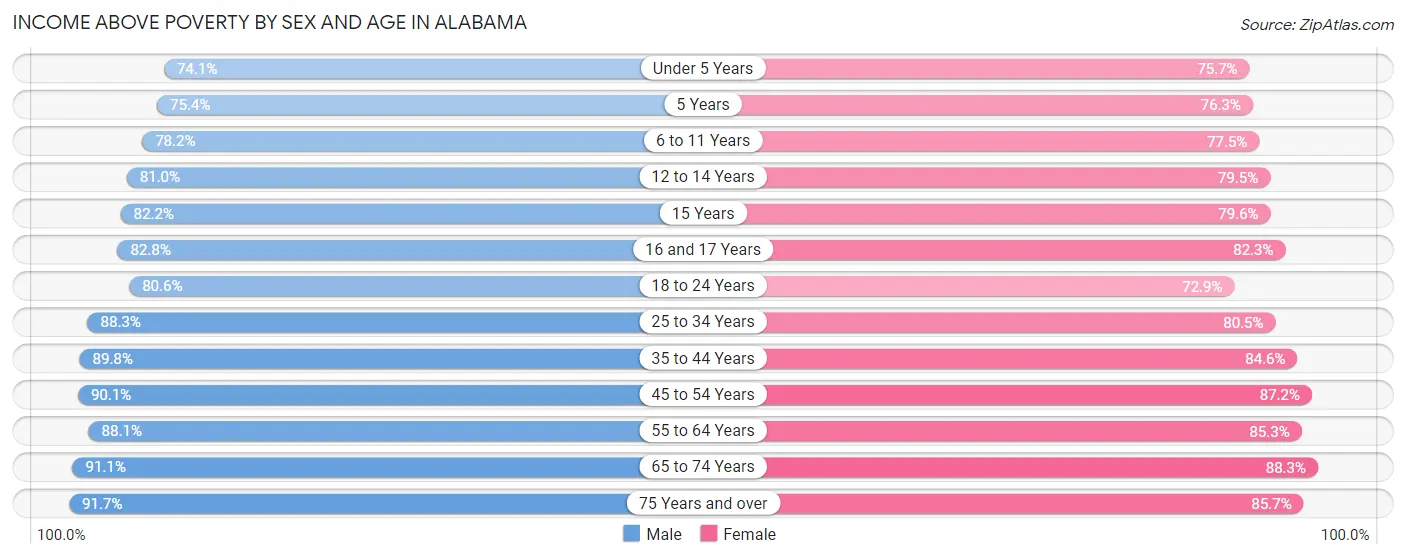
Income Above Poverty by Sex and Age in Alabama
According to the poverty statistics in Alabama, males aged 75 years and over and females aged 65 to 74 years are the age groups that are most secure financially, with 91.7% of males and 88.3% of females in these age groups living above the poverty line.
| Age Bracket | Male | Female |
| Under 5 Years | 108,499 (74.1%) | 105,732 (75.7%) |
| 5 Years | 22,098 (75.4%) | 21,820 (76.3%) |
| 6 to 11 Years | 146,902 (78.2%) | 137,319 (77.5%) |
| 12 to 14 Years | 78,595 (81.0%) | 75,320 (79.5%) |
| 15 Years | 27,673 (82.2%) | 24,191 (79.5%) |
| 16 and 17 Years | 53,299 (82.8%) | 52,143 (82.3%) |
| 18 to 24 Years | 178,430 (80.6%) | 153,742 (72.9%) |
| 25 to 34 Years | 275,001 (88.3%) | 262,059 (80.5%) |
| 35 to 44 Years | 261,977 (89.8%) | 264,538 (84.6%) |
| 45 to 54 Years | 269,474 (90.1%) | 276,146 (87.2%) |
| 55 to 64 Years | 278,790 (88.1%) | 292,764 (85.3%) |
| 65 to 74 Years | 215,898 (91.1%) | 243,161 (88.3%) |
| 75 Years and over | 124,138 (91.7%) | 171,821 (85.7%) |
| Total | 2,040,774 (86.1%) | 2,080,756 (82.6%) |
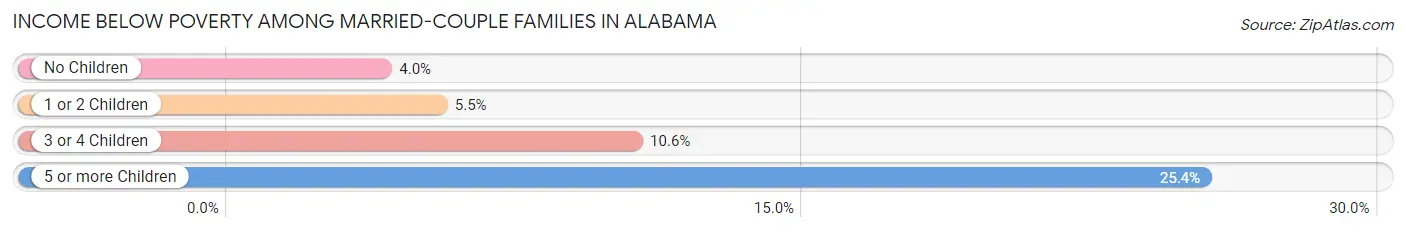
Income Below Poverty Among Married-Couple Families in Alabama
The poverty statistics for married-couple families in Alabama show that 5.1% or 45,948 of the total 906,990 families live below the poverty line. Families with 5 or more children have the highest poverty rate of 25.4%, comprising of 1,269 families. On the other hand, families with no children have the lowest poverty rate of 4.0%, which includes 22,371 families.
| Children | Above Poverty | Below Poverty |
| No Children | 532,675 (96.0%) | 22,371 (4.0%) |
| 1 or 2 Children | 266,631 (94.5%) | 15,447 (5.5%) |
| 3 or 4 Children | 58,015 (89.4%) | 6,861 (10.6%) |
| 5 or more Children | 3,721 (74.6%) | 1,269 (25.4%) |
| Total | 861,042 (94.9%) | 45,948 (5.1%) |
Income Below Poverty Among Single-Parent Households in Alabama
According to the poverty data in Alabama, 15.6% or 12,833 single-father households and 31.1% or 83,026 single-mother households are living below the poverty line. Among single-father households, those with 5 or more children have the highest poverty rate, with 254 households (35.0%) experiencing poverty. Likewise, among single-mother households, those with 5 or more children have the highest poverty rate, with 1,876 households (78.3%) falling below the poverty line.
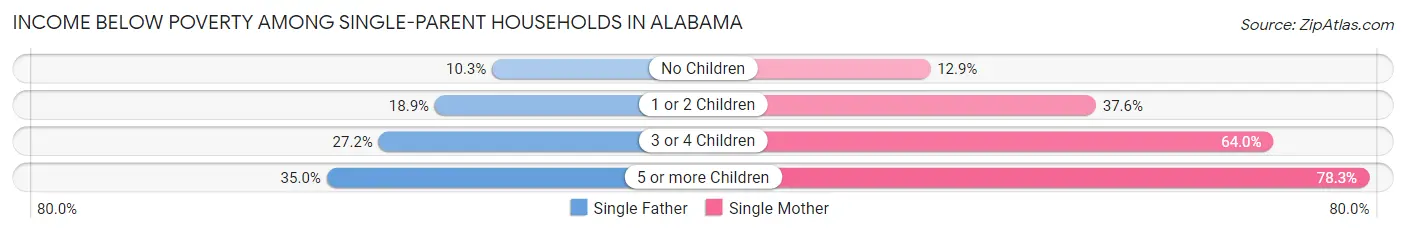
| Children | Single Father | Single Mother |
| No Children | 3,924 (10.3%) | 13,350 (12.9%) |
| 1 or 2 Children | 7,108 (18.9%) | 49,976 (37.6%) |
| 3 or 4 Children | 1,547 (27.2%) | 17,824 (64.0%) |
| 5 or more Children | 254 (35.0%) | 1,876 (78.3%) |
| Total | 12,833 (15.6%) | 83,026 (31.1%) |
Income Below Poverty Among Married-Couple vs Single-Parent Households in Alabama
The poverty data for Alabama shows that 45,948 of the married-couple family households (5.1%) and 95,859 of the single-parent households (27.5%) are living below the poverty level. Within the married-couple family households, those with 5 or more children have the highest poverty rate, with 1,269 households (25.4%) falling below the poverty line. Among the single-parent households, those with 5 or more children have the highest poverty rate, with 2,130 household (68.2%) living below poverty.
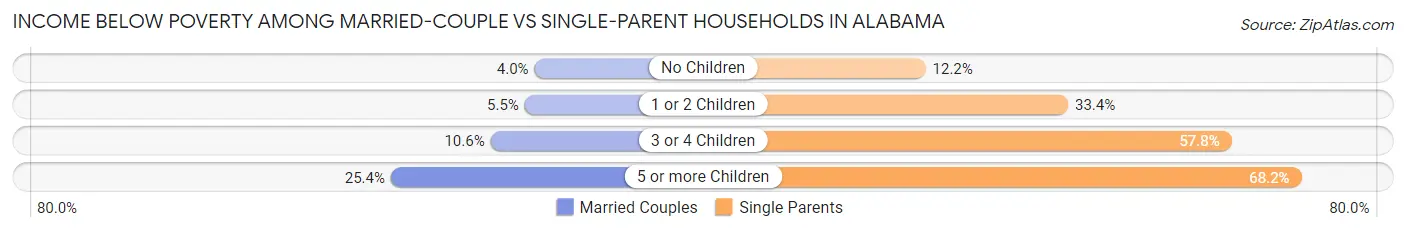
| Children | Married-Couple Families | Single-Parent Households |
| No Children | 22,371 (4.0%) | 17,274 (12.2%) |
| 1 or 2 Children | 15,447 (5.5%) | 57,084 (33.4%) |
| 3 or 4 Children | 6,861 (10.6%) | 19,371 (57.8%) |
| 5 or more Children | 1,269 (25.4%) | 2,130 (68.2%) |
| Total | 45,948 (5.1%) | 95,859 (27.5%) |
Largest Zip Codes by Population in Alabama
The largest zip codes in Alabama by population are 35242 (56,466), 36117 (53,559), 36695 (51,877), 35405 (49,196), and 35758 (48,043).
1.35242
56,466 (1.12%)
2.36117
53,559 (1.07%)
3.36695
51,877 (1.03%)
4.35405
49,196 (0.98%)
5.35758
48,043 (0.96%)
6.36830
47,050 (0.94%)
7.35215
46,738 (0.93%)
8.36116
45,445 (0.90%)
9.35401
39,168 (0.78%)
10.36330
38,461 (0.76%)
11.35216
38,352 (0.76%)
12.36301
38,101 (0.76%)
13.35226
38,079 (0.76%)
14.36535
37,703 (0.75%)
15.35244
36,783 (0.73%)
16.36608
36,281 (0.72%)
17.36532
35,824 (0.71%)
18.35601
34,817 (0.69%)
19.36526
34,611 (0.69%)
20.35630
33,252 (0.66%)
21.35603
32,372 (0.64%)
22.35810
31,668 (0.63%)
23.35173
31,103 (0.62%)
24.36303
30,390 (0.60%)
25.35209
29,884 (0.59%)
26.36832
28,917 (0.58%)
27.35811
28,841 (0.57%)
28.35611
28,375 (0.56%)
29.35803
28,210 (0.56%)
30.35749
28,121 (0.56%)
Largest Cities by Population in Alabama
The largest cities in Alabama by population are Huntsville (215,025), Birmingham (200,431), Montgomery (199,819), Mobile (186,316), and Tuscaloosa (105,797).
215,025 (4.28%)
200,431 (3.99%)
199,819 (3.97%)
4.Mobile
186,316 (3.71%)
105,797 (2.10%)
6.Hoover
91,995 (1.83%)
7.Auburn
76,660 (1.52%)
8.Dothan
70,699 (1.41%)
9.Decatur
57,525 (1.14%)
10.Madison
56,967 (1.13%)
11.Florence
40,781 (0.81%)
38,600 (0.77%)
13.Phenix City
38,413 (0.76%)
14.Prattville
38,124 (0.76%)
15.Gadsden
33,881 (0.67%)
16.Alabaster
33,417 (0.66%)
17.Opelika
31,361 (0.62%)
18.Northport
30,714 (0.61%)
19.Enterprise
28,513 (0.57%)
20.Daphne
27,861 (0.55%)
21.Homewood
27,557 (0.55%)
22.Athens
26,179 (0.52%)
23.Bessemer
25,890 (0.51%)
24.Trussville
25,621 (0.51%)
25.Pelham
24,221 (0.48%)
26.Fairhope
22,605 (0.45%)
27.Albertville
22,433 (0.45%)
22,259 (0.44%)
29.Oxford
22,019 (0.44%)
30.Anniston
21,502 (0.43%)
Largest Counties by Population in Alabama
The largest counties in Alabama by population are Jefferson County (672,265), Mobile County (413,878), Madison County (389,781), Baldwin County (233,420), and Tuscaloosa County (231,558).
672,265 (13.37%)
413,878 (8.23%)
389,781 (7.75%)
233,420 (4.64%)
231,558 (4.61%)
228,132 (4.54%)
223,916 (4.45%)
175,126 (3.48%)
123,102 (2.45%)
116,162 (2.31%)
107,040 (2.13%)
104,199 (2.07%)
103,348 (2.06%)
97,923 (1.95%)
94,329 (1.88%)
91,719 (1.82%)
88,284 (1.76%)
87,694 (1.74%)
81,105 (1.61%)
71,680 (1.43%)
64,978 (1.29%)
59,077 (1.17%)
58,849 (1.17%)
58,761 (1.17%)
57,270 (1.14%)
53,559 (1.07%)
52,618 (1.05%)
28.Dale County
49,455 (0.98%)
45,140 (0.90%)
41,251 (0.82%)
Race in Alabama
The most populous races in Alabama are White / Caucasian (3,329,012 | 66.2%), Black / African American (1,326,341 | 26.4%), and Hispanic or Latino (232,407 | 4.6%).
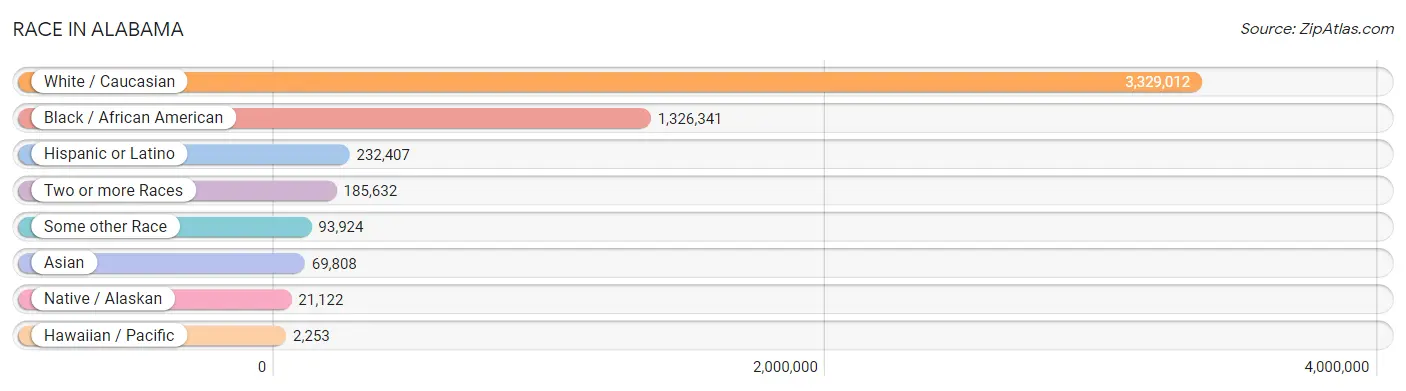
| Race | # Population | % Population |
| Asian | 69,808 | 1.4% |
| Black / African American | 1,326,341 | 26.4% |
| Hawaiian / Pacific | 2,253 | 0.0% |
| Hispanic or Latino | 232,407 | 4.6% |
| Native / Alaskan | 21,122 | 0.4% |
| White / Caucasian | 3,329,012 | 66.2% |
| Two or more Races | 185,632 | 3.7% |
| Some other Race | 93,924 | 1.9% |
| Total | 5,028,092 | 100.0% |
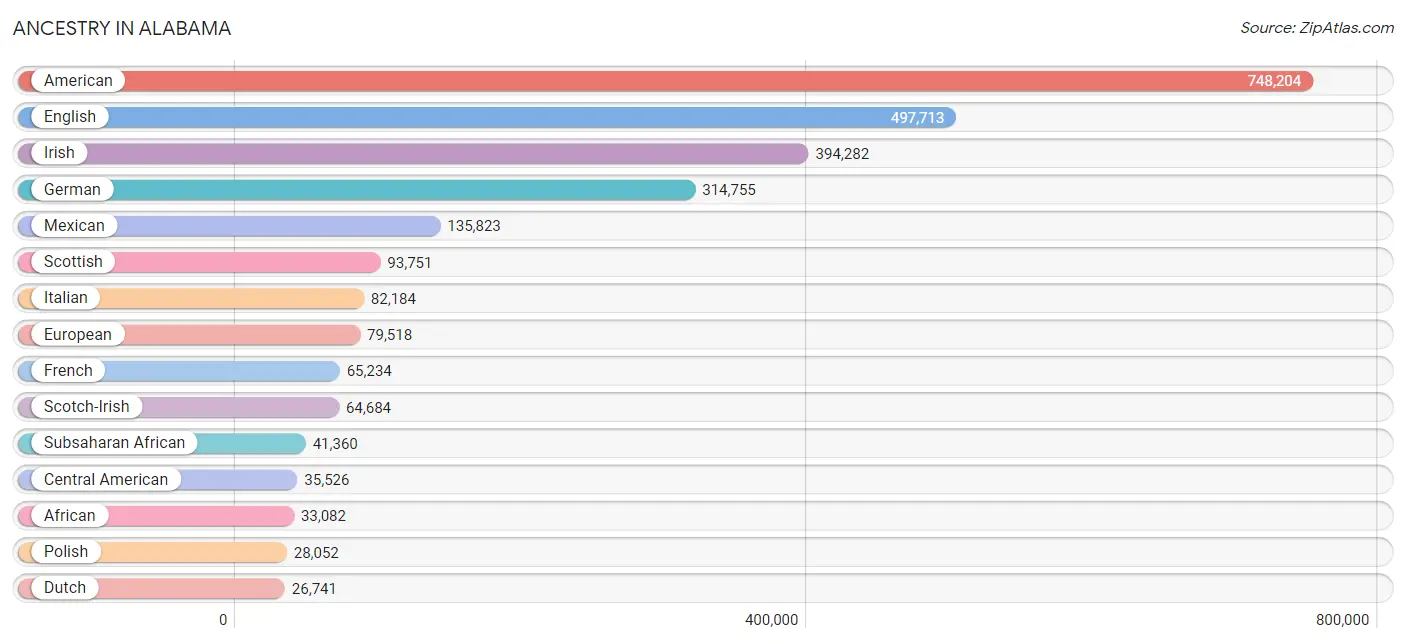
Ancestry in Alabama
The most populous ancestries reported in Alabama are American (748,204 | 14.9%), English (497,713 | 9.9%), Irish (394,282 | 7.8%), German (314,755 | 6.3%), and Mexican (135,823 | 2.7%), together accounting for 41.6% of all Alabama residents.
| Ancestry | # Population | % Population |
| Afghan | 213 | 0.0% |
| African | 33,082 | 0.7% |
| Alaska Native | 164 | 0.0% |
| Albanian | 170 | 0.0% |
| Aleut | 128 | 0.0% |
| American | 748,204 | 14.9% |
| Apache | 606 | 0.0% |
| Arab | 13,718 | 0.3% |
| Arapaho | 19 | 0.0% |
| Argentinean | 941 | 0.0% |
| Armenian | 291 | 0.0% |
| Assyrian / Chaldean / Syriac | 61 | 0.0% |
| Australian | 398 | 0.0% |
| Austrian | 2,798 | 0.1% |
| Bahamian | 394 | 0.0% |
| Bangladeshi | 116 | 0.0% |
| Barbadian | 215 | 0.0% |
| Basque | 90 | 0.0% |
| Belgian | 1,105 | 0.0% |
| Belizean | 209 | 0.0% |
| Bermudan | 474 | 0.0% |
| Bhutanese | 7,273 | 0.1% |
| Blackfeet | 2,034 | 0.0% |
| Bolivian | 135 | 0.0% |
| Brazilian | 2,172 | 0.0% |
| British | 26,151 | 0.5% |
| British West Indian | 190 | 0.0% |
| Bulgarian | 442 | 0.0% |
| Burmese | 16,286 | 0.3% |
| Cajun | 1,230 | 0.0% |
| Cambodian | 22 | 0.0% |
| Canadian | 3,402 | 0.1% |
| Cape Verdean | 52 | 0.0% |
| Carpatho Rusyn | 12 | 0.0% |
| Celtic | 659 | 0.0% |
| Central American | 35,526 | 0.7% |
| Central American Indian | 3,083 | 0.1% |
| Cherokee | 25,646 | 0.5% |
| Cheyenne | 52 | 0.0% |
| Chickasaw | 400 | 0.0% |
| Chilean | 871 | 0.0% |
| Chinese | 8 | 0.0% |
| Chippewa | 399 | 0.0% |
| Choctaw | 4,452 | 0.1% |
| Colombian | 2,979 | 0.1% |
| Comanche | 64 | 0.0% |
| Costa Rican | 498 | 0.0% |
| Cree | 64 | 0.0% |
| Creek | 6,236 | 0.1% |
| Croatian | 1,306 | 0.0% |
| Crow | 91 | 0.0% |
| Cuban | 7,576 | 0.2% |
| Cypriot | 26 | 0.0% |
| Czech | 4,865 | 0.1% |
| Czechoslovakian | 1,179 | 0.0% |
| Danish | 5,205 | 0.1% |
| Delaware | 19 | 0.0% |
| Dominican | 3,081 | 0.1% |
| Dutch | 26,741 | 0.5% |
| Dutch West Indian | 172 | 0.0% |
| Eastern European | 5,149 | 0.1% |
| Ecuadorian | 831 | 0.0% |
| Egyptian | 946 | 0.0% |
| English | 497,713 | 9.9% |
| Estonian | 98 | 0.0% |
| Ethiopian | 382 | 0.0% |
| European | 79,518 | 1.6% |
| Fijian | 107 | 0.0% |
| Filipino | 913 | 0.0% |
| Finnish | 3,072 | 0.1% |
| French | 65,234 | 1.3% |
| French American Indian | 101 | 0.0% |
| French Canadian | 8,035 | 0.2% |
| German | 314,755 | 6.3% |
| German Russian | 176 | 0.0% |
| Ghanaian | 232 | 0.0% |
| Greek | 8,421 | 0.2% |
| Guamanian / Chamorro | 762 | 0.0% |
| Guatemalan | 22,309 | 0.4% |
| Guyanese | 157 | 0.0% |
| Haitian | 2,622 | 0.1% |
| Hmong | 5 | 0.0% |
| Honduran | 5,191 | 0.1% |
| Hopi | 3 | 0.0% |
| Houma | 49 | 0.0% |
| Hungarian | 5,739 | 0.1% |
| Icelander | 161 | 0.0% |
| Indian (Asian) | 16,465 | 0.3% |
| Indonesian | 120 | 0.0% |
| Inupiat | 133 | 0.0% |
| Iranian | 1,881 | 0.0% |
| Iraqi | 127 | 0.0% |
| Irish | 394,282 | 7.8% |
| Iroquois | 462 | 0.0% |
| Israeli | 247 | 0.0% |
| Italian | 82,184 | 1.6% |
| Jamaican | 6,082 | 0.1% |
| Japanese | 1,122 | 0.0% |
| Jordanian | 142 | 0.0% |
| Kenyan | 1,070 | 0.0% |
| Korean | 13,708 | 0.3% |
| Laotian | 913 | 0.0% |
| Latvian | 629 | 0.0% |
| Lebanese | 5,199 | 0.1% |
| Liberian | 116 | 0.0% |
| Lithuanian | 1,877 | 0.0% |
| Lumbee | 169 | 0.0% |
| Luxembourger | 48 | 0.0% |
| Macedonian | 161 | 0.0% |
| Malaysian | 1,257 | 0.0% |
| Maltese | 56 | 0.0% |
| Menominee | 9 | 0.0% |
| Mexican | 135,823 | 2.7% |
| Mexican American Indian | 3,180 | 0.1% |
| Mongolian | 440 | 0.0% |
| Moroccan | 1,384 | 0.0% |
| Native Hawaiian | 3,526 | 0.1% |
| Navajo | 661 | 0.0% |
| New Zealander | 178 | 0.0% |
| Nicaraguan | 679 | 0.0% |
| Nigerian | 4,075 | 0.1% |
| Northern European | 4,297 | 0.1% |
| Norwegian | 16,712 | 0.3% |
| Okinawan | 13 | 0.0% |
| Osage | 82 | 0.0% |
| Ottawa | 69 | 0.0% |
| Pakistani | 3,219 | 0.1% |
| Palestinian | 1,410 | 0.0% |
| Panamanian | 2,054 | 0.0% |
| Paraguayan | 67 | 0.0% |
| Pennsylvania German | 469 | 0.0% |
| Peruvian | 1,696 | 0.0% |
| Polish | 28,052 | 0.6% |
| Portuguese | 4,688 | 0.1% |
| Potawatomi | 197 | 0.0% |
| Pueblo | 265 | 0.0% |
| Puerto Rican | 23,379 | 0.5% |
| Puget Sound Salish | 33 | 0.0% |
| Romanian | 1,838 | 0.0% |
| Russian | 7,340 | 0.2% |
| Salvadoran | 4,493 | 0.1% |
| Samoan | 619 | 0.0% |
| Scandinavian | 8,893 | 0.2% |
| Scotch-Irish | 64,684 | 1.3% |
| Scottish | 93,751 | 1.9% |
| Seminole | 372 | 0.0% |
| Senegalese | 199 | 0.0% |
| Serbian | 454 | 0.0% |
| Shoshone | 21 | 0.0% |
| Sierra Leonean | 119 | 0.0% |
| Sioux | 653 | 0.0% |
| Slavic | 861 | 0.0% |
| Slovak | 1,853 | 0.0% |
| Slovene | 284 | 0.0% |
| Somali | 18 | 0.0% |
| South African | 723 | 0.0% |
| South American | 9,878 | 0.2% |
| South American Indian | 308 | 0.0% |
| Spaniard | 3,671 | 0.1% |
| Spanish | 2,970 | 0.1% |
| Spanish American | 96 | 0.0% |
| Spanish American Indian | 112 | 0.0% |
| Sri Lankan | 11,876 | 0.2% |
| Subsaharan African | 41,360 | 0.8% |
| Sudanese | 28 | 0.0% |
| Swedish | 14,872 | 0.3% |
| Swiss | 4,508 | 0.1% |
| Syrian | 1,051 | 0.0% |
| Thai | 16,221 | 0.3% |
| Tlingit-Haida | 25 | 0.0% |
| Tohono O'Odham | 2 | 0.0% |
| Tongan | 158 | 0.0% |
| Trinidadian and Tobagonian | 682 | 0.0% |
| Turkish | 909 | 0.0% |
| U.S. Virgin Islander | 223 | 0.0% |
| Ugandan | 82 | 0.0% |
| Ukrainian | 3,059 | 0.1% |
| Uruguayan | 47 | 0.0% |
| Ute | 38 | 0.0% |
| Venezuelan | 2,198 | 0.0% |
| Vietnamese | 647 | 0.0% |
| Welsh | 21,709 | 0.4% |
| West Indian | 1,999 | 0.0% |
| Yugoslavian | 744 | 0.0% |
| Yup'ik | 21 | 0.0% |
| Zimbabwean | 10 | 0.0% | View All 186 Rows |
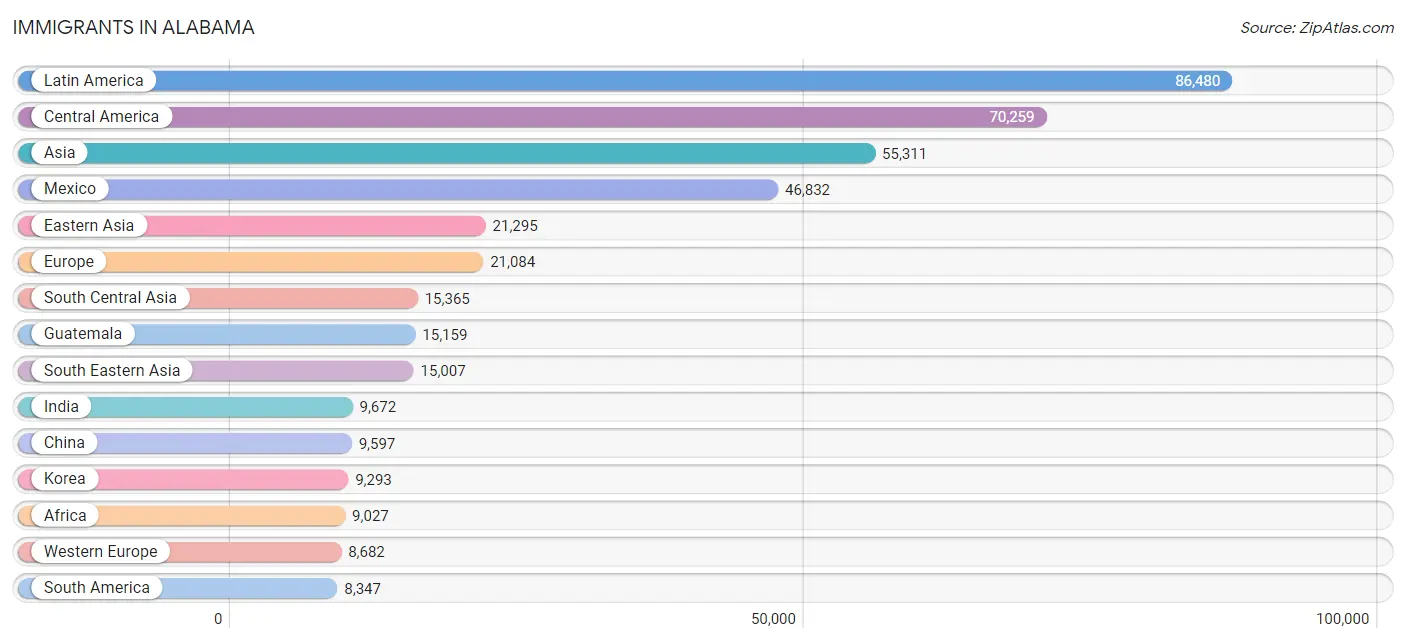
Immigrants in Alabama
The most numerous immigrant groups reported in Alabama came from Latin America (86,480 | 1.7%), Central America (70,259 | 1.4%), Asia (55,311 | 1.1%), Mexico (46,832 | 0.9%), and Eastern Asia (21,295 | 0.4%), together accounting for 5.6% of all Alabama residents.
| Immigration Origin | # Population | % Population |
| Afghanistan | 64 | 0.0% |
| Africa | 9,027 | 0.2% |
| Argentina | 261 | 0.0% |
| Armenia | 19 | 0.0% |
| Asia | 55,311 | 1.1% |
| Australia | 368 | 0.0% |
| Austria | 229 | 0.0% |
| Azores | 7 | 0.0% |
| Bahamas | 172 | 0.0% |
| Bangladesh | 1,123 | 0.0% |
| Barbados | 95 | 0.0% |
| Belarus | 117 | 0.0% |
| Belgium | 135 | 0.0% |
| Belize | 100 | 0.0% |
| Bolivia | 134 | 0.0% |
| Bosnia and Herzegovina | 225 | 0.0% |
| Brazil | 1,867 | 0.0% |
| Bulgaria | 113 | 0.0% |
| Cambodia | 515 | 0.0% |
| Cameroon | 240 | 0.0% |
| Canada | 4,000 | 0.1% |
| Caribbean | 7,874 | 0.2% |
| Central America | 70,259 | 1.4% |
| Chile | 630 | 0.0% |
| China | 9,597 | 0.2% |
| Colombia | 2,005 | 0.0% |
| Congo | 265 | 0.0% |
| Costa Rica | 342 | 0.0% |
| Croatia | 271 | 0.0% |
| Cuba | 2,134 | 0.0% |
| Czechoslovakia | 203 | 0.0% |
| Denmark | 52 | 0.0% |
| Dominican Republic | 1,182 | 0.0% |
| Eastern Africa | 2,676 | 0.1% |
| Eastern Asia | 21,295 | 0.4% |
| Eastern Europe | 5,336 | 0.1% |
| Ecuador | 416 | 0.0% |
| Egypt | 547 | 0.0% |
| El Salvador | 3,005 | 0.1% |
| England | 1,877 | 0.0% |
| Eritrea | 154 | 0.0% |
| Ethiopia | 319 | 0.0% |
| Europe | 21,084 | 0.4% |
| Fiji | 79 | 0.0% |
| France | 1,115 | 0.0% |
| Germany | 6,831 | 0.1% |
| Ghana | 212 | 0.0% |
| Greece | 155 | 0.0% |
| Grenada | 99 | 0.0% |
| Guatemala | 15,159 | 0.3% |
| Guyana | 261 | 0.0% |
| Haiti | 820 | 0.0% |
| Honduras | 3,447 | 0.1% |
| Hong Kong | 301 | 0.0% |
| Hungary | 187 | 0.0% |
| India | 9,672 | 0.2% |
| Indonesia | 404 | 0.0% |
| Iran | 927 | 0.0% |
| Iraq | 181 | 0.0% |
| Ireland | 206 | 0.0% |
| Israel | 197 | 0.0% |
| Italy | 619 | 0.0% |
| Jamaica | 2,382 | 0.1% |
| Japan | 2,391 | 0.1% |
| Jordan | 183 | 0.0% |
| Kazakhstan | 189 | 0.0% |
| Kenya | 1,389 | 0.0% |
| Korea | 9,293 | 0.2% |
| Kuwait | 129 | 0.0% |
| Laos | 451 | 0.0% |
| Latin America | 86,480 | 1.7% |
| Latvia | 102 | 0.0% |
| Lebanon | 405 | 0.0% |
| Liberia | 211 | 0.0% |
| Lithuania | 122 | 0.0% |
| Malaysia | 631 | 0.0% |
| Mexico | 46,832 | 0.9% |
| Micronesia | 99 | 0.0% |
| Middle Africa | 819 | 0.0% |
| Moldova | 275 | 0.0% |
| Morocco | 156 | 0.0% |
| Nepal | 1,235 | 0.0% |
| Netherlands | 317 | 0.0% |
| Nicaragua | 444 | 0.0% |
| Nigeria | 1,979 | 0.0% |
| North Macedonia | 55 | 0.0% |
| Northern Africa | 1,029 | 0.0% |
| Northern Europe | 5,159 | 0.1% |
| Norway | 122 | 0.0% |
| Oceania | 848 | 0.0% |
| Pakistan | 2,005 | 0.0% |
| Panama | 845 | 0.0% |
| Peru | 801 | 0.0% |
| Philippines | 5,154 | 0.1% |
| Poland | 248 | 0.0% |
| Portugal | 628 | 0.0% |
| Romania | 653 | 0.0% |
| Russia | 1,277 | 0.0% |
| Saudi Arabia | 228 | 0.0% |
| Scotland | 475 | 0.0% |
| Senegal | 125 | 0.0% |
| Serbia | 16 | 0.0% |
| Sierra Leone | 219 | 0.0% |
| Singapore | 144 | 0.0% |
| South Africa | 674 | 0.0% |
| South America | 8,347 | 0.2% |
| South Central Asia | 15,365 | 0.3% |
| South Eastern Asia | 15,007 | 0.3% |
| Southern Europe | 1,879 | 0.0% |
| Spain | 477 | 0.0% |
| Sri Lanka | 81 | 0.0% |
| St. Vincent and the Grenadines | 12 | 0.0% |
| Sudan | 195 | 0.0% |
| Sweden | 136 | 0.0% |
| Switzerland | 55 | 0.0% |
| Syria | 221 | 0.0% |
| Taiwan | 1,221 | 0.0% |
| Thailand | 1,231 | 0.0% |
| Trinidad and Tobago | 468 | 0.0% |
| Turkey | 312 | 0.0% |
| Uganda | 142 | 0.0% |
| Ukraine | 1,077 | 0.0% |
| Uruguay | 84 | 0.0% |
| Uzbekistan | 3 | 0.0% |
| Venezuela | 1,740 | 0.0% |
| Vietnam | 6,414 | 0.1% |
| West Indies | 111 | 0.0% |
| Western Africa | 3,279 | 0.1% |
| Western Asia | 3,111 | 0.1% |
| Western Europe | 8,682 | 0.2% |
| Yemen | 1,026 | 0.0% |
| Zaire | 248 | 0.0% |
| Zimbabwe | 168 | 0.0% | View All 133 Rows |
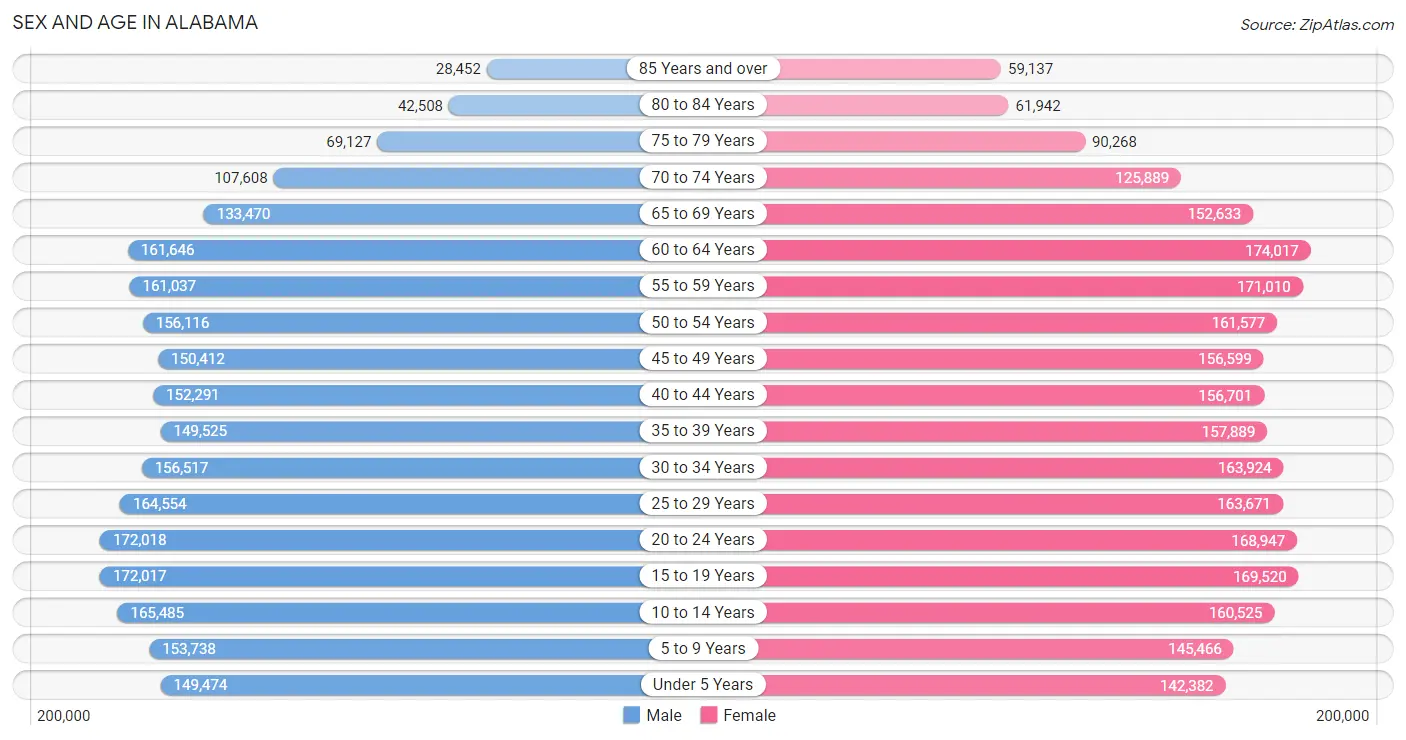
Sex and Age in Alabama
Sex and Age in Alabama
The most populous age groups in Alabama are 20 to 24 Years (172,018 | 7.0%) for men and 60 to 64 Years (174,017 | 6.7%) for women.
| Age Bracket | Male | Female |
| Under 5 Years | 149,474 (6.1%) | 142,382 (5.5%) |
| 5 to 9 Years | 153,738 (6.3%) | 145,466 (5.6%) |
| 10 to 14 Years | 165,485 (6.8%) | 160,525 (6.2%) |
| 15 to 19 Years | 172,017 (7.0%) | 169,520 (6.6%) |
| 20 to 24 Years | 172,018 (7.0%) | 168,947 (6.5%) |
| 25 to 29 Years | 164,554 (6.7%) | 163,671 (6.3%) |
| 30 to 34 Years | 156,517 (6.4%) | 163,924 (6.4%) |
| 35 to 39 Years | 149,525 (6.1%) | 157,889 (6.1%) |
| 40 to 44 Years | 152,291 (6.2%) | 156,701 (6.1%) |
| 45 to 49 Years | 150,412 (6.1%) | 156,599 (6.1%) |
| 50 to 54 Years | 156,116 (6.4%) | 161,577 (6.3%) |
| 55 to 59 Years | 161,037 (6.6%) | 171,010 (6.6%) |
| 60 to 64 Years | 161,646 (6.6%) | 174,017 (6.7%) |
| 65 to 69 Years | 133,470 (5.5%) | 152,633 (5.9%) |
| 70 to 74 Years | 107,608 (4.4%) | 125,889 (4.9%) |
| 75 to 79 Years | 69,127 (2.8%) | 90,268 (3.5%) |
| 80 to 84 Years | 42,508 (1.7%) | 61,942 (2.4%) |
| 85 Years and over | 28,452 (1.2%) | 59,137 (2.3%) |
| Total | 2,445,995 (100.0%) | 2,582,097 (100.0%) |
Families and Households in Alabama
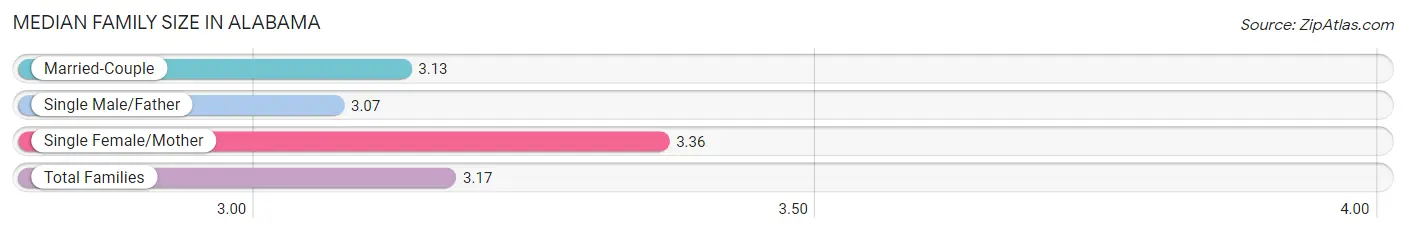
Median Family Size in Alabama
The median family size in Alabama is 3.17 persons per family, with single female/mother families (266,817 | 21.2%) accounting for the largest median family size of 3.36 persons per family. On the other hand, single male/father families (82,057 | 6.5%) represent the smallest median family size with 3.07 persons per family.
| Family Type | # Families | Family Size |
| Married-Couple | 906,990 (72.2%) | 3.13 |
| Single Male/Father | 82,057 (6.5%) | 3.07 |
| Single Female/Mother | 266,817 (21.2%) | 3.36 |
| Total Families | 1,255,864 (100.0%) | 3.17 |
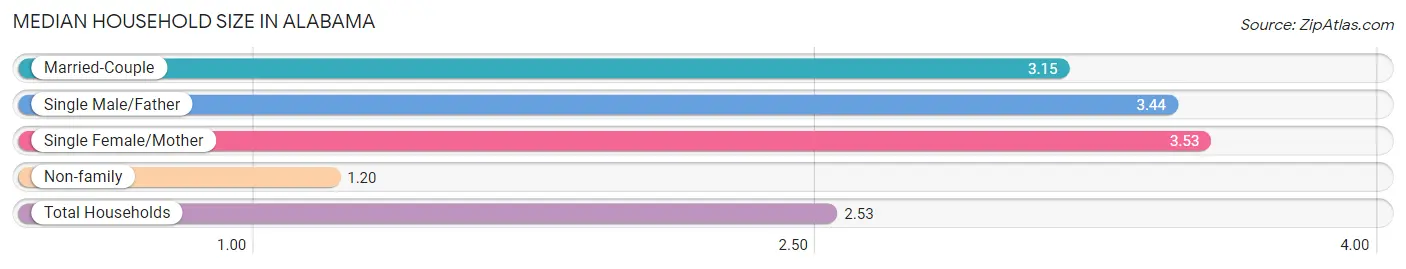
Median Household Size in Alabama
The median household size in Alabama is 2.53 persons per household, with single female/mother households (266,817 | 13.8%) accounting for the largest median household size of 3.53 persons per household. non-family households (677,286 | 35.0%) represent the smallest median household size with 1.20 persons per household.
| Household Type | # Households | Household Size |
| Married-Couple | 906,990 (46.9%) | 3.15 |
| Single Male/Father | 82,057 (4.2%) | 3.44 |
| Single Female/Mother | 266,817 (13.8%) | 3.53 |
| Non-family | 677,286 (35.0%) | 1.20 |
| Total Households | 1,933,150 (100.0%) | 2.53 |
Household Size by Marriage Status in Alabama
Out of a total of 1,933,150 households in Alabama, 1,255,864 (65.0%) are family households, while 677,286 (35.0%) are nonfamily households. The most numerous type of family households are 2-person households, comprising 595,556, and the most common type of nonfamily households are 1-person households, comprising 587,279.
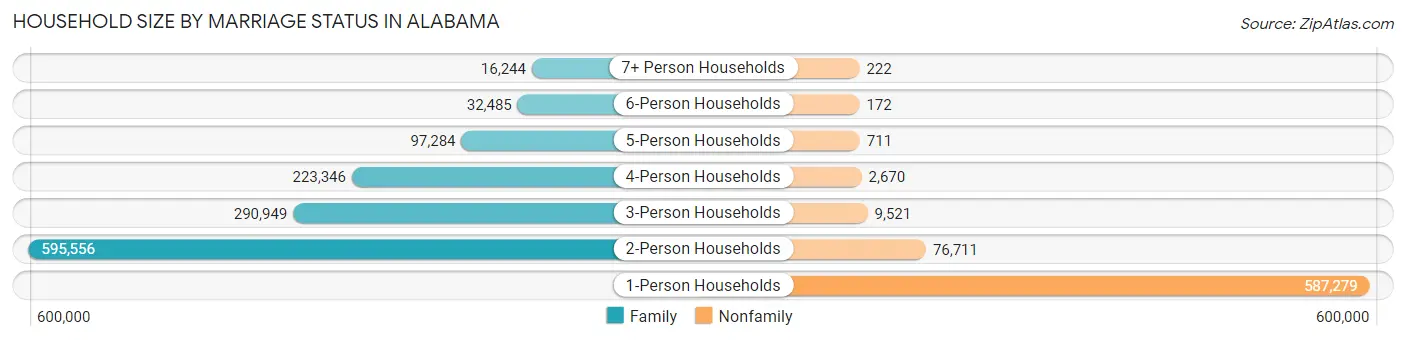
| Household Size | Family Households | Nonfamily Households |
| 1-Person Households | - | 587,279 (30.4%) |
| 2-Person Households | 595,556 (30.8%) | 76,711 (4.0%) |
| 3-Person Households | 290,949 (15.0%) | 9,521 (0.5%) |
| 4-Person Households | 223,346 (11.6%) | 2,670 (0.1%) |
| 5-Person Households | 97,284 (5.0%) | 711 (0.0%) |
| 6-Person Households | 32,485 (1.7%) | 172 (0.0%) |
| 7+ Person Households | 16,244 (0.8%) | 222 (0.0%) |
| Total | 1,255,864 (65.0%) | 677,286 (35.0%) |
Female Fertility in Alabama
Fertility by Age in Alabama
Average fertility rate in Alabama is 51.0 births per 1,000 women. Women in the age bracket of 20 to 34 years have the highest fertility rate with 95.0 births per 1,000 women. Women in the age bracket of 20 to 34 years acount for 78.5% of all women with births.
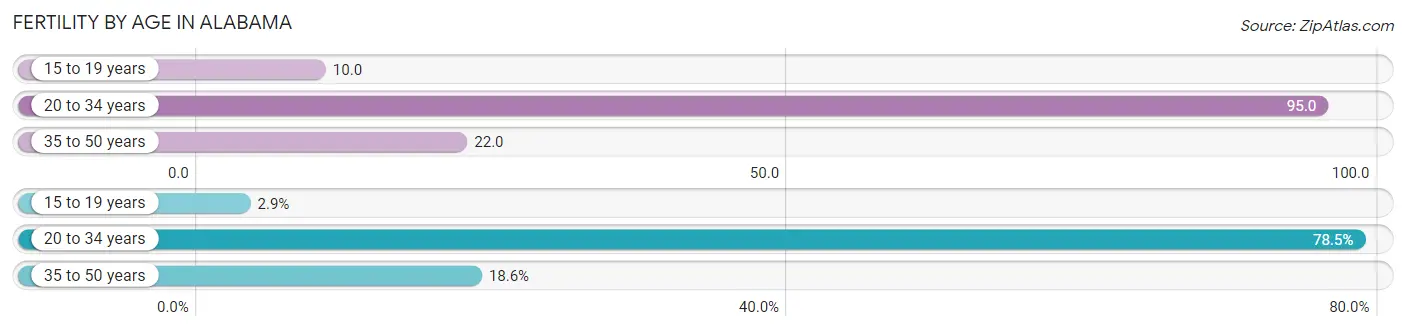
| Age Bracket | Women with Births | Births / 1,000 Women |
| 15 to 19 years | 1,728 (2.9%) | 10.0 |
| 20 to 34 years | 46,965 (78.5%) | 95.0 |
| 35 to 50 years | 11,122 (18.6%) | 22.0 |
| Total | 59,815 (100.0%) | 51.0 |
Fertility by Age by Marriage Status in Alabama
61.3% of women with births (59,815) in Alabama are married. The highest percentage of unmarried women with births falls into 15 to 19 years age bracket with 85.8% of them unmarried at the time of birth, while the lowest percentage of unmarried women with births belong to 35 to 50 years age bracket with 22.4% of them unmarried.
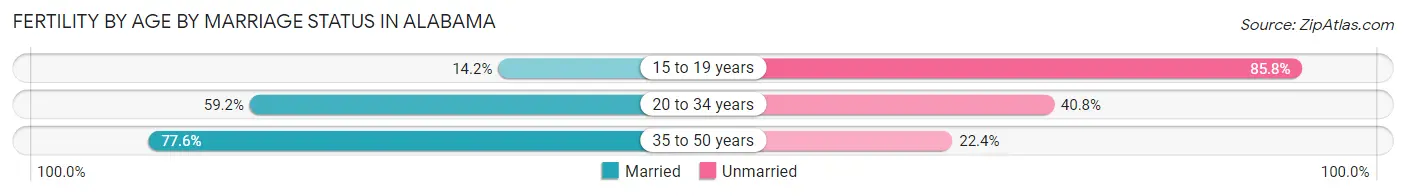
| Age Bracket | Married | Unmarried |
| 15 to 19 years | 245 (14.2%) | 1,483 (85.8%) |
| 20 to 34 years | 27,803 (59.2%) | 19,162 (40.8%) |
| 35 to 50 years | 8,631 (77.6%) | 2,491 (22.4%) |
| Total | 36,667 (61.3%) | 23,148 (38.7%) |
Fertility by Education in Alabama
Average fertility rate in Alabama is 51.0 births per 1,000 women. Women with the education attainment of bachelor's degree have the highest fertility rate of 55.0 births per 1,000 women, while women with the education attainment of less than high school have the lowest fertility at 35.0 births per 1,000 women. Women with the education attainment of college or associate's degree represent 35.6% of all women with births.
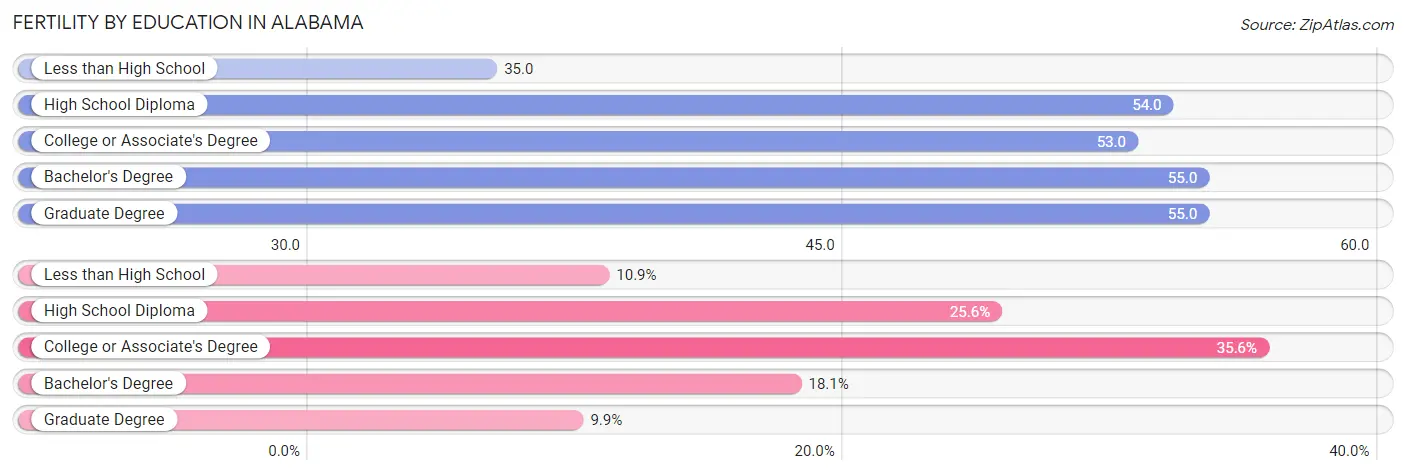
| Educational Attainment | Women with Births | Births / 1,000 Women |
| Less than High School | 6,504 (10.9%) | 35.0 |
| High School Diploma | 15,298 (25.6%) | 54.0 |
| College or Associate's Degree | 21,285 (35.6%) | 53.0 |
| Bachelor's Degree | 10,806 (18.1%) | 55.0 |
| Graduate Degree | 5,922 (9.9%) | 55.0 |
| Total | 59,815 (100.0%) | 51.0 |
Fertility by Education by Marriage Status in Alabama
38.7% of women with births in Alabama are unmarried. Women with the educational attainment of graduate degree are most likely to be married with 91.9% of them married at childbirth, while women with the educational attainment of less than high school are least likely to be married with 59.6% of them unmarried at childbirth.
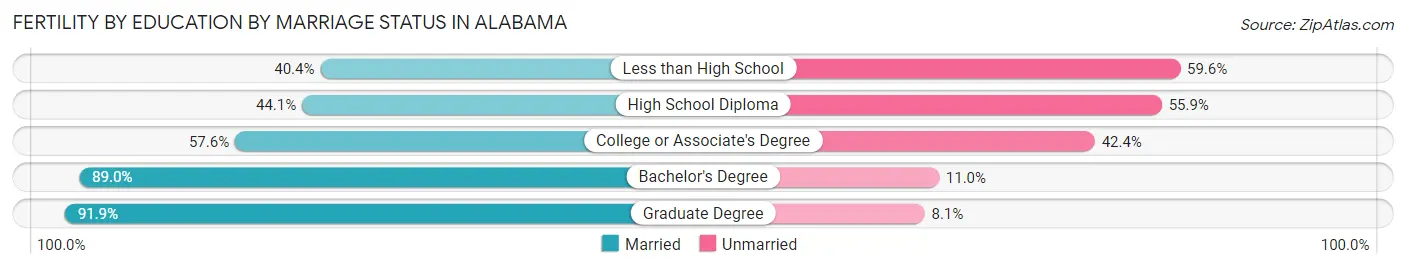
| Educational Attainment | Married | Unmarried |
| Less than High School | 2,628 (40.4%) | 3,876 (59.6%) |
| High School Diploma | 6,746 (44.1%) | 8,552 (55.9%) |
| College or Associate's Degree | 12,260 (57.6%) | 9,025 (42.4%) |
| Bachelor's Degree | 9,617 (89.0%) | 1,189 (11.0%) |
| Graduate Degree | 5,442 (91.9%) | 480 (8.1%) |
| Total | 36,667 (61.3%) | 23,148 (38.7%) |
Employment Characteristics in Alabama
Employment by Class of Employer in Alabama
Among the 2,183,677 employed individuals in Alabama, private company employees (1,478,682 | 67.7%), local government employees (148,878 | 6.8%), and not-for-profit organizations (146,441 | 6.7%) make up the most common classes of employment.
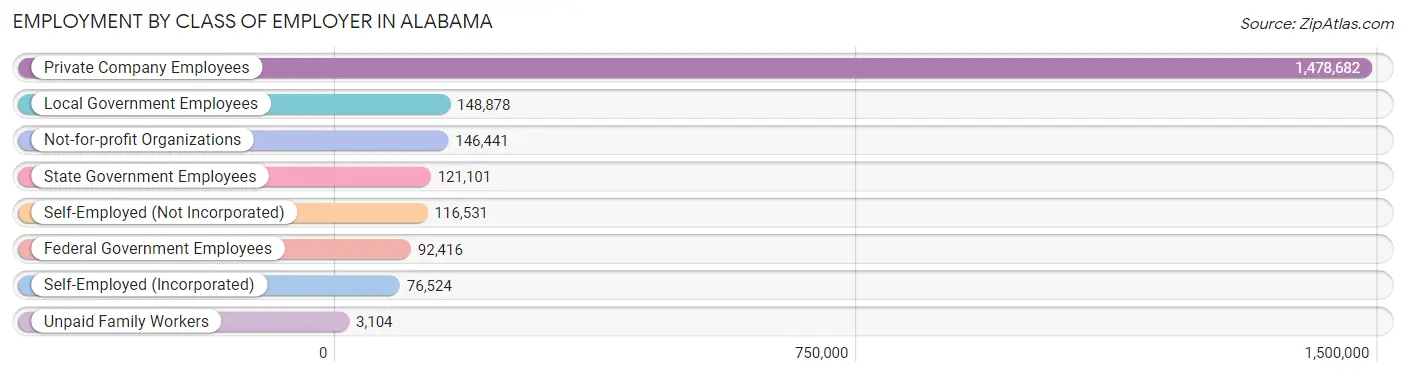
| Employer Class | # Employees | % Employees |
| Private Company Employees | 1,478,682 | 67.7% |
| Self-Employed (Incorporated) | 76,524 | 3.5% |
| Self-Employed (Not Incorporated) | 116,531 | 5.3% |
| Not-for-profit Organizations | 146,441 | 6.7% |
| Local Government Employees | 148,878 | 6.8% |
| State Government Employees | 121,101 | 5.6% |
| Federal Government Employees | 92,416 | 4.2% |
| Unpaid Family Workers | 3,104 | 0.1% |
| Total | 2,183,677 | 100.0% |
Employment Status by Age in Alabama
According to the labor force statistics for Alabama, out of the total population over 16 years of age (4,046,614), 58.0% or 2,347,036 individuals are in the labor force, with 5.2% or 122,046 of them unemployed. The age group with the highest labor force participation rate is 25 to 29 years, with 80.6% or 264,549 individuals in the labor force. Within the labor force, the 16 to 19 years age range has the highest percentage of unemployed individuals, with 14.8% or 15,052 of them being unemployed.
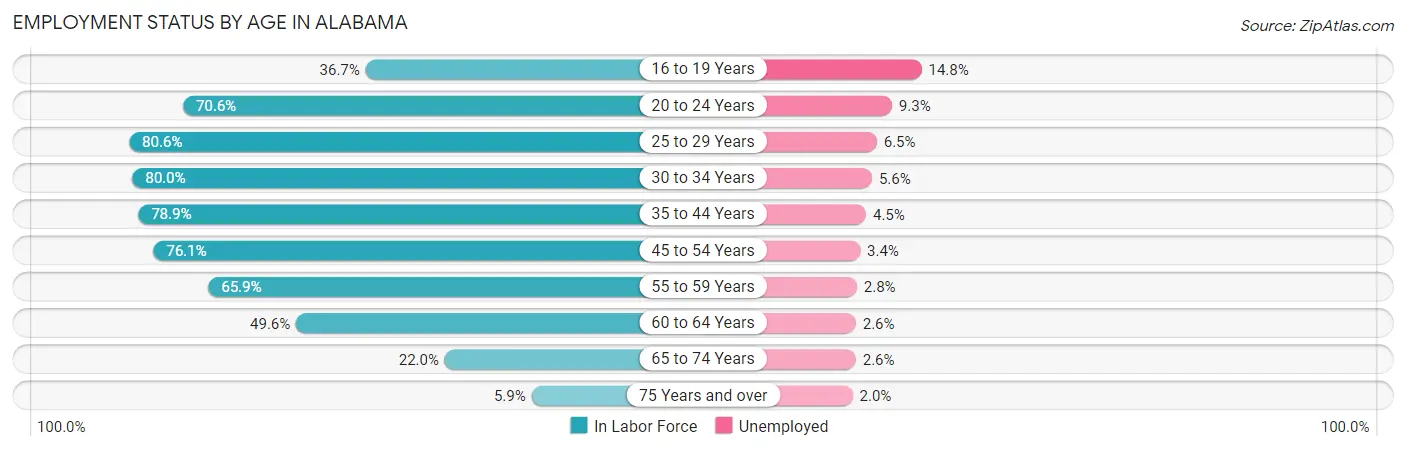
| Age Bracket | In Labor Force | Unemployed |
| 16 to 19 Years | 101,706 (36.7%) | 15,052 (14.8%) |
| 20 to 24 Years | 240,721 (70.6%) | 22,387 (9.3%) |
| 25 to 29 Years | 264,549 (80.6%) | 17,196 (6.5%) |
| 30 to 34 Years | 256,353 (80.0%) | 14,356 (5.6%) |
| 35 to 44 Years | 486,344 (78.9%) | 21,885 (4.5%) |
| 45 to 54 Years | 475,400 (76.1%) | 16,164 (3.4%) |
| 55 to 59 Years | 218,819 (65.9%) | 6,127 (2.8%) |
| 60 to 64 Years | 166,489 (49.6%) | 4,329 (2.6%) |
| 65 to 74 Years | 114,312 (22.0%) | 2,972 (2.6%) |
| 75 Years and over | 20,735 (5.9%) | 415 (2.0%) |
| Total | 2,347,036 (58.0%) | 122,046 (5.2%) |
Employment Status by Educational Attainment in Alabama
According to labor force statistics for Alabama, 73.0% of individuals (1,866,965) out of the total population between 25 and 64 years of age (2,557,486) are in the labor force, with 4.3% or 80,279 of them being unemployed. The group with the highest labor force participation rate are those with the educational attainment of bachelor's degree or higher, with 85.2% or 614,525 individuals in the labor force. Within the labor force, individuals with less than high school education have the highest percentage of unemployment, with 10.1% or 14,644 of them being unemployed.
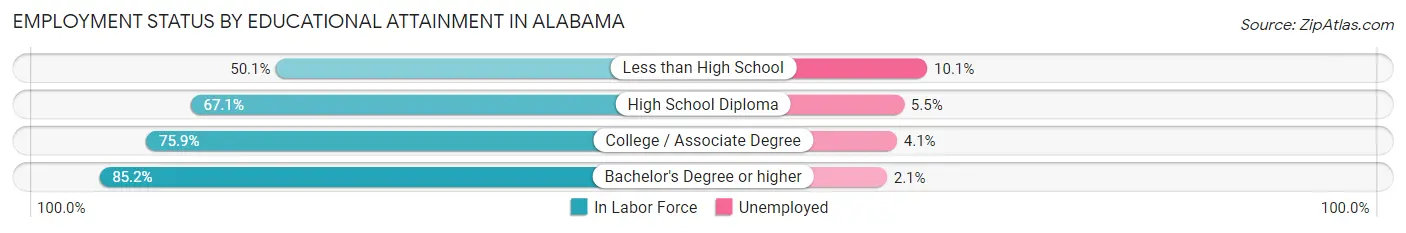
| Educational Attainment | In Labor Force | Unemployed |
| Less than High School | 144,990 (50.1%) | 29,230 (10.1%) |
| High School Diploma | 499,566 (67.1%) | 40,948 (5.5%) |
| College / Associate Degree | 608,947 (75.9%) | 32,894 (4.1%) |
| Bachelor's Degree or higher | 614,525 (85.2%) | 15,147 (2.1%) |
| Total | 1,866,965 (73.0%) | 109,972 (4.3%) |
Employment Occupations by Sex in Alabama
Management, Business, Science and Arts Occupations
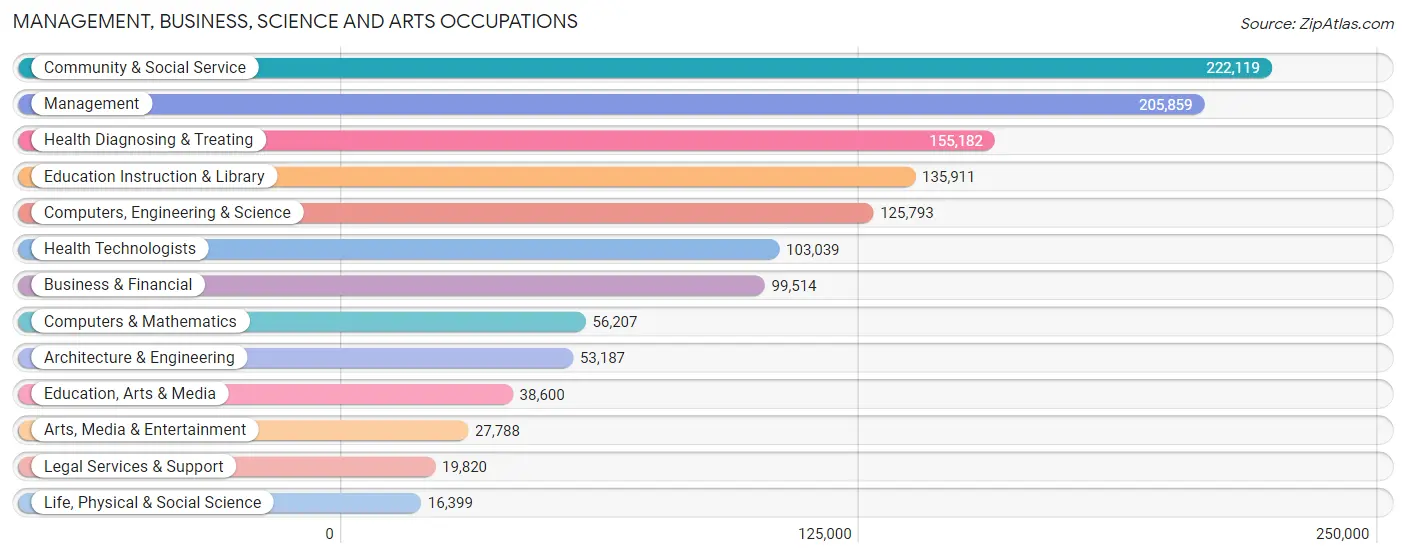
The most common Management, Business, Science and Arts occupations in Alabama are Community & Social Service (222,119 | 10.1%), Management (205,859 | 9.3%), Health Diagnosing & Treating (155,182 | 7.0%), Education Instruction & Library (135,911 | 6.1%), and Computers, Engineering & Science (125,793 | 5.7%).
Management, Business, Science and Arts Occupations by Sex
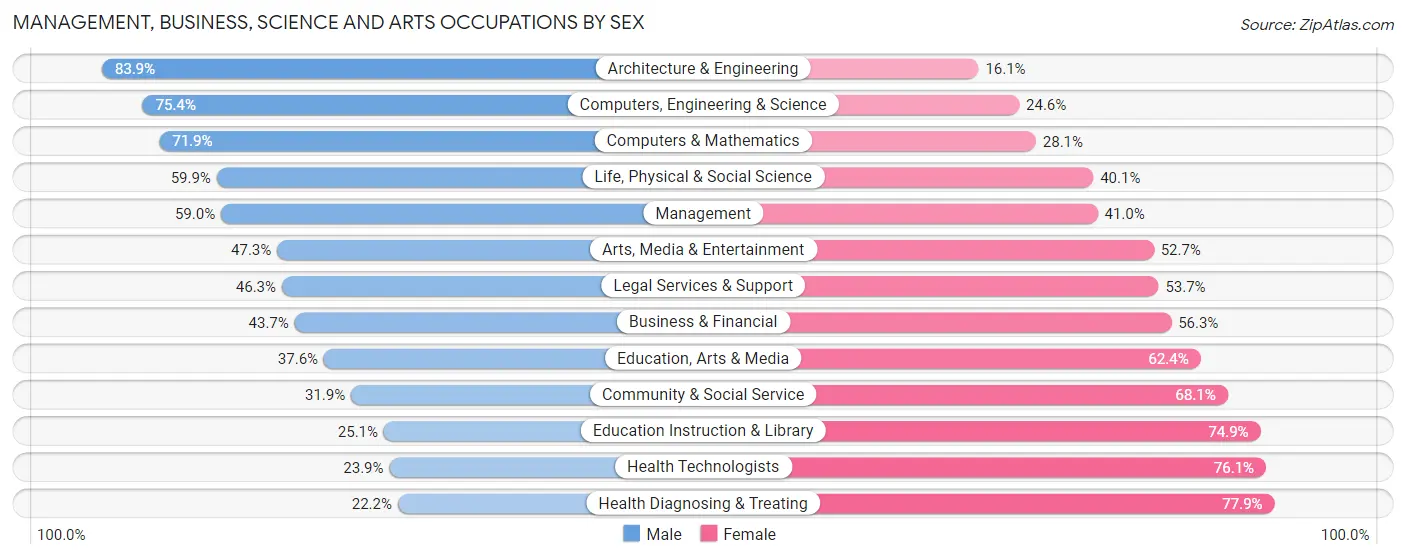
Within the Management, Business, Science and Arts occupations in Alabama, the most male-oriented occupations are Architecture & Engineering (83.9%), Computers, Engineering & Science (75.4%), and Computers & Mathematics (71.9%), while the most female-oriented occupations are Health Diagnosing & Treating (77.8%), Health Technologists (76.1%), and Education Instruction & Library (74.9%).
| Occupation | Male | Female |
| Management | 121,526 (59.0%) | 84,333 (41.0%) |
| Business & Financial | 43,458 (43.7%) | 56,056 (56.3%) |
| Computers, Engineering & Science | 94,854 (75.4%) | 30,939 (24.6%) |
| Computers & Mathematics | 40,414 (71.9%) | 15,793 (28.1%) |
| Architecture & Engineering | 44,612 (83.9%) | 8,575 (16.1%) |
| Life, Physical & Social Science | 9,828 (59.9%) | 6,571 (40.1%) |
| Community & Social Service | 70,884 (31.9%) | 151,235 (68.1%) |
| Education, Arts & Media | 14,498 (37.6%) | 24,102 (62.4%) |
| Legal Services & Support | 9,183 (46.3%) | 10,637 (53.7%) |
| Education Instruction & Library | 34,055 (25.1%) | 101,856 (74.9%) |
| Arts, Media & Entertainment | 13,148 (47.3%) | 14,640 (52.7%) |
| Health Diagnosing & Treating | 34,368 (22.2%) | 120,814 (77.8%) |
| Health Technologists | 24,632 (23.9%) | 78,407 (76.1%) |
| Total (Category) | 365,090 (45.2%) | 443,377 (54.8%) |
| Total (Overall) | 1,158,082 (52.4%) | 1,051,584 (47.6%) |
Services Occupations
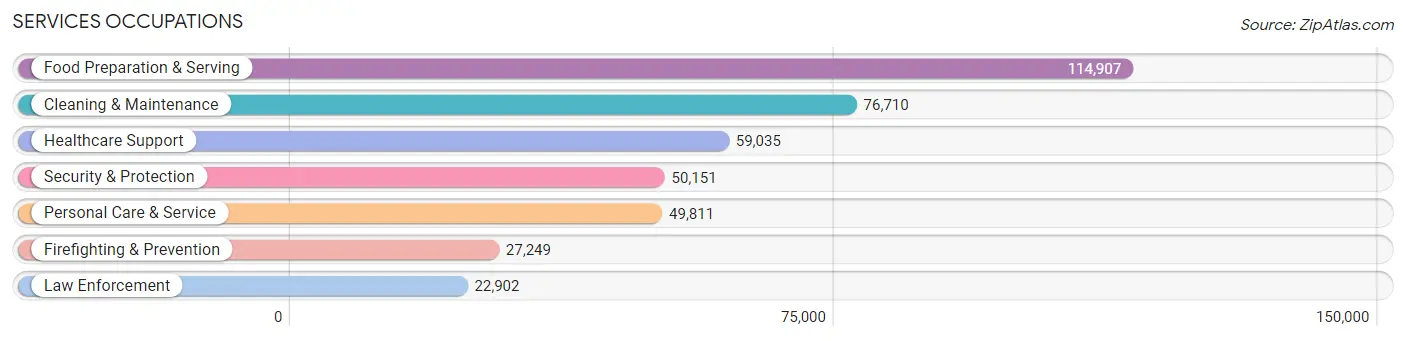
The most common Services occupations in Alabama are Food Preparation & Serving (114,907 | 5.2%), Cleaning & Maintenance (76,710 | 3.5%), Healthcare Support (59,035 | 2.7%), Security & Protection (50,151 | 2.3%), and Personal Care & Service (49,811 | 2.2%).
Services Occupations by Sex
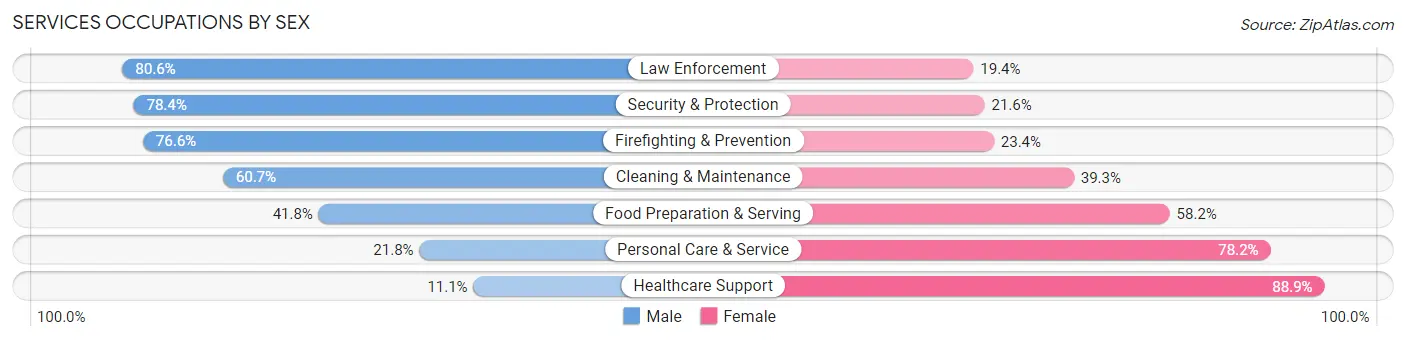
Within the Services occupations in Alabama, the most male-oriented occupations are Law Enforcement (80.6%), Security & Protection (78.4%), and Firefighting & Prevention (76.6%), while the most female-oriented occupations are Healthcare Support (88.9%), Personal Care & Service (78.2%), and Food Preparation & Serving (58.2%).
| Occupation | Male | Female |
| Healthcare Support | 6,565 (11.1%) | 52,470 (88.9%) |
| Security & Protection | 39,330 (78.4%) | 10,821 (21.6%) |
| Firefighting & Prevention | 20,864 (76.6%) | 6,385 (23.4%) |
| Law Enforcement | 18,466 (80.6%) | 4,436 (19.4%) |
| Food Preparation & Serving | 47,984 (41.8%) | 66,923 (58.2%) |
| Cleaning & Maintenance | 46,593 (60.7%) | 30,117 (39.3%) |
| Personal Care & Service | 10,869 (21.8%) | 38,942 (78.2%) |
| Total (Category) | 151,341 (43.2%) | 199,273 (56.8%) |
| Total (Overall) | 1,158,082 (52.4%) | 1,051,584 (47.6%) |
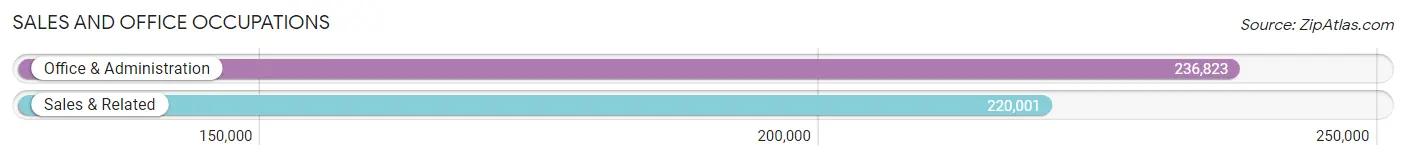
Sales and Office Occupations
The most common Sales and Office occupations in Alabama are Office & Administration (236,823 | 10.7%), and Sales & Related (220,001 | 10.0%).
Sales and Office Occupations by Sex
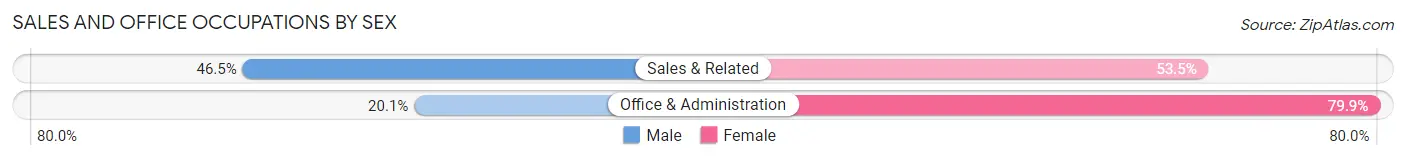
| Occupation | Male | Female |
| Sales & Related | 102,231 (46.5%) | 117,770 (53.5%) |
| Office & Administration | 47,541 (20.1%) | 189,282 (79.9%) |
| Total (Category) | 149,772 (32.8%) | 307,052 (67.2%) |
| Total (Overall) | 1,158,082 (52.4%) | 1,051,584 (47.6%) |
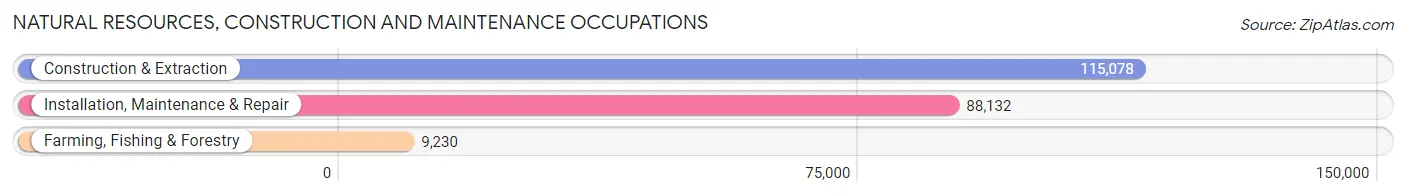
Natural Resources, Construction and Maintenance Occupations
The most common Natural Resources, Construction and Maintenance occupations in Alabama are Construction & Extraction (115,078 | 5.2%), Installation, Maintenance & Repair (88,132 | 4.0%), and Farming, Fishing & Forestry (9,230 | 0.4%).
Natural Resources, Construction and Maintenance Occupations by Sex
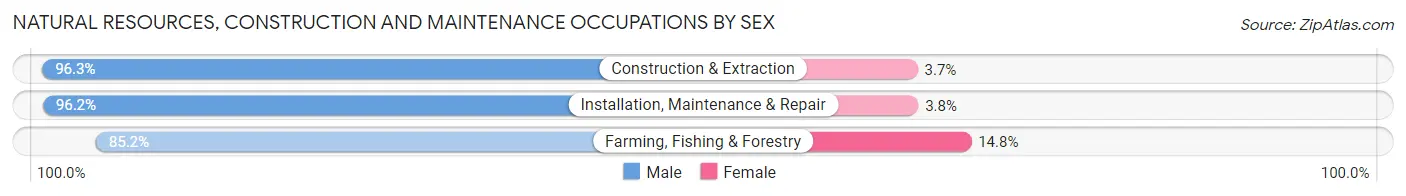
| Occupation | Male | Female |
| Farming, Fishing & Forestry | 7,860 (85.2%) | 1,370 (14.8%) |
| Construction & Extraction | 110,850 (96.3%) | 4,228 (3.7%) |
| Installation, Maintenance & Repair | 84,772 (96.2%) | 3,360 (3.8%) |
| Total (Category) | 203,482 (95.8%) | 8,958 (4.2%) |
| Total (Overall) | 1,158,082 (52.4%) | 1,051,584 (47.6%) |
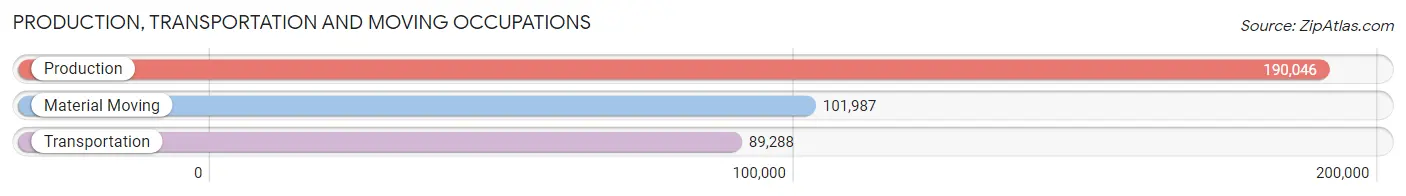
Production, Transportation and Moving Occupations
The most common Production, Transportation and Moving occupations in Alabama are Production (190,046 | 8.6%), Material Moving (101,987 | 4.6%), and Transportation (89,288 | 4.0%).
Production, Transportation and Moving Occupations by Sex
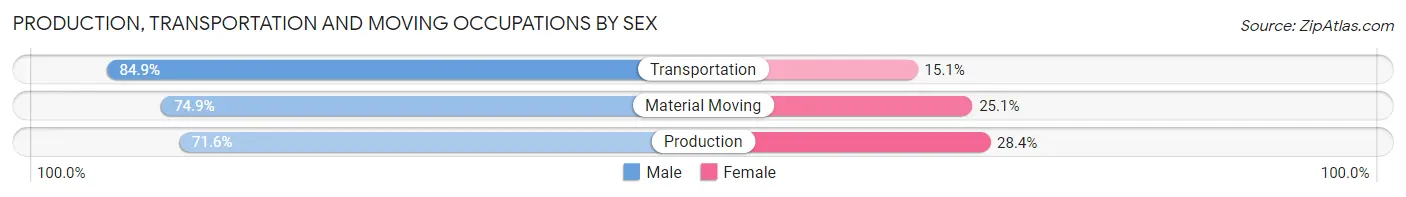
| Occupation | Male | Female |
| Production | 136,152 (71.6%) | 53,894 (28.4%) |
| Transportation | 75,841 (84.9%) | 13,447 (15.1%) |
| Material Moving | 76,404 (74.9%) | 25,583 (25.1%) |
| Total (Category) | 288,397 (75.6%) | 92,924 (24.4%) |
| Total (Overall) | 1,158,082 (52.4%) | 1,051,584 (47.6%) |
Employment Industries by Sex in Alabama
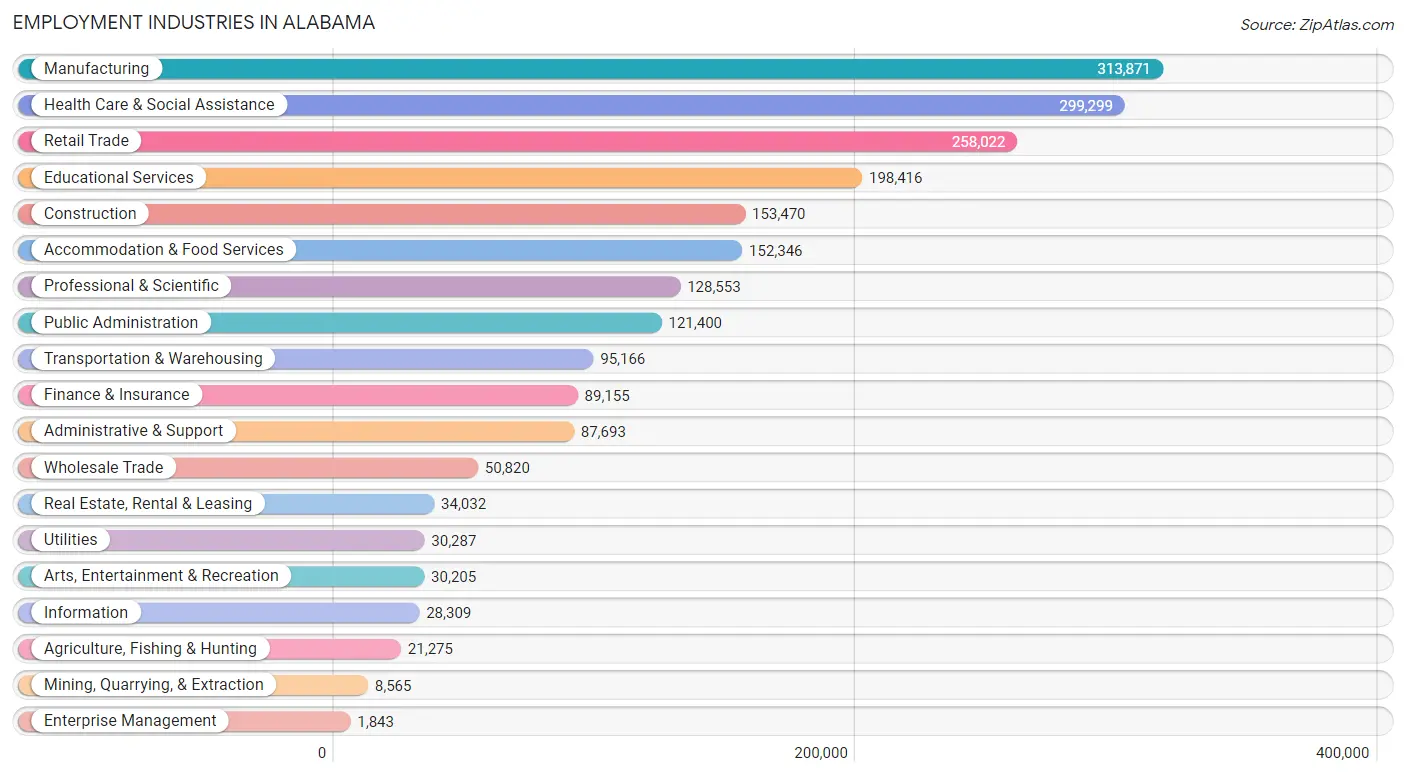
Employment Industries in Alabama
The major employment industries in Alabama include Manufacturing (313,871 | 14.2%), Health Care & Social Assistance (299,299 | 13.5%), Retail Trade (258,022 | 11.7%), Educational Services (198,416 | 9.0%), and Construction (153,470 | 7.0%).
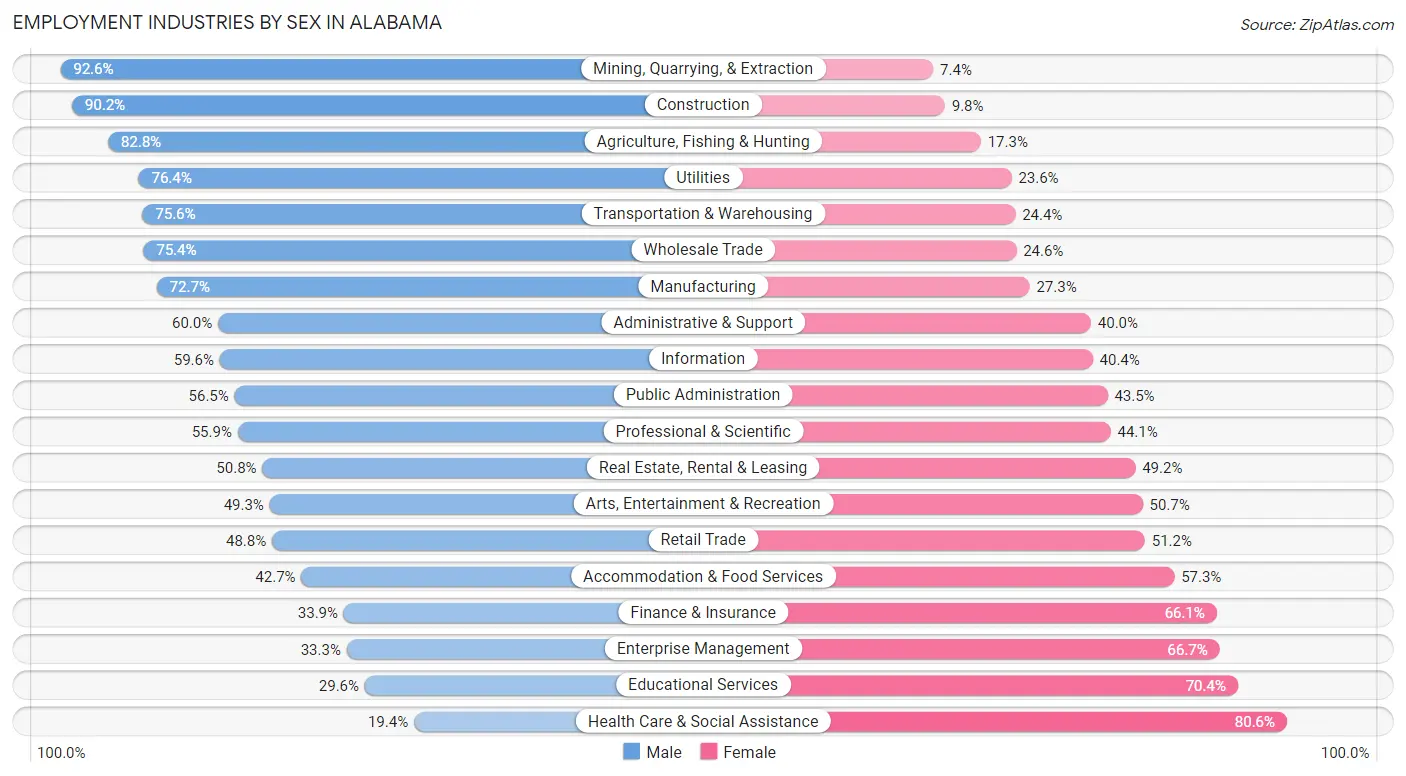
Employment Industries by Sex in Alabama
The Alabama industries that see more men than women are Mining, Quarrying, & Extraction (92.6%), Construction (90.2%), and Agriculture, Fishing & Hunting (82.8%), whereas the industries that tend to have a higher number of women are Health Care & Social Assistance (80.6%), Educational Services (70.4%), and Enterprise Management (66.7%).
| Industry | Male | Female |
| Agriculture, Fishing & Hunting | 17,604 (82.8%) | 3,671 (17.2%) |
| Mining, Quarrying, & Extraction | 7,931 (92.6%) | 634 (7.4%) |
| Construction | 138,430 (90.2%) | 15,040 (9.8%) |
| Manufacturing | 228,062 (72.7%) | 85,809 (27.3%) |
| Wholesale Trade | 38,326 (75.4%) | 12,494 (24.6%) |
| Retail Trade | 125,884 (48.8%) | 132,138 (51.2%) |
| Transportation & Warehousing | 71,965 (75.6%) | 23,201 (24.4%) |
| Utilities | 23,140 (76.4%) | 7,147 (23.6%) |
| Information | 16,871 (59.6%) | 11,438 (40.4%) |
| Finance & Insurance | 30,245 (33.9%) | 58,910 (66.1%) |
| Real Estate, Rental & Leasing | 17,280 (50.8%) | 16,752 (49.2%) |
| Professional & Scientific | 71,839 (55.9%) | 56,714 (44.1%) |
| Enterprise Management | 614 (33.3%) | 1,229 (66.7%) |
| Administrative & Support | 52,580 (60.0%) | 35,113 (40.0%) |
| Educational Services | 58,667 (29.6%) | 139,749 (70.4%) |
| Health Care & Social Assistance | 58,069 (19.4%) | 241,230 (80.6%) |
| Arts, Entertainment & Recreation | 14,882 (49.3%) | 15,323 (50.7%) |
| Accommodation & Food Services | 65,065 (42.7%) | 87,281 (57.3%) |
| Public Administration | 68,632 (56.5%) | 52,768 (43.5%) |
| Total | 1,158,082 (52.4%) | 1,051,584 (47.6%) |
Education in Alabama
School Enrollment in Alabama
The most common levels of schooling among the 1,200,535 students in Alabama are college / undergraduate (265,416 | 22.1%), high school (256,925 | 21.4%), and middle school (252,486 | 21.0%).
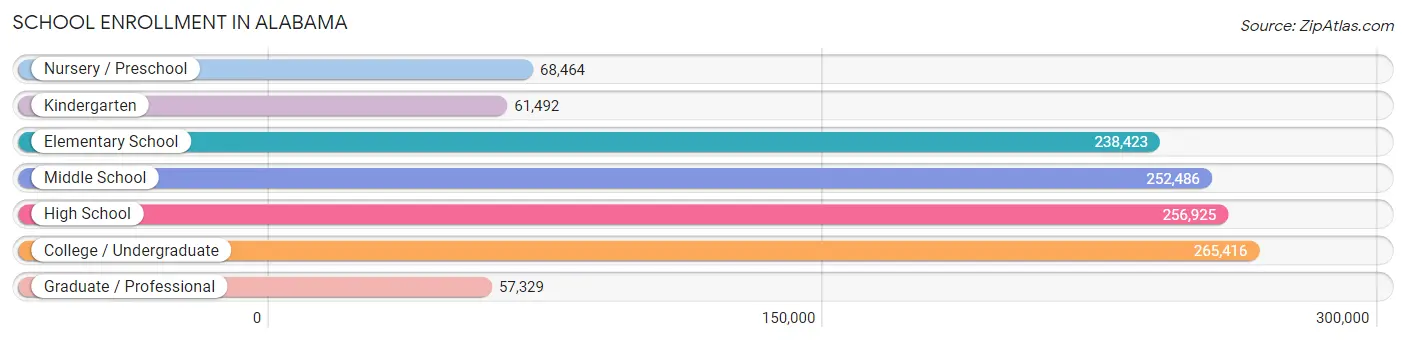
| School Level | # Students | % Students |
| Nursery / Preschool | 68,464 | 5.7% |
| Kindergarten | 61,492 | 5.1% |
| Elementary School | 238,423 | 19.9% |
| Middle School | 252,486 | 21.0% |
| High School | 256,925 | 21.4% |
| College / Undergraduate | 265,416 | 22.1% |
| Graduate / Professional | 57,329 | 4.8% |
| Total | 1,200,535 | 100.0% |
School Enrollment by Age by Funding Source in Alabama
Out of a total of 1,200,535 students who are enrolled in schools in Alabama, 184,882 (15.4%) attend a private institution, while the remaining 1,015,653 (84.6%) are enrolled in public schools. The age group of 3 to 4 year olds has the highest likelihood of being enrolled in private schools, with 20,868 (38.9% in the age bracket) enrolled. Conversely, the age group of 10 to 14 year olds has the lowest likelihood of being enrolled in a private school, with 275,048 (87.0% in the age bracket) attending a public institution.
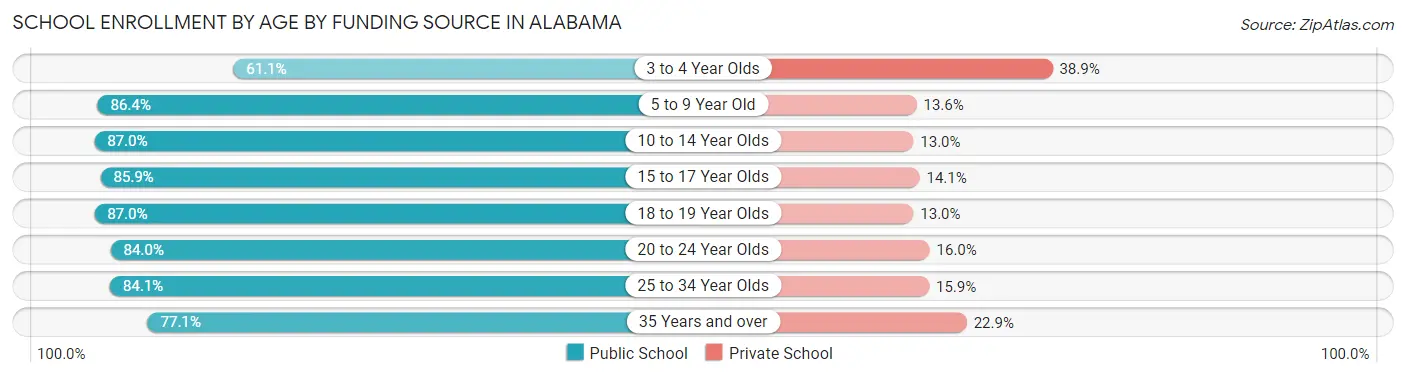
| Age Bracket | Public School | Private School |
| 3 to 4 Year Olds | 32,789 (61.1%) | 20,868 (38.9%) |
| 5 to 9 Year Old | 241,191 (86.4%) | 37,902 (13.6%) |
| 10 to 14 Year Olds | 275,048 (87.0%) | 41,040 (13.0%) |
| 15 to 17 Year Olds | 158,742 (85.9%) | 26,115 (14.1%) |
| 18 to 19 Year Olds | 95,027 (87.0%) | 14,178 (13.0%) |
| 20 to 24 Year Olds | 116,110 (84.0%) | 22,127 (16.0%) |
| 25 to 34 Year Olds | 53,335 (84.1%) | 10,080 (15.9%) |
| 35 Years and over | 43,150 (77.1%) | 12,833 (22.9%) |
| Total | 1,015,653 (84.6%) | 184,882 (15.4%) |
Educational Attainment by Field of Study in Alabama
Business (224,410 | 22.5%), education (151,138 | 15.2%), science & technology (109,417 | 11.0%), engineering (76,660 | 7.7%), and arts & humanities (71,729 | 7.2%) are the most common fields of study among 995,513 individuals in Alabama who have obtained a bachelor's degree or higher.
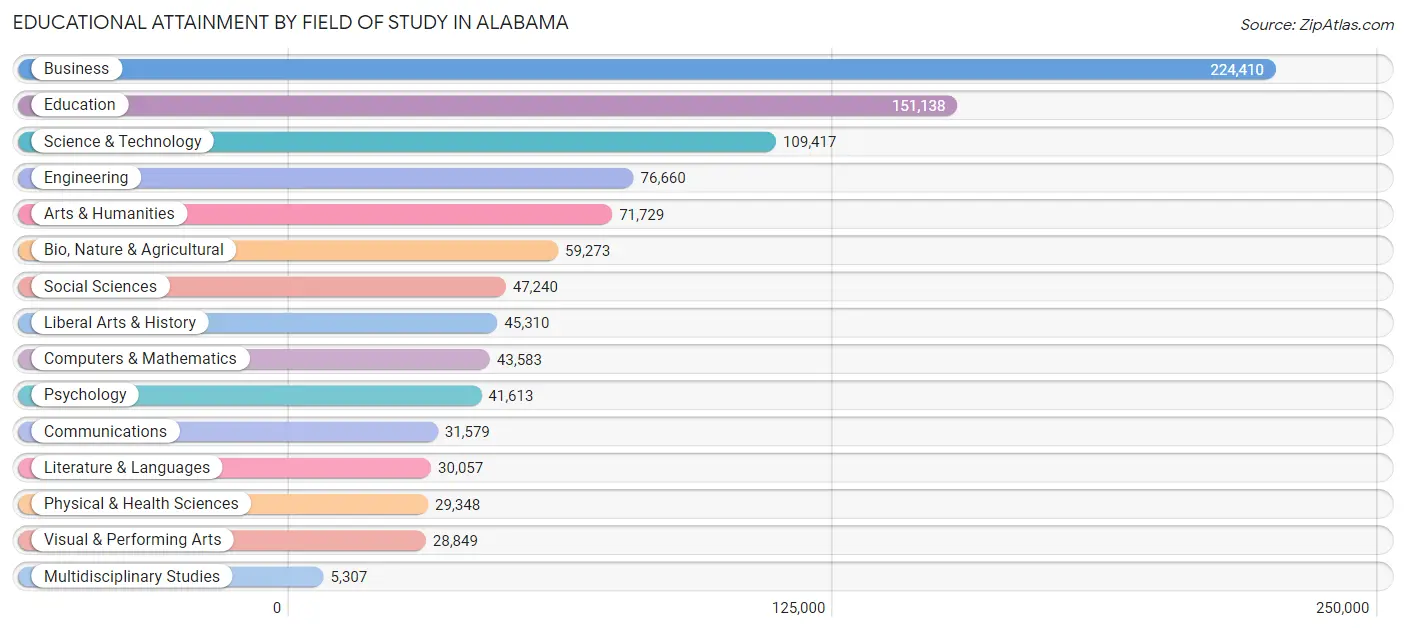
| Field of Study | # Graduates | % Graduates |
| Computers & Mathematics | 43,583 | 4.4% |
| Bio, Nature & Agricultural | 59,273 | 5.9% |
| Physical & Health Sciences | 29,348 | 2.9% |
| Psychology | 41,613 | 4.2% |
| Social Sciences | 47,240 | 4.8% |
| Engineering | 76,660 | 7.7% |
| Multidisciplinary Studies | 5,307 | 0.5% |
| Science & Technology | 109,417 | 11.0% |
| Business | 224,410 | 22.5% |
| Education | 151,138 | 15.2% |
| Literature & Languages | 30,057 | 3.0% |
| Liberal Arts & History | 45,310 | 4.5% |
| Visual & Performing Arts | 28,849 | 2.9% |
| Communications | 31,579 | 3.2% |
| Arts & Humanities | 71,729 | 7.2% |
| Total | 995,513 | 100.0% |
Transportation & Commute in Alabama
Vehicle Availability by Sex in Alabama
The most prevalent vehicle ownership categories in Alabama are males with 2 vehicles (459,694, accounting for 40.1%) and females with 2 vehicles (390,039, making up 45.0%).
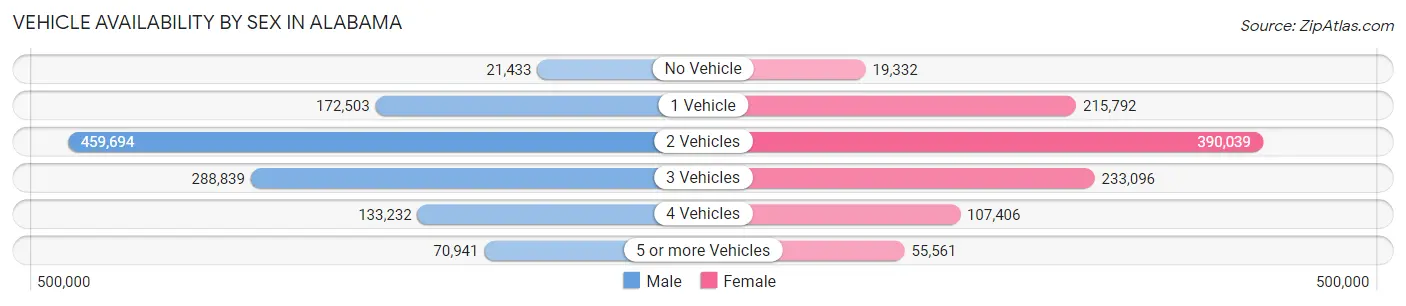
| Vehicles Available | Male | Female |
| No Vehicle | 21,433 (1.9%) | 19,332 (1.9%) |
| 1 Vehicle | 172,503 (15.0%) | 215,792 (21.1%) |
| 2 Vehicles | 459,694 (40.1%) | 390,039 (38.2%) |
| 3 Vehicles | 288,839 (25.2%) | 233,096 (22.8%) |
| 4 Vehicles | 133,232 (11.6%) | 107,406 (10.5%) |
| 5 or more Vehicles | 70,941 (6.2%) | 55,561 (5.4%) |
| Total | 1,146,642 (100.0%) | 1,021,226 (100.0%) |
Commute Time in Alabama
The most frequently occuring commute durations in Alabama are 15 to 19 minutes (342,006 commuters, 16.8%), 20 to 24 minutes (317,663 commuters, 15.6%), and 30 to 34 minutes (287,053 commuters, 14.1%).
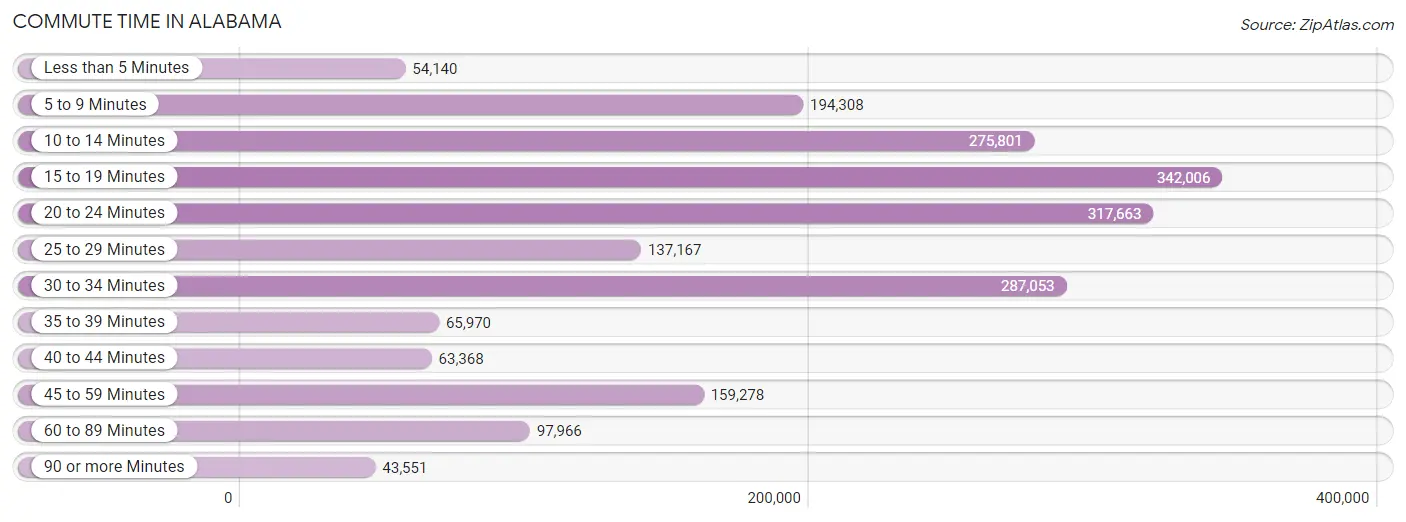
| Commute Time | # Commuters | % Commuters |
| Less than 5 Minutes | 54,140 | 2.7% |
| 5 to 9 Minutes | 194,308 | 9.5% |
| 10 to 14 Minutes | 275,801 | 13.5% |
| 15 to 19 Minutes | 342,006 | 16.8% |
| 20 to 24 Minutes | 317,663 | 15.6% |
| 25 to 29 Minutes | 137,167 | 6.7% |
| 30 to 34 Minutes | 287,053 | 14.1% |
| 35 to 39 Minutes | 65,970 | 3.2% |
| 40 to 44 Minutes | 63,368 | 3.1% |
| 45 to 59 Minutes | 159,278 | 7.8% |
| 60 to 89 Minutes | 97,966 | 4.8% |
| 90 or more Minutes | 43,551 | 2.1% |
Commute Time by Sex in Alabama
The most common commute times in Alabama are 15 to 19 minutes (173,106 commuters, 16.0%) for males and 15 to 19 minutes (168,900 commuters, 17.7%) for females.
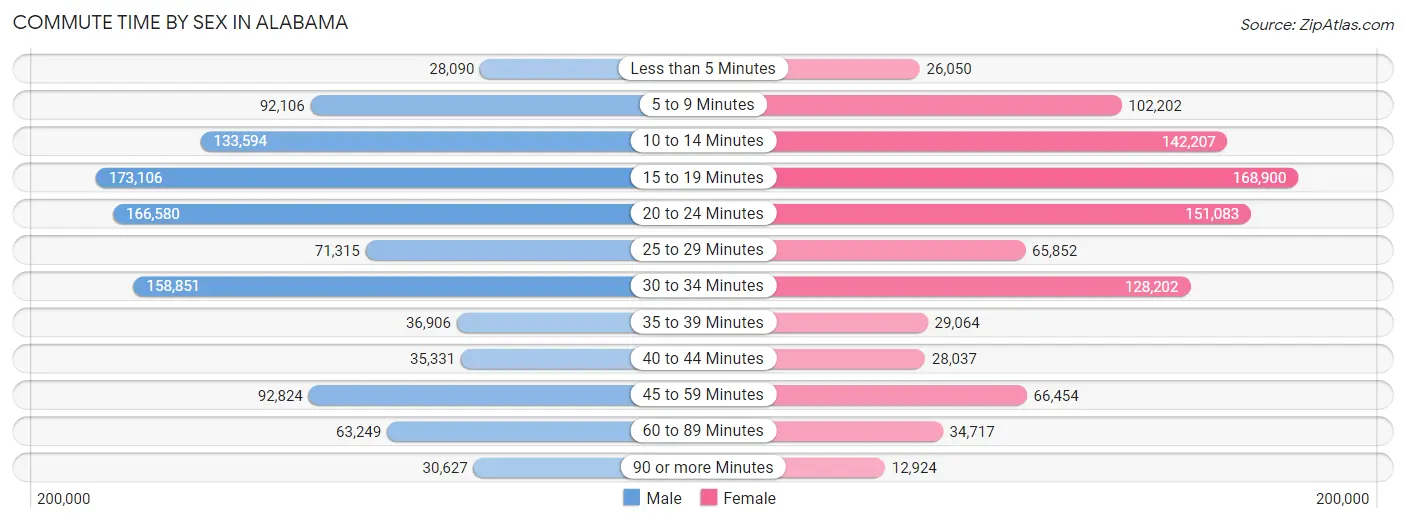
| Commute Time | Male | Female |
| Less than 5 Minutes | 28,090 (2.6%) | 26,050 (2.7%) |
| 5 to 9 Minutes | 92,106 (8.5%) | 102,202 (10.7%) |
| 10 to 14 Minutes | 133,594 (12.3%) | 142,207 (14.9%) |
| 15 to 19 Minutes | 173,106 (16.0%) | 168,900 (17.7%) |
| 20 to 24 Minutes | 166,580 (15.4%) | 151,083 (15.8%) |
| 25 to 29 Minutes | 71,315 (6.6%) | 65,852 (6.9%) |
| 30 to 34 Minutes | 158,851 (14.7%) | 128,202 (13.4%) |
| 35 to 39 Minutes | 36,906 (3.4%) | 29,064 (3.0%) |
| 40 to 44 Minutes | 35,331 (3.3%) | 28,037 (2.9%) |
| 45 to 59 Minutes | 92,824 (8.6%) | 66,454 (7.0%) |
| 60 to 89 Minutes | 63,249 (5.8%) | 34,717 (3.6%) |
| 90 or more Minutes | 30,627 (2.8%) | 12,924 (1.3%) |
Time of Departure to Work by Sex in Alabama
The most frequent times of departure to work in Alabama are 7:00 AM to 7:29 AM (161,099, 14.9%) for males and 7:00 AM to 7:29 AM (173,162, 18.1%) for females.
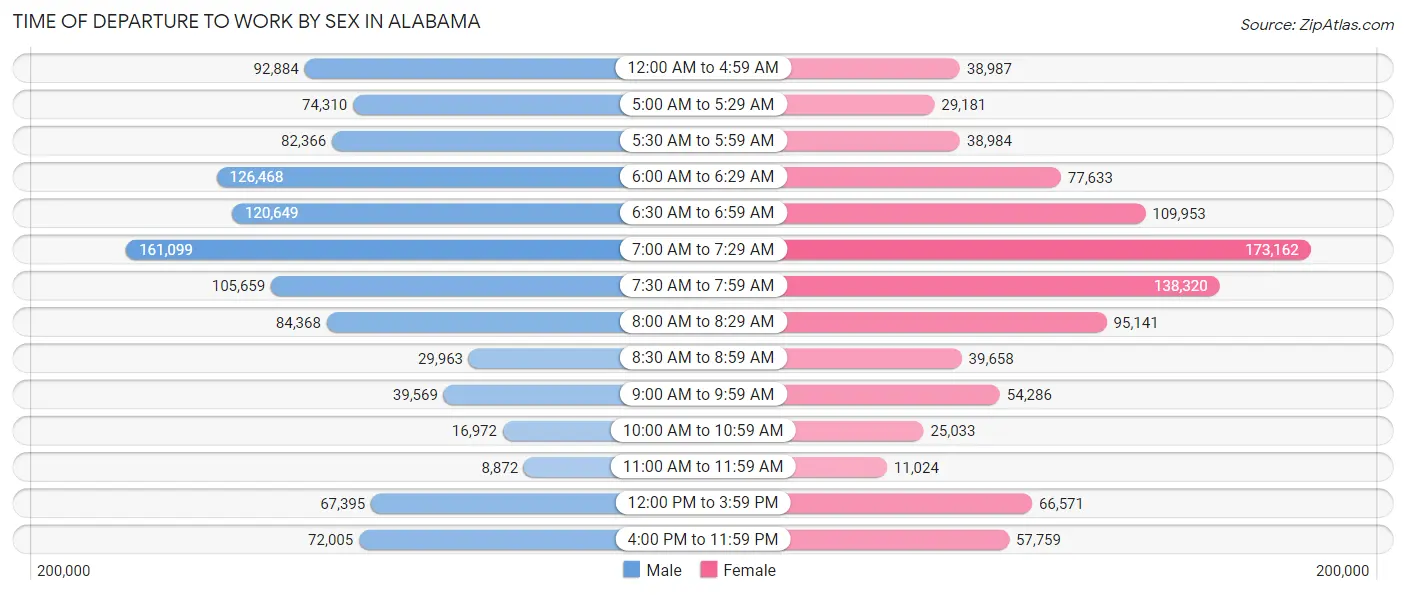
| Time of Departure | Male | Female |
| 12:00 AM to 4:59 AM | 92,884 (8.6%) | 38,987 (4.1%) |
| 5:00 AM to 5:29 AM | 74,310 (6.9%) | 29,181 (3.0%) |
| 5:30 AM to 5:59 AM | 82,366 (7.6%) | 38,984 (4.1%) |
| 6:00 AM to 6:29 AM | 126,468 (11.7%) | 77,633 (8.1%) |
| 6:30 AM to 6:59 AM | 120,649 (11.1%) | 109,953 (11.5%) |
| 7:00 AM to 7:29 AM | 161,099 (14.9%) | 173,162 (18.1%) |
| 7:30 AM to 7:59 AM | 105,659 (9.8%) | 138,320 (14.5%) |
| 8:00 AM to 8:29 AM | 84,368 (7.8%) | 95,141 (10.0%) |
| 8:30 AM to 8:59 AM | 29,963 (2.8%) | 39,658 (4.2%) |
| 9:00 AM to 9:59 AM | 39,569 (3.7%) | 54,286 (5.7%) |
| 10:00 AM to 10:59 AM | 16,972 (1.6%) | 25,033 (2.6%) |
| 11:00 AM to 11:59 AM | 8,872 (0.8%) | 11,024 (1.1%) |
| 12:00 PM to 3:59 PM | 67,395 (6.2%) | 66,571 (7.0%) |
| 4:00 PM to 11:59 PM | 72,005 (6.7%) | 57,759 (6.0%) |
| Total | 1,082,579 (100.0%) | 955,692 (100.0%) |
Housing Occupancy in Alabama
Occupancy by Ownership in Alabama
Of the total 1,933,150 dwellings in Alabama, owner-occupied units account for 1,347,792 (69.7%), while renter-occupied units make up 585,358 (30.3%).
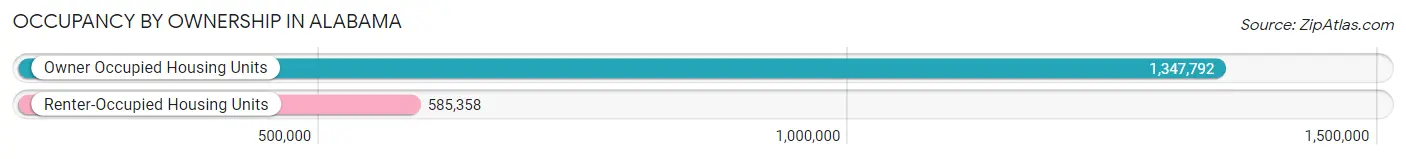
| Occupancy | # Housing Units | % Housing Units |
| Owner Occupied Housing Units | 1,347,792 | 69.7% |
| Renter-Occupied Housing Units | 585,358 | 30.3% |
| Total Occupied Housing Units | 1,933,150 | 100.0% |
Occupancy by Household Size in Alabama
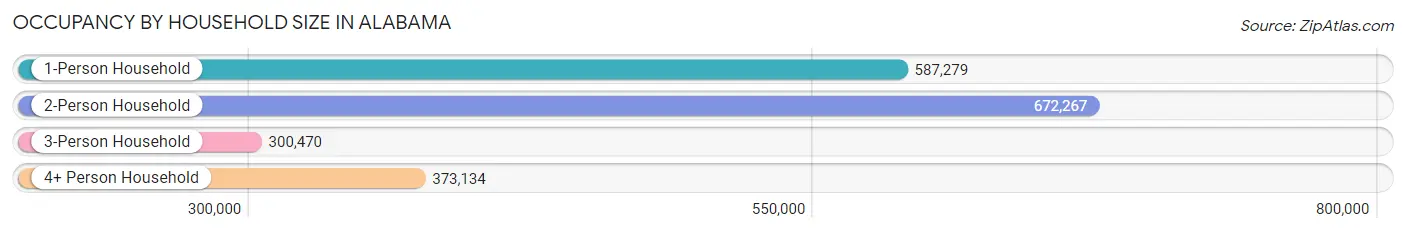
| Household Size | # Housing Units | % Housing Units |
| 1-Person Household | 587,279 | 30.4% |
| 2-Person Household | 672,267 | 34.8% |
| 3-Person Household | 300,470 | 15.5% |
| 4+ Person Household | 373,134 | 19.3% |
| Total Housing Units | 1,933,150 | 100.0% |
Occupancy by Ownership by Household Size in Alabama
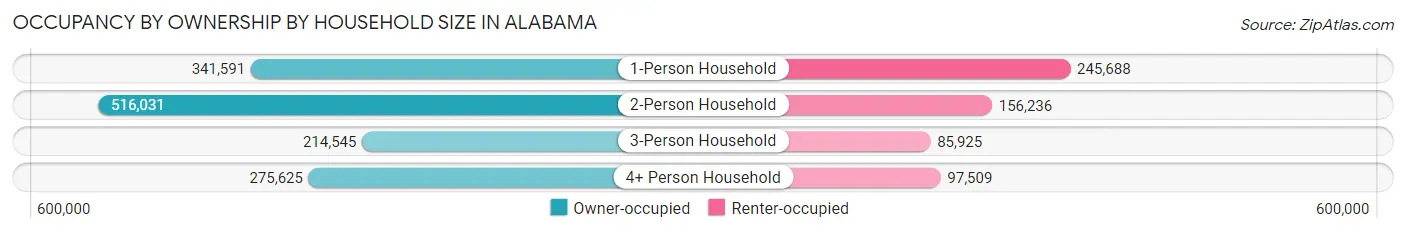
| Household Size | Owner-occupied | Renter-occupied |
| 1-Person Household | 341,591 (58.2%) | 245,688 (41.8%) |
| 2-Person Household | 516,031 (76.8%) | 156,236 (23.2%) |
| 3-Person Household | 214,545 (71.4%) | 85,925 (28.6%) |
| 4+ Person Household | 275,625 (73.9%) | 97,509 (26.1%) |
| Total Housing Units | 1,347,792 (69.7%) | 585,358 (30.3%) |
Occupancy by Educational Attainment in Alabama
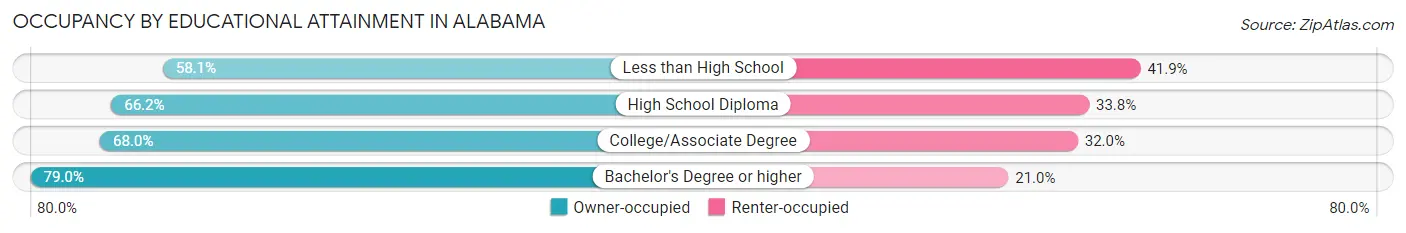
| Household Size | Owner-occupied | Renter-occupied |
| Less than High School | 120,120 (58.1%) | 86,688 (41.9%) |
| High School Diploma | 358,184 (66.2%) | 182,553 (33.8%) |
| College/Associate Degree | 417,410 (68.0%) | 196,211 (32.0%) |
| Bachelor's Degree or higher | 452,078 (79.0%) | 119,906 (21.0%) |
Occupancy by Age of Householder in Alabama
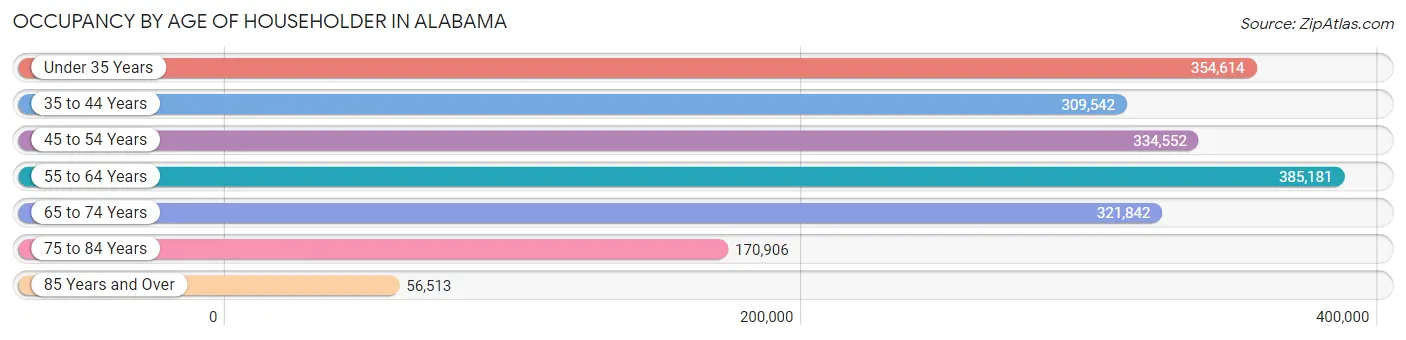
| Age Bracket | # Households | % Households |
| Under 35 Years | 354,614 | 18.3% |
| 35 to 44 Years | 309,542 | 16.0% |
| 45 to 54 Years | 334,552 | 17.3% |
| 55 to 64 Years | 385,181 | 19.9% |
| 65 to 74 Years | 321,842 | 16.7% |
| 75 to 84 Years | 170,906 | 8.8% |
| 85 Years and Over | 56,513 | 2.9% |
| Total | 1,933,150 | 100.0% |
Housing Finances in Alabama
Median Income by Occupancy in Alabama
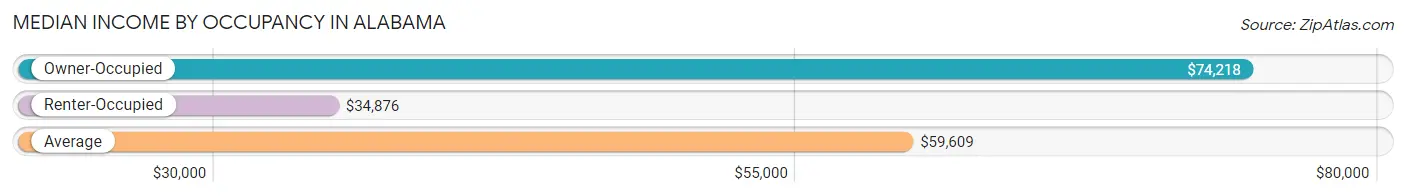
| Occupancy Type | # Households | Median Income |
| Owner-Occupied | 1,347,792 (69.7%) | $74,218 |
| Renter-Occupied | 585,358 (30.3%) | $34,876 |
| Average | 1,933,150 (100.0%) | $59,609 |
Occupancy by Householder Income Bracket in Alabama
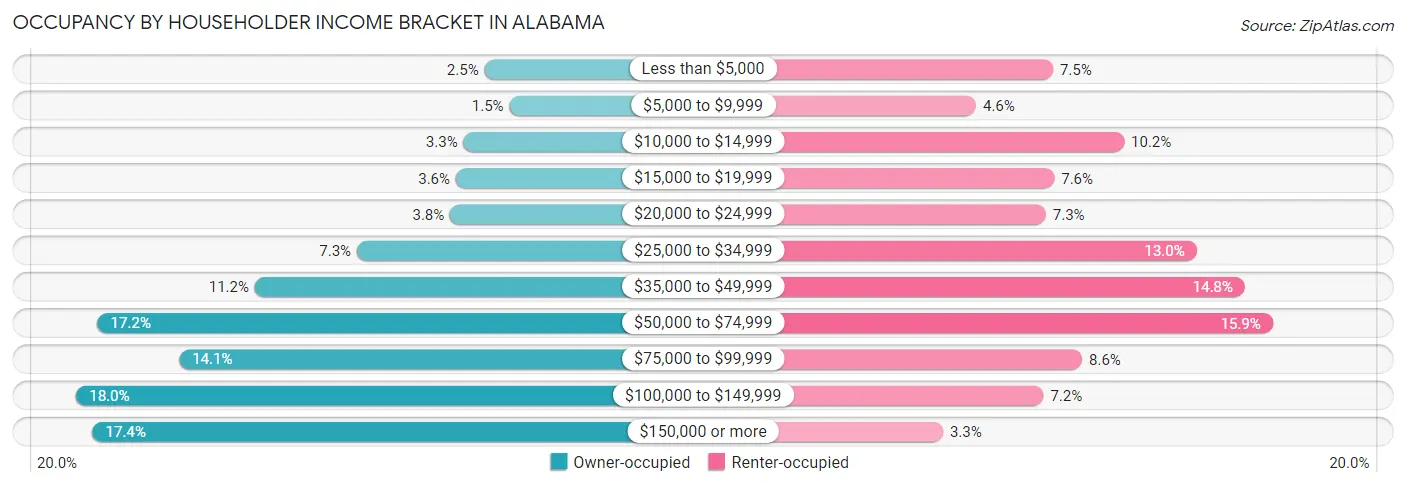
| Income Bracket | Owner-occupied | Renter-occupied |
| Less than $5,000 | 33,433 (2.5%) | 44,041 (7.5%) |
| $5,000 to $9,999 | 20,655 (1.5%) | 26,839 (4.6%) |
| $10,000 to $14,999 | 44,169 (3.3%) | 59,900 (10.2%) |
| $15,000 to $19,999 | 48,128 (3.6%) | 44,331 (7.6%) |
| $20,000 to $24,999 | 51,084 (3.8%) | 42,437 (7.2%) |
| $25,000 to $34,999 | 98,987 (7.3%) | 76,058 (13.0%) |
| $35,000 to $49,999 | 151,383 (11.2%) | 86,835 (14.8%) |
| $50,000 to $74,999 | 232,113 (17.2%) | 93,005 (15.9%) |
| $75,000 to $99,999 | 190,157 (14.1%) | 50,514 (8.6%) |
| $100,000 to $149,999 | 243,012 (18.0%) | 41,914 (7.2%) |
| $150,000 or more | 234,671 (17.4%) | 19,484 (3.3%) |
| Total | 1,347,792 (100.0%) | 585,358 (100.0%) |
Monthly Housing Cost Tiers in Alabama
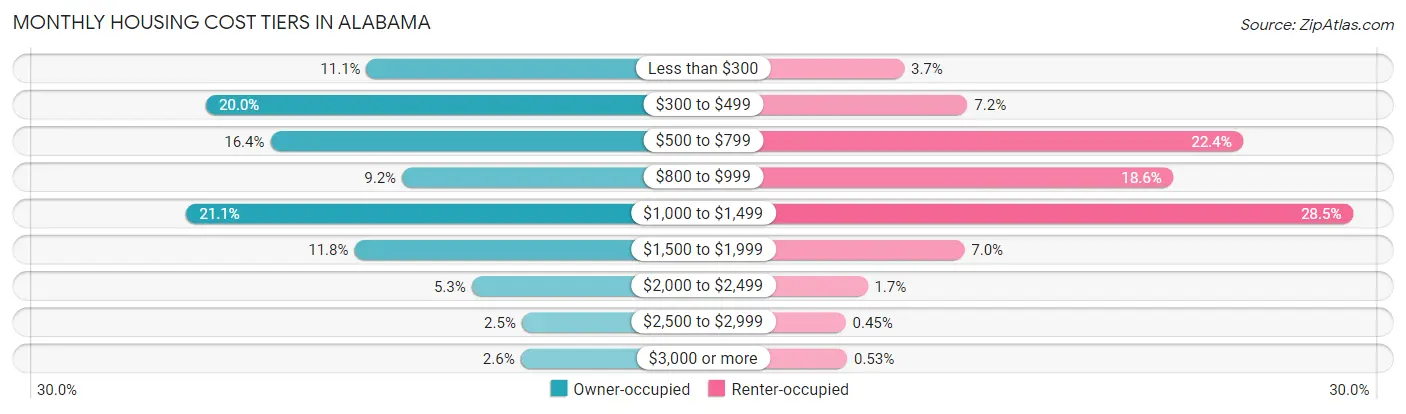
| Monthly Cost | Owner-occupied | Renter-occupied |
| Less than $300 | 149,812 (11.1%) | 21,524 (3.7%) |
| $300 to $499 | 269,356 (20.0%) | 42,038 (7.2%) |
| $500 to $799 | 221,496 (16.4%) | 131,273 (22.4%) |
| $800 to $999 | 123,521 (9.2%) | 108,708 (18.6%) |
| $1,000 to $1,499 | 283,805 (21.1%) | 166,788 (28.5%) |
| $1,500 to $1,999 | 158,884 (11.8%) | 41,039 (7.0%) |
| $2,000 to $2,499 | 71,505 (5.3%) | 9,695 (1.7%) |
| $2,500 to $2,999 | 34,232 (2.5%) | 2,605 (0.4%) |
| $3,000 or more | 35,181 (2.6%) | 3,100 (0.5%) |
| Total | 1,347,792 (100.0%) | 585,358 (100.0%) |
Physical Housing Characteristics in Alabama
Housing Structures in Alabama
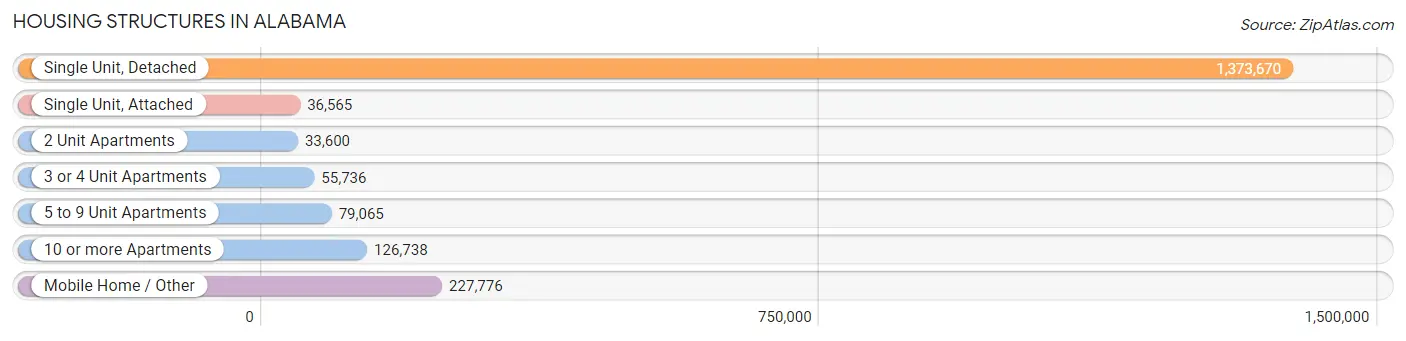
| Structure Type | # Housing Units | % Housing Units |
| Single Unit, Detached | 1,373,670 | 71.1% |
| Single Unit, Attached | 36,565 | 1.9% |
| 2 Unit Apartments | 33,600 | 1.7% |
| 3 or 4 Unit Apartments | 55,736 | 2.9% |
| 5 to 9 Unit Apartments | 79,065 | 4.1% |
| 10 or more Apartments | 126,738 | 6.6% |
| Mobile Home / Other | 227,776 | 11.8% |
| Total | 1,933,150 | 100.0% |
Housing Structures by Occupancy in Alabama
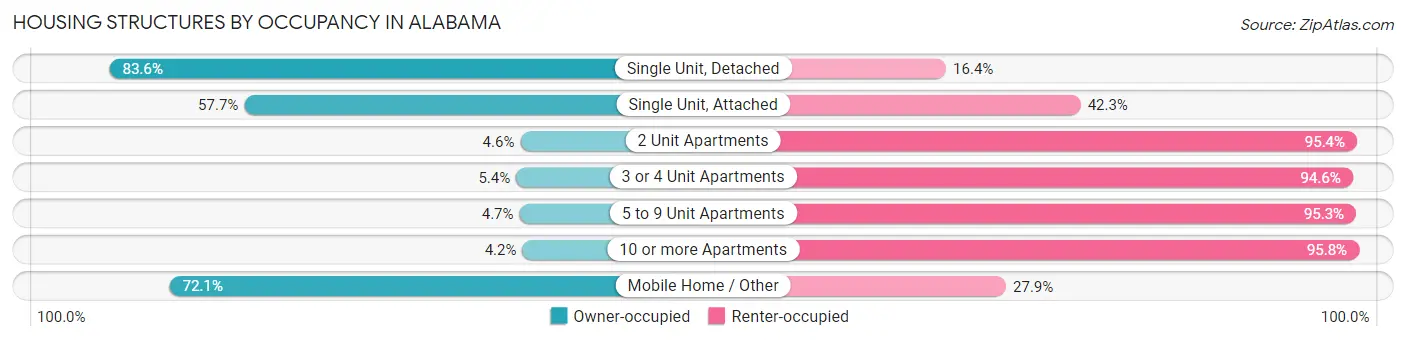
| Structure Type | Owner-occupied | Renter-occupied |
| Single Unit, Detached | 1,148,911 (83.6%) | 224,759 (16.4%) |
| Single Unit, Attached | 21,110 (57.7%) | 15,455 (42.3%) |
| 2 Unit Apartments | 1,535 (4.6%) | 32,065 (95.4%) |
| 3 or 4 Unit Apartments | 3,001 (5.4%) | 52,735 (94.6%) |
| 5 to 9 Unit Apartments | 3,745 (4.7%) | 75,320 (95.3%) |
| 10 or more Apartments | 5,279 (4.2%) | 121,459 (95.8%) |
| Mobile Home / Other | 164,211 (72.1%) | 63,565 (27.9%) |
| Total | 1,347,792 (69.7%) | 585,358 (30.3%) |
Housing Structures by Number of Rooms in Alabama
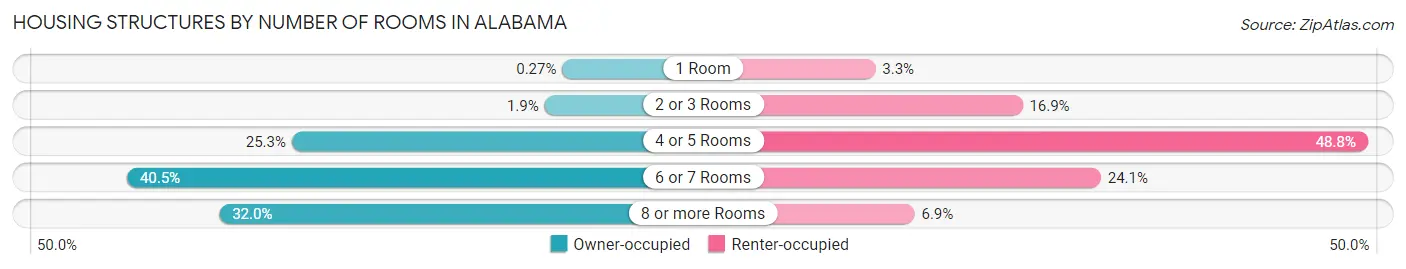
| Number of Rooms | Owner-occupied | Renter-occupied |
| 1 Room | 3,602 (0.3%) | 19,177 (3.3%) |
| 2 or 3 Rooms | 25,751 (1.9%) | 98,807 (16.9%) |
| 4 or 5 Rooms | 340,883 (25.3%) | 285,714 (48.8%) |
| 6 or 7 Rooms | 546,241 (40.5%) | 141,244 (24.1%) |
| 8 or more Rooms | 431,315 (32.0%) | 40,416 (6.9%) |
| Total | 1,347,792 (100.0%) | 585,358 (100.0%) |
Housing Structure by Heating Type in Alabama
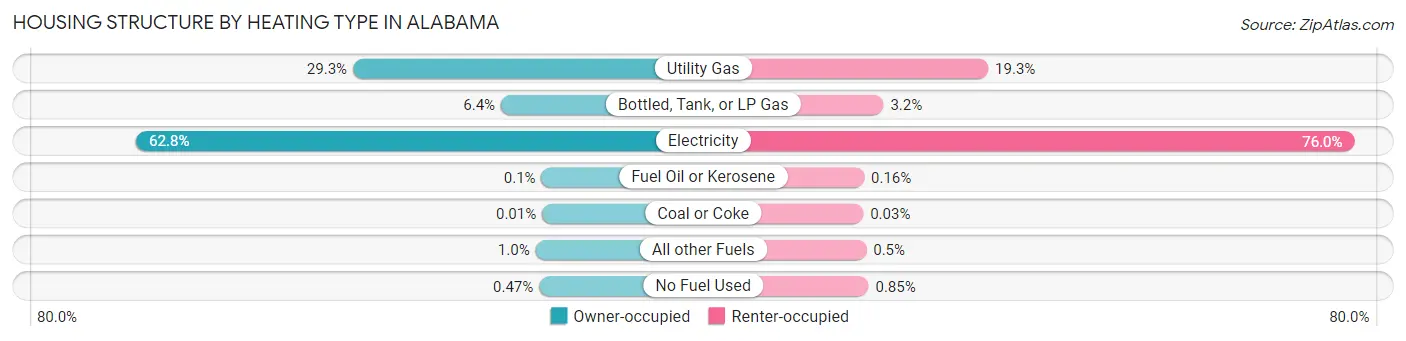
| Heating Type | Owner-occupied | Renter-occupied |
| Utility Gas | 394,252 (29.2%) | 113,214 (19.3%) |
| Bottled, Tank, or LP Gas | 85,862 (6.4%) | 18,504 (3.2%) |
| Electricity | 846,060 (62.8%) | 444,599 (75.9%) |
| Fuel Oil or Kerosene | 1,373 (0.1%) | 946 (0.2%) |
| Coal or Coke | 184 (0.0%) | 182 (0.0%) |
| All other Fuels | 13,737 (1.0%) | 2,934 (0.5%) |
| No Fuel Used | 6,324 (0.5%) | 4,979 (0.9%) |
| Total | 1,347,792 (100.0%) | 585,358 (100.0%) |
Household Vehicle Usage in Alabama
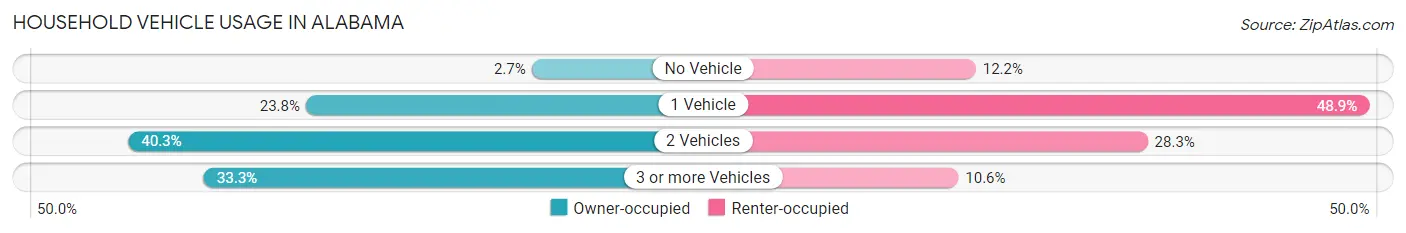
| Vehicles per Household | Owner-occupied | Renter-occupied |
| No Vehicle | 36,090 (2.7%) | 71,551 (12.2%) |
| 1 Vehicle | 320,092 (23.7%) | 286,388 (48.9%) |
| 2 Vehicles | 543,273 (40.3%) | 165,406 (28.3%) |
| 3 or more Vehicles | 448,337 (33.3%) | 62,013 (10.6%) |
| Total | 1,347,792 (100.0%) | 585,358 (100.0%) |
Real Estate & Mortgages in Alabama
Real Estate and Mortgage Overview in Alabama
| Characteristic | Without Mortgage | With Mortgage |
| Housing Units | 607,635 | 740,157 |
| Median Property Value | $144,800 | $203,300 |
| Median Household Income | $54,497 | $166,424 |
| Monthly Housing Costs | $414 | $34,322 |
| Real Estate Taxes | $544 | $83,723 |
Property Value by Mortgage Status in Alabama
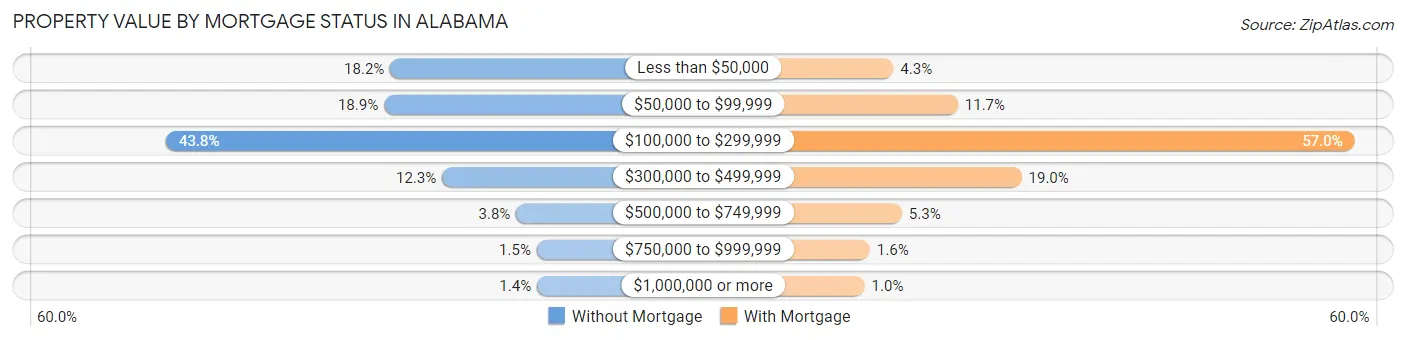
| Property Value | Without Mortgage | With Mortgage |
| Less than $50,000 | 110,693 (18.2%) | 32,082 (4.3%) |
| $50,000 to $99,999 | 115,019 (18.9%) | 86,516 (11.7%) |
| $100,000 to $299,999 | 266,354 (43.8%) | 422,010 (57.0%) |
| $300,000 to $499,999 | 74,672 (12.3%) | 140,486 (19.0%) |
| $500,000 to $749,999 | 23,217 (3.8%) | 39,209 (5.3%) |
| $750,000 to $999,999 | 8,940 (1.5%) | 12,164 (1.6%) |
| $1,000,000 or more | 8,740 (1.4%) | 7,690 (1.0%) |
| Total | 607,635 (100.0%) | 740,157 (100.0%) |
Household Income by Mortgage Status in Alabama
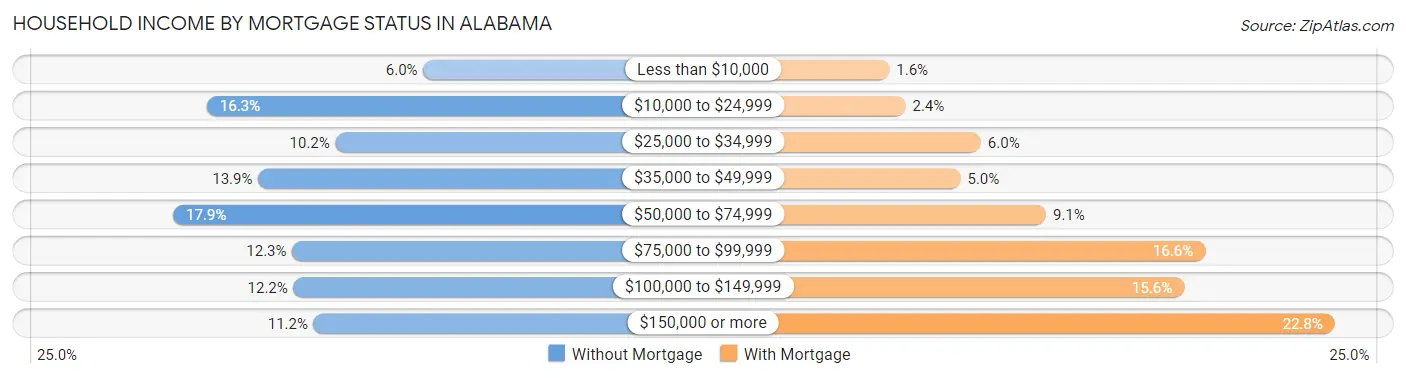
| Household Income | Without Mortgage | With Mortgage |
| Less than $10,000 | 36,509 (6.0%) | 11,921 (1.6%) |
| $10,000 to $24,999 | 99,175 (16.3%) | 17,579 (2.4%) |
| $25,000 to $34,999 | 61,946 (10.2%) | 44,206 (6.0%) |
| $35,000 to $49,999 | 84,276 (13.9%) | 37,041 (5.0%) |
| $50,000 to $74,999 | 108,976 (17.9%) | 67,107 (9.1%) |
| $75,000 to $99,999 | 74,424 (12.2%) | 123,137 (16.6%) |
| $100,000 to $149,999 | 74,082 (12.2%) | 115,733 (15.6%) |
| $150,000 or more | 68,247 (11.2%) | 168,930 (22.8%) |
| Total | 607,635 (100.0%) | 740,157 (100.0%) |
Property Value to Household Income Ratio in Alabama
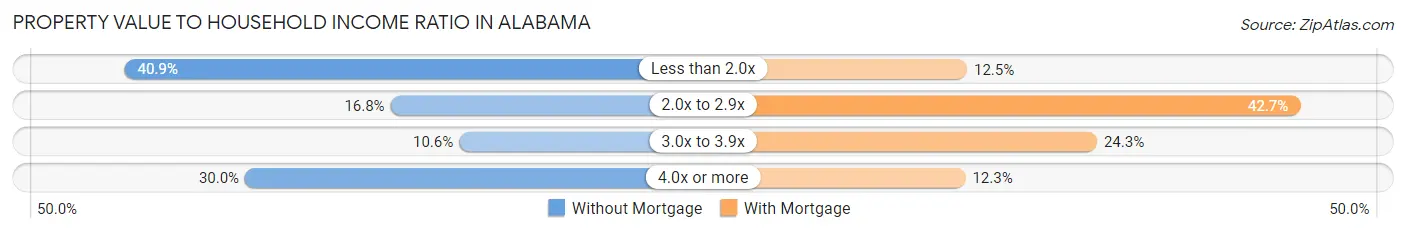
| Value-to-Income Ratio | Without Mortgage | With Mortgage |
| Less than 2.0x | 248,637 (40.9%) | 92,184 (12.4%) |
| 2.0x to 2.9x | 101,980 (16.8%) | 315,986 (42.7%) |
| 3.0x to 3.9x | 64,110 (10.5%) | 179,486 (24.2%) |
| 4.0x or more | 182,202 (30.0%) | 91,077 (12.3%) |
| Total | 607,635 (100.0%) | 740,157 (100.0%) |
Real Estate Taxes by Mortgage Status in Alabama
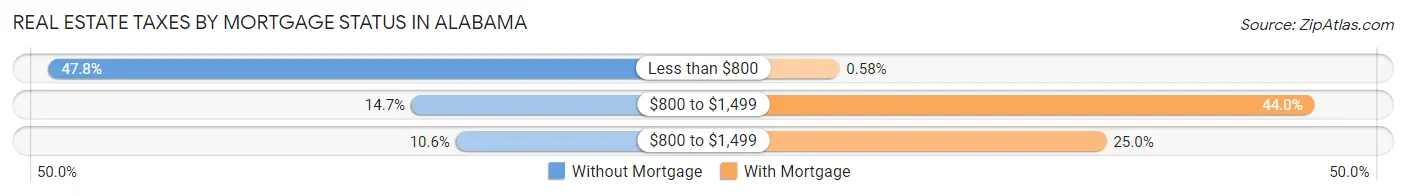
| Property Taxes | Without Mortgage | With Mortgage |
| Less than $800 | 290,504 (47.8%) | 4,310 (0.6%) |
| $800 to $1,499 | 89,455 (14.7%) | 325,476 (44.0%) |
| $800 to $1,499 | 64,593 (10.6%) | 184,848 (25.0%) |
| Total | 607,635 (100.0%) | 740,157 (100.0%) |
Health & Disability in Alabama
Health Insurance Coverage by Age in Alabama
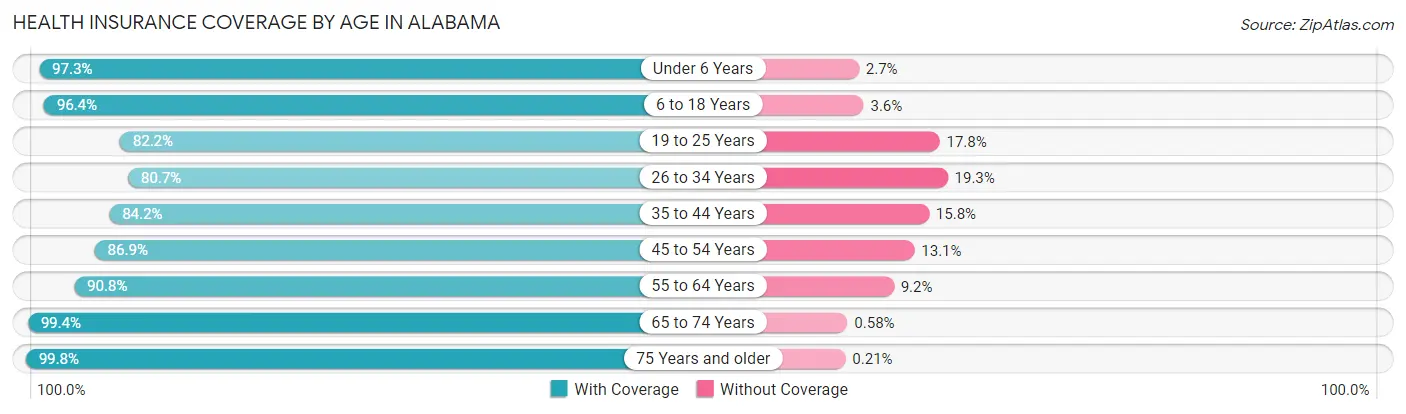
| Age Bracket | With Coverage | Without Coverage |
| Under 6 Years | 341,423 (97.3%) | 9,532 (2.7%) |
| 6 to 18 Years | 803,463 (96.4%) | 29,953 (3.6%) |
| 19 to 25 Years | 388,898 (82.2%) | 84,059 (17.8%) |
| 26 to 34 Years | 457,455 (80.7%) | 109,212 (19.3%) |
| 35 to 44 Years | 505,160 (84.2%) | 94,636 (15.8%) |
| 45 to 54 Years | 533,605 (86.9%) | 80,234 (13.1%) |
| 55 to 64 Years | 598,497 (90.8%) | 60,781 (9.2%) |
| 65 to 74 Years | 509,308 (99.4%) | 2,958 (0.6%) |
| 75 Years and older | 335,093 (99.8%) | 714 (0.2%) |
| Total | 4,472,902 (90.4%) | 472,079 (9.6%) |
Health Insurance Coverage by Citizenship Status in Alabama
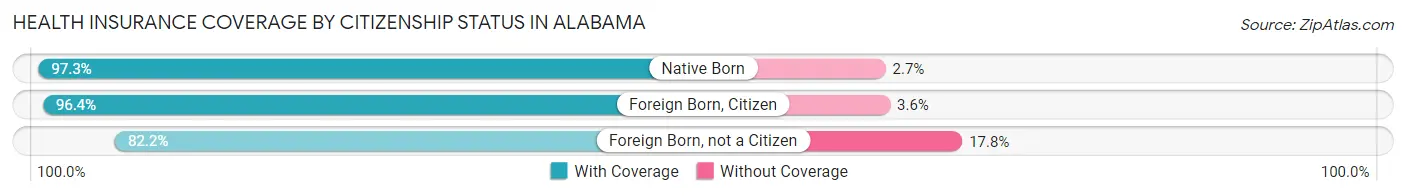
| Citizenship Status | With Coverage | Without Coverage |
| Native Born | 341,423 (97.3%) | 9,532 (2.7%) |
| Foreign Born, Citizen | 803,463 (96.4%) | 29,953 (3.6%) |
| Foreign Born, not a Citizen | 388,898 (82.2%) | 84,059 (17.8%) |
Health Insurance Coverage by Household Income in Alabama
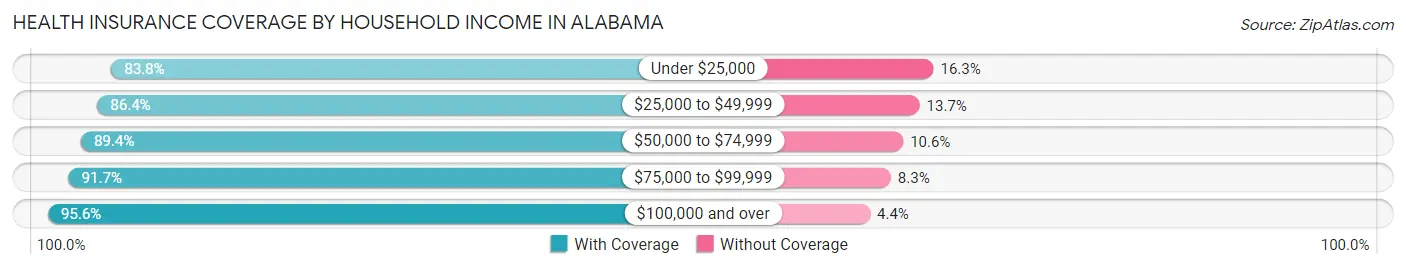
| Household Income | With Coverage | Without Coverage |
| Under $25,000 | 634,296 (83.8%) | 123,038 (16.3%) |
| $25,000 to $49,999 | 798,264 (86.4%) | 126,141 (13.7%) |
| $50,000 to $74,999 | 736,019 (89.4%) | 87,034 (10.6%) |
| $75,000 to $99,999 | 623,892 (91.7%) | 56,159 (8.3%) |
| $100,000 and over | 1,622,090 (95.6%) | 74,083 (4.4%) |
Public vs Private Health Insurance Coverage by Age in Alabama
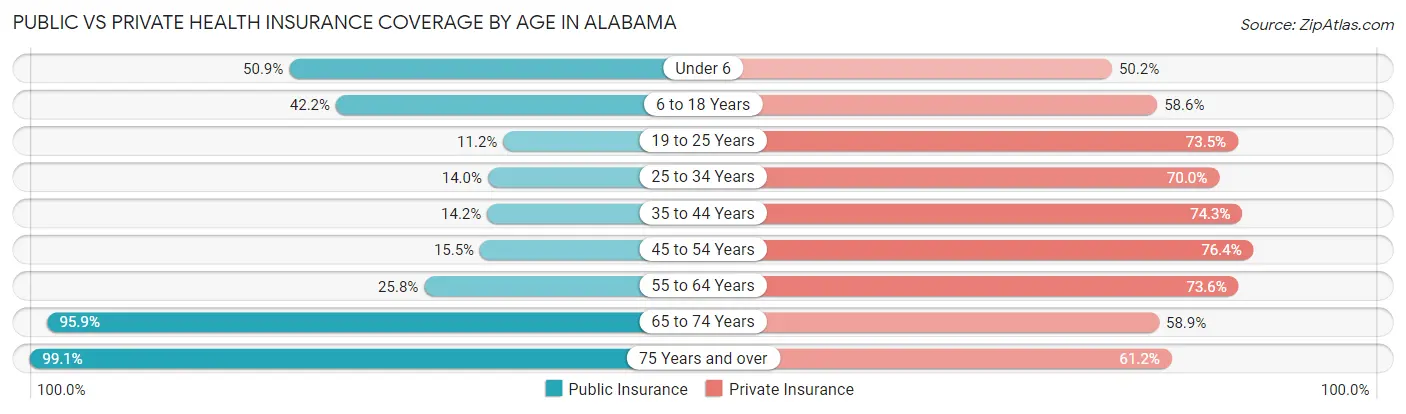
| Age Bracket | Public Insurance | Private Insurance |
| Under 6 | 178,632 (50.9%) | 176,002 (50.1%) |
| 6 to 18 Years | 351,986 (42.2%) | 487,973 (58.6%) |
| 19 to 25 Years | 52,852 (11.2%) | 347,720 (73.5%) |
| 25 to 34 Years | 79,464 (14.0%) | 396,856 (70.0%) |
| 35 to 44 Years | 84,891 (14.1%) | 445,827 (74.3%) |
| 45 to 54 Years | 95,000 (15.5%) | 469,054 (76.4%) |
| 55 to 64 Years | 170,326 (25.8%) | 485,460 (73.6%) |
| 65 to 74 Years | 491,439 (95.9%) | 301,676 (58.9%) |
| 75 Years and over | 332,814 (99.1%) | 205,568 (61.2%) |
| Total | 1,837,404 (37.2%) | 3,316,136 (67.1%) |
Disability Status by Sex by Age in Alabama
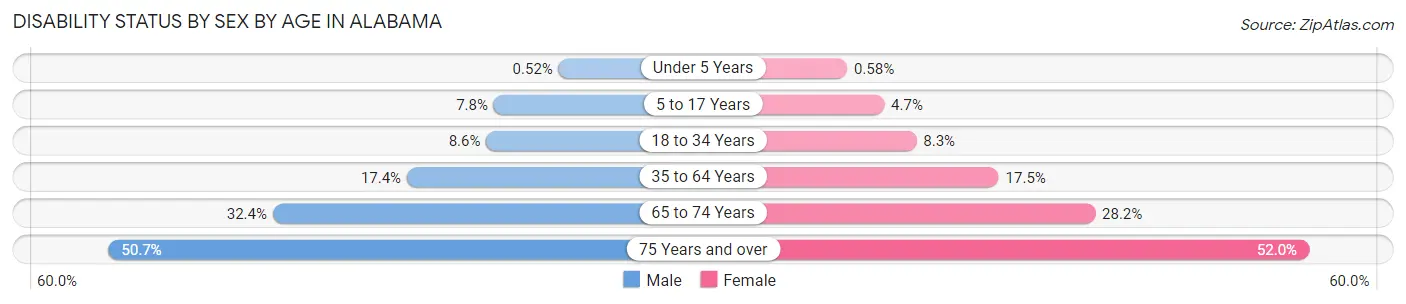
| Age Bracket | Male | Female |
| Under 5 Years | 774 (0.5%) | 820 (0.6%) |
| 5 to 17 Years | 32,345 (7.7%) | 18,894 (4.7%) |
| 18 to 34 Years | 46,956 (8.6%) | 47,111 (8.3%) |
| 35 to 64 Years | 156,978 (17.4%) | 169,777 (17.5%) |
| 65 to 74 Years | 76,705 (32.4%) | 77,636 (28.2%) |
| 75 Years and over | 68,544 (50.7%) | 104,306 (52.0%) |
Disability Class by Sex by Age in Alabama
Disability Class: Hearing Difficulty
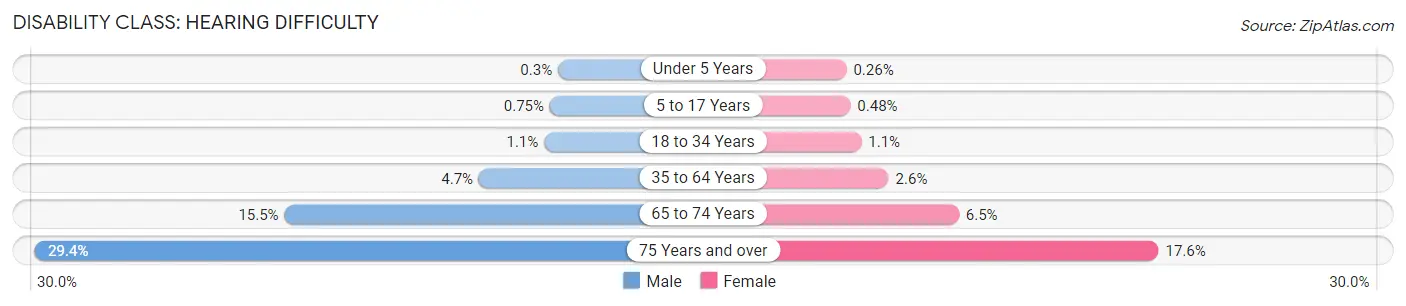
| Age Bracket | Male | Female |
| Under 5 Years | 455 (0.3%) | 367 (0.3%) |
| 5 to 17 Years | 3,112 (0.7%) | 1,926 (0.5%) |
| 18 to 34 Years | 5,868 (1.1%) | 6,203 (1.1%) |
| 35 to 64 Years | 42,361 (4.7%) | 25,360 (2.6%) |
| 65 to 74 Years | 36,803 (15.5%) | 17,936 (6.5%) |
| 75 Years and over | 39,806 (29.4%) | 35,377 (17.6%) |
Disability Class: Vision Difficulty
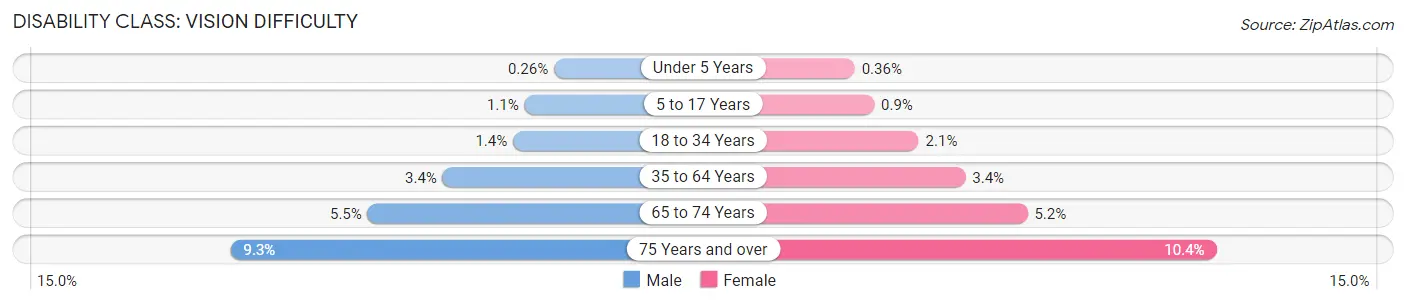
| Age Bracket | Male | Female |
| Under 5 Years | 388 (0.3%) | 517 (0.4%) |
| 5 to 17 Years | 4,509 (1.1%) | 3,601 (0.9%) |
| 18 to 34 Years | 7,655 (1.4%) | 12,144 (2.1%) |
| 35 to 64 Years | 30,269 (3.4%) | 33,439 (3.4%) |
| 65 to 74 Years | 12,907 (5.4%) | 14,235 (5.2%) |
| 75 Years and over | 12,537 (9.3%) | 20,918 (10.4%) |
Disability Class: Cognitive Difficulty
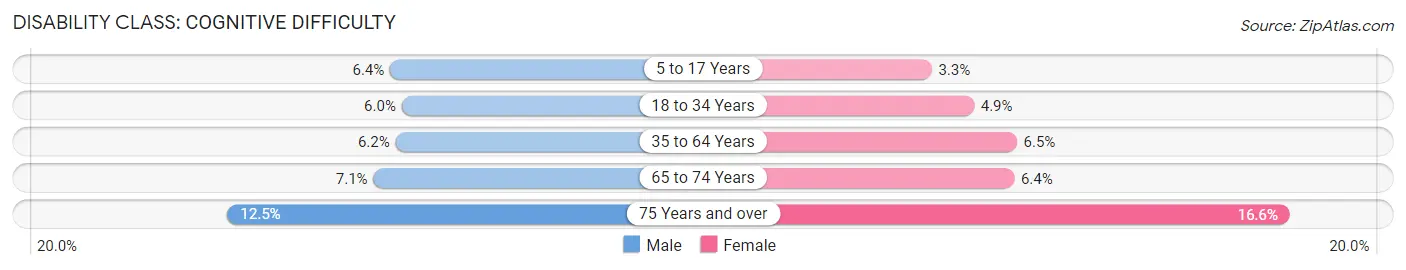
| Age Bracket | Male | Female |
| 5 to 17 Years | 26,831 (6.4%) | 13,311 (3.3%) |
| 18 to 34 Years | 32,814 (6.0%) | 27,828 (4.9%) |
| 35 to 64 Years | 56,176 (6.2%) | 63,028 (6.5%) |
| 65 to 74 Years | 16,706 (7.0%) | 17,594 (6.4%) |
| 75 Years and over | 16,876 (12.5%) | 33,346 (16.6%) |
Disability Class: Ambulatory Difficulty
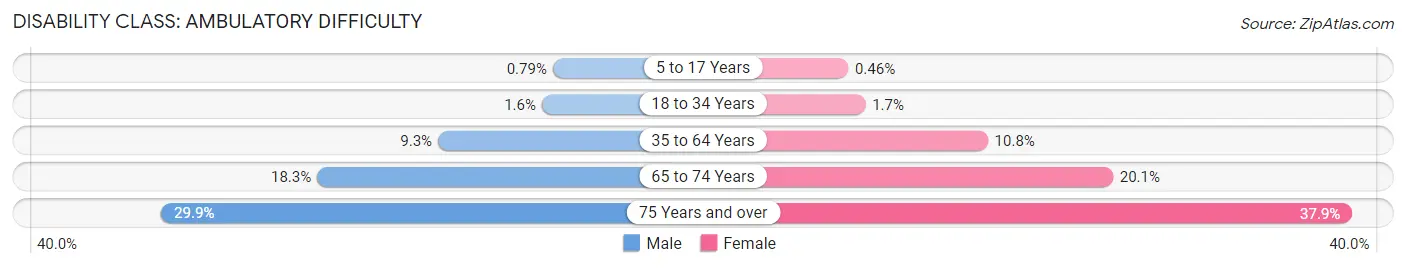
| Age Bracket | Male | Female |
| 5 to 17 Years | 3,310 (0.8%) | 1,850 (0.5%) |
| 18 to 34 Years | 8,739 (1.6%) | 9,867 (1.7%) |
| 35 to 64 Years | 83,865 (9.3%) | 105,289 (10.8%) |
| 65 to 74 Years | 43,352 (18.3%) | 55,372 (20.1%) |
| 75 Years and over | 40,406 (29.9%) | 75,967 (37.9%) |
Disability Class: Self-Care Difficulty
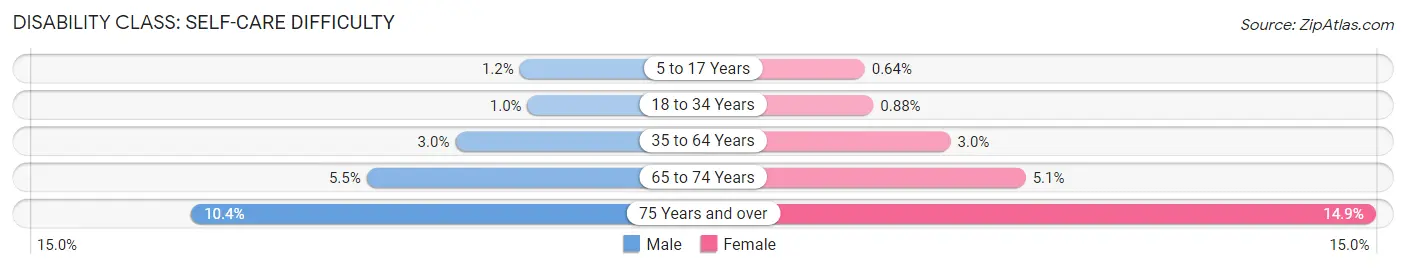
| Age Bracket | Male | Female |
| 5 to 17 Years | 5,077 (1.2%) | 2,546 (0.6%) |
| 18 to 34 Years | 5,499 (1.0%) | 5,015 (0.9%) |
| 35 to 64 Years | 27,127 (3.0%) | 29,486 (3.0%) |
| 65 to 74 Years | 12,991 (5.5%) | 14,100 (5.1%) |
| 75 Years and over | 14,014 (10.4%) | 29,794 (14.9%) |
Technology Access in Alabama
Computing Device Access in Alabama
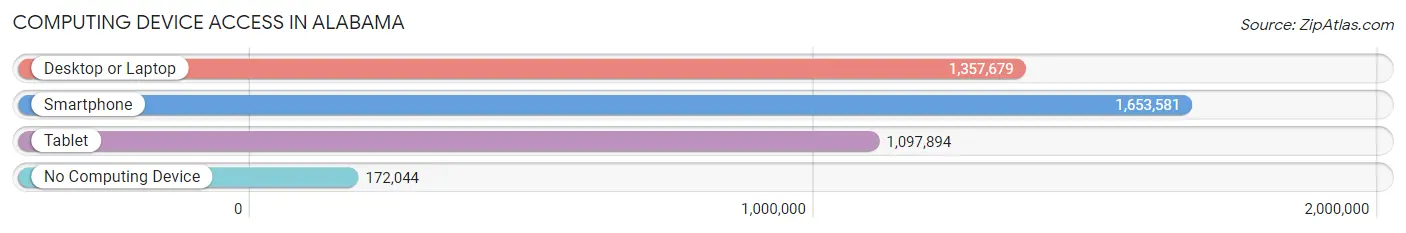
| Device Type | # Households | % Households |
| Desktop or Laptop | 1,357,679 | 70.2% |
| Smartphone | 1,653,581 | 85.5% |
| Tablet | 1,097,894 | 56.8% |
| No Computing Device | 172,044 | 8.9% |
| Total | 1,933,150 | 100.0% |
Internet Access in Alabama
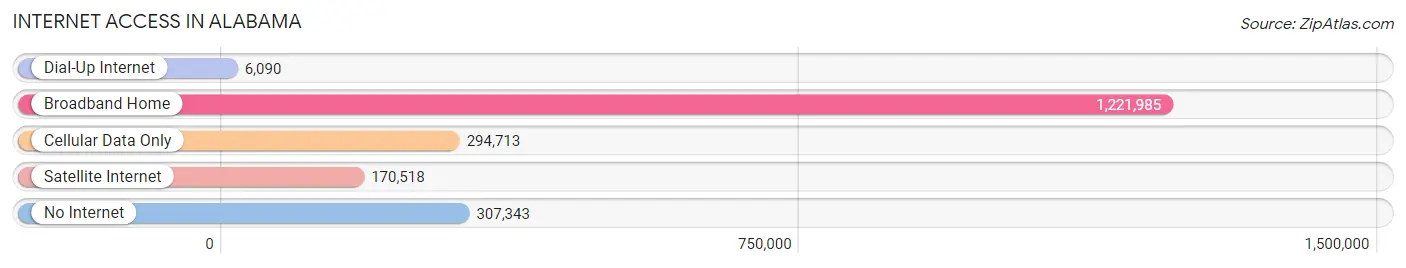
| Internet Type | # Households | % Households |
| Dial-Up Internet | 6,090 | 0.3% |
| Broadband Home | 1,221,985 | 63.2% |
| Cellular Data Only | 294,713 | 15.2% |
| Satellite Internet | 170,518 | 8.8% |
| No Internet | 307,343 | 15.9% |
| Total | 1,933,150 | 100.0% |
Alabama Summary
Alabama is a state located in the southeastern region of the United States. It is bordered by Tennessee to the north, Georgia to the east, Florida and the Gulf of Mexico to the south, and Mississippi to the west. Alabama is the 30th largest state in the United States, with an area of 52,419 square miles (135,765 km2). It is the 24th most populous state, with a population of 4,858,979 as of 2019. The state capital is Montgomery, and the largest city is Birmingham.
Geography
Alabama is located in the southeastern region of the United States. It is bordered by Tennessee to the north, Georgia to the east, Florida and the Gulf of Mexico to the south, and Mississippi to the west. The state is divided into 67 counties, with the majority of the population living in the central and northern parts of the state. The state has a total area of 52,419 square miles (135,765 km2), making it the 30th largest state in the United States. The highest point in the state is Cheaha Mountain, which has an elevation of 2,407 feet (734 m). The state has a humid subtropical climate, with hot, humid summers and mild winters.
History
Alabama was first inhabited by Native American tribes, including the Cherokee, Choctaw, Creek, and Chickasaw. The first Europeans to explore the area were Spanish explorers in the 16th century. The area was later claimed by the French, who established the first permanent settlement in 1702. The area was ceded to the British in 1763, and became part of the United States in 1783 after the American Revolution. Alabama became the 22nd state in 1819.
During the 19th century, Alabama was a major center of the cotton industry, and the state's economy was heavily dependent on slavery. After the Civil War, the state was readmitted to the Union in 1868. During the Reconstruction era, the state was the site of several civil rights struggles, including the Montgomery Bus Boycott of 1955-56. In the late 20th century, Alabama's economy shifted from agriculture to manufacturing and services.
Economy
Alabama's economy is largely based on agriculture, manufacturing, and services. The state is a major producer of cotton, poultry, and peanuts. Other important agricultural products include soybeans, corn, and hay. The state is also a major producer of steel, automobiles, and paper products. The state's largest industries are manufacturing, health care, and education.
Demographics
As of 2019, the population of Alabama was 4,858,979. The state has a population density of 92.7 people per square mile (35.8/km2). The largest racial group in the state is white, making up 68.5% of the population. African Americans make up 26.2% of the population, and Hispanics and Latinos make up 4.2%. The median household income in the state is $48,123, and the median age is 38.7 years.
Alabama is a diverse state, with a variety of religious affiliations. The largest religious group in the state is Christianity, with Baptists making up the largest denomination. Other religious groups include Islam, Judaism, and Hinduism.
Conclusion
Alabama is a state located in the southeastern region of the United States. It is bordered by Tennessee to the north, Georgia to the east, Florida and the Gulf of Mexico to the south, and Mississippi to the west. The state has a total area of 52,419 square miles (135,765 km2), making it the 30th largest state in the United States. Alabama has a humid subtropical climate, with hot, humid summers and mild winters. The state's economy is largely based on agriculture, manufacturing, and services. As of 2019, the population of Alabama was 4,858,979, with the largest racial group being white. Christianity is the largest religious group in the state, with Baptists making up the largest denomination.
Common Questions
When was Alabama Incorporated?
Alabama was Incorporated into the Union on Dec 14, 1819.
What is the Total Area of Alabama?
Total Area of Alabama is 52,420 Square Miles.
What is the Total Land Area of Alabama?
Total Land Area of Alabama is 50,644 Square Miles.
What is the Total Water Area of Alabama?
Total Water Area of Alabama is 1,776 Square Miles.
What is the Average Elevation in Alabama?
Average Elevation in Alabama is 500 Feet.
What is the Highest Elevation in Alabama?
Highest Elevation in Alabama is 2,407 Feet.
What is the Lowest Elevation in Alabama?
Lowest Elevation in Alabama is 0 Feet.
What is the Population Density in Alabama?
Population Density in Alabama is 99.3 People per Square Mile.
What is Per Capita Income in Alabama?
Per Capita income in Alabama is $33,344.
What is the Median Family Income in Alabama?
Median Family Income in Alabama is $77,363.
What is the Median Household income in Alabama?
Median Household Income in Alabama is $59,609.
What is Income or Wage Gap in Alabama?
Income or Wage Gap in Alabama is 34.0%.
Women in Alabama earn 66.0 cents for every dollar earned by a man.
What is Family Income Deficit in Alabama?
Family Income Deficit in Alabama is $10,802.
Families that are below poverty line in Alabama earn $10,802 less on average than the poverty threshold level.
What is Inequality or Gini Index in Alabama?
Inequality or Gini Index in Alabama is 0.48.
What is the Total Population of Alabama?
Total Population of Alabama is 5,028,092.
What is the Total Male Population of Alabama?
Total Male Population of Alabama is 2,445,995.
What is the Total Female Population of Alabama?
Total Female Population of Alabama is 2,582,097.
What is the Ratio of Males per 100 Females in Alabama?
There are 94.73 Males per 100 Females in Alabama.
What is the Ratio of Females per 100 Males in Alabama?
There are 105.56 Females per 100 Males in Alabama.
What is the Median Population Age in Alabama?
Median Population Age in Alabama is 39.3 Years.
What is the Average Family Size in Alabama
Average Family Size in Alabama is 3.2 People.
What is the Average Household Size in Alabama
Average Household Size in Alabama is 2.5 People.
How Large is the Labor Force in Alabama?
There are 2,347,036 People in the Labor Forcein in Alabama.
What is the Percentage of People in the Labor Force in Alabama?
58.0% of People are in the Labor Force in Alabama.
What is the Unemployment Rate in Alabama?
Unemployment Rate in Alabama is 5.2%.