Cities with the Highest Percentage of Population Employed in Computer & Mathematics in California
RELATED REPORTS & OPTIONS
Computer & Mathematics
California
Compare Cities
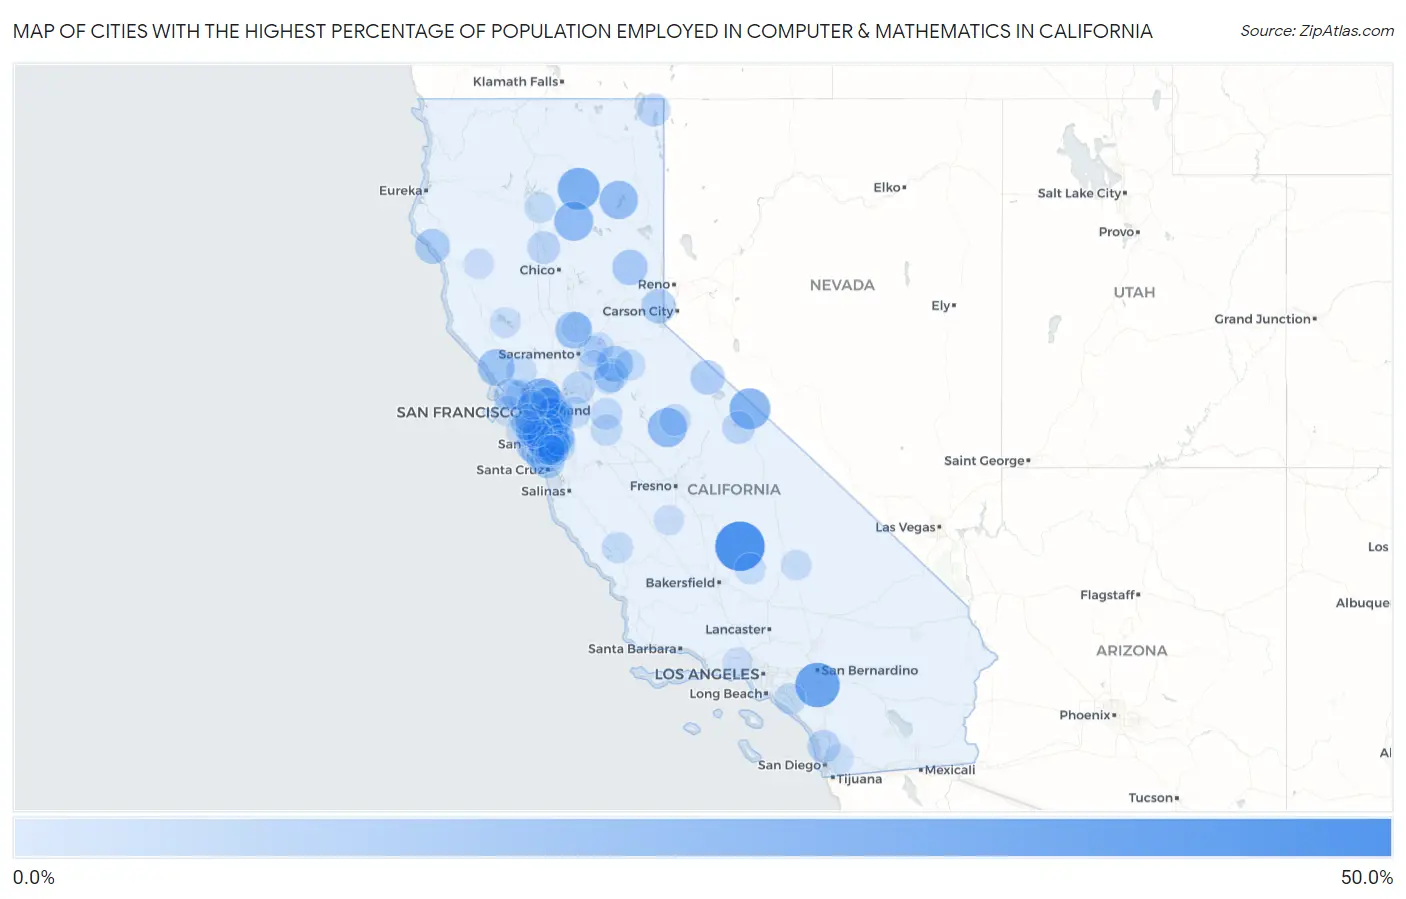
Map of Cities with the Highest Percentage of Population Employed in Computer & Mathematics in California
0.0%
50.0%
Cities with the Highest Percentage of Population Employed in Computer & Mathematics in California
| City | % Employed | vs State | vs National | |
| 1. | California Hot Springs | 50.0% | 4.1%(+45.9)#1 | 3.5%(+46.5)#22 |
| 2. | March Arb | 38.8% | 4.1%(+34.7)#2 | 3.5%(+35.2)#39 |
| 3. | Stones Landing | 35.6% | 4.1%(+31.5)#3 | 3.5%(+32.1)#48 |
| 4. | Hat Creek | 33.3% | 4.1%(+29.2)#4 | 3.5%(+29.8)#59 |
| 5. | Alhambra Valley | 31.3% | 4.1%(+27.2)#5 | 3.5%(+27.8)#65 |
| 6. | Benton | 30.8% | 4.1%(+26.7)#6 | 3.5%(+27.2)#66 |
| 7. | Sunnyvale | 28.3% | 4.1%(+24.2)#7 | 3.5%(+24.8)#78 |
| 8. | Bear Valley Cdp Alpine County | 28.3% | 4.1%(+24.2)#8 | 3.5%(+24.7)#79 |
| 9. | Williams Canyon | 27.8% | 4.1%(+23.7)#9 | 3.5%(+24.3)#85 |
| 10. | Mineral | 27.1% | 4.1%(+23.0)#10 | 3.5%(+23.6)#89 |
| 11. | Midpines | 27.0% | 4.1%(+22.9)#11 | 3.5%(+23.5)#90 |
| 12. | Spaulding | 25.5% | 4.1%(+21.4)#12 | 3.5%(+21.9)#99 |
| 13. | Cupertino | 24.4% | 4.1%(+20.3)#13 | 3.5%(+20.9)#109 |
| 14. | Mountain View | 23.5% | 4.1%(+19.4)#14 | 3.5%(+20.0)#114 |
| 15. | La Honda | 22.8% | 4.1%(+18.7)#15 | 3.5%(+19.2)#126 |
| 16. | Santa Clara | 22.5% | 4.1%(+18.4)#16 | 3.5%(+18.9)#129 |
| 17. | Nicolaus | 22.4% | 4.1%(+18.3)#17 | 3.5%(+18.9)#130 |
| 18. | Occidental | 22.1% | 4.1%(+18.0)#18 | 3.5%(+18.6)#135 |
| 19. | Foster City | 22.0% | 4.1%(+17.9)#19 | 3.5%(+18.5)#138 |
| 20. | Fremont | 20.8% | 4.1%(+16.7)#20 | 3.5%(+17.2)#160 |
| 21. | Drytown | 20.0% | 4.1%(+15.9)#21 | 3.5%(+16.5)#166 |
| 22. | Dublin | 19.7% | 4.1%(+15.6)#22 | 3.5%(+16.2)#171 |
| 23. | Milpitas | 19.5% | 4.1%(+15.3)#23 | 3.5%(+15.9)#178 |
| 24. | Clio | 19.4% | 4.1%(+15.3)#24 | 3.5%(+15.9)#179 |
| 25. | Shelter Cove | 18.0% | 4.1%(+13.9)#25 | 3.5%(+14.5)#207 |
| 26. | Carnelian Bay | 17.3% | 4.1%(+13.2)#26 | 3.5%(+13.7)#229 |
| 27. | Choctaw Valley | 17.2% | 4.1%(+13.1)#27 | 3.5%(+13.7)#230 |
| 28. | Bridgeport | 17.0% | 4.1%(+12.9)#28 | 3.5%(+13.4)#236 |
| 29. | Zayante | 16.9% | 4.1%(+12.8)#29 | 3.5%(+13.3)#238 |
| 30. | Los Altos | 16.8% | 4.1%(+12.7)#30 | 3.5%(+13.3)#239 |
| 31. | Camino Tassajara | 16.3% | 4.1%(+12.2)#31 | 3.5%(+12.7)#255 |
| 32. | Castle Hill | 16.3% | 4.1%(+12.2)#32 | 3.5%(+12.7)#256 |
| 33. | Buena Vista | 16.1% | 4.1%(+12.0)#33 | 3.5%(+12.6)#263 |
| 34. | Palo Alto | 16.0% | 4.1%(+11.9)#34 | 3.5%(+12.4)#269 |
| 35. | San Ramon | 15.9% | 4.1%(+11.8)#35 | 3.5%(+12.3)#276 |
| 36. | Loyola | 15.4% | 4.1%(+11.3)#36 | 3.5%(+11.9)#290 |
| 37. | Fruitdale | 14.7% | 4.1%(+10.6)#37 | 3.5%(+11.2)#329 |
| 38. | Saratoga | 14.4% | 4.1%(+10.3)#38 | 3.5%(+10.9)#347 |
| 39. | Lagunitas Forest Knolls | 14.2% | 4.1%(+10.1)#39 | 3.5%(+10.7)#359 |
| 40. | Fort Bidwell | 13.9% | 4.1%(+9.79)#40 | 3.5%(+10.4)#372 |
| 41. | Fairbanks Ranch | 13.6% | 4.1%(+9.52)#41 | 3.5%(+10.1)#388 |
| 42. | Los Molinos | 13.5% | 4.1%(+9.43)#42 | 3.5%(+10.0)#391 |
| 43. | Sunny Slopes | 13.3% | 4.1%(+9.23)#43 | 3.5%(+9.81)#406 |
| 44. | Boulder Creek | 13.0% | 4.1%(+8.92)#44 | 3.5%(+9.50)#432 |
| 45. | Terminous | 12.4% | 4.1%(+8.32)#45 | 3.5%(+8.90)#462 |
| 46. | Pleasanton | 12.4% | 4.1%(+8.31)#46 | 3.5%(+8.89)#463 |
| 47. | Belmont | 12.3% | 4.1%(+8.24)#47 | 3.5%(+8.82)#469 |
| 48. | Norris Canyon | 11.9% | 4.1%(+7.79)#48 | 3.5%(+8.37)#506 |
| 49. | North Gate | 11.7% | 4.1%(+7.60)#49 | 3.5%(+8.18)#526 |
| 50. | San Mateo | 11.5% | 4.1%(+7.38)#50 | 3.5%(+7.96)#542 |
| 51. | Newark | 11.5% | 4.1%(+7.35)#51 | 3.5%(+7.93)#546 |
| 52. | Del Rio | 11.4% | 4.1%(+7.29)#52 | 3.5%(+7.86)#550 |
| 53. | El Portal | 11.4% | 4.1%(+7.27)#53 | 3.5%(+7.85)#553 |
| 54. | Monterey Park Tract | 11.1% | 4.1%(+7.01)#54 | 3.5%(+7.59)#578 |
| 55. | Mountain House | 11.0% | 4.1%(+6.92)#55 | 3.5%(+7.50)#589 |
| 56. | Menlo Park | 10.9% | 4.1%(+6.83)#56 | 3.5%(+7.40)#599 |
| 57. | Union City | 10.7% | 4.1%(+6.64)#57 | 3.5%(+7.22)#620 |
| 58. | Irvine | 10.7% | 4.1%(+6.62)#58 | 3.5%(+7.20)#624 |
| 59. | Bradley | 10.7% | 4.1%(+6.61)#59 | 3.5%(+7.19)#627 |
| 60. | Santa Venetia | 10.7% | 4.1%(+6.59)#60 | 3.5%(+7.17)#632 |
| 61. | Los Gatos | 10.5% | 4.1%(+6.41)#61 | 3.5%(+6.99)#653 |
| 62. | Bodfish | 10.4% | 4.1%(+6.35)#62 | 3.5%(+6.92)#663 |
| 63. | Gold River | 10.4% | 4.1%(+6.25)#63 | 3.5%(+6.83)#674 |
| 64. | West Menlo Park | 10.3% | 4.1%(+6.19)#64 | 3.5%(+6.77)#682 |
| 65. | San Francisco | 10.2% | 4.1%(+6.10)#65 | 3.5%(+6.68)#694 |
| 66. | Campbell | 10.2% | 4.1%(+6.10)#66 | 3.5%(+6.67)#696 |
| 67. | Millville | 10.2% | 4.1%(+6.09)#67 | 3.5%(+6.66)#701 |
| 68. | Camanche North Shore | 10.2% | 4.1%(+6.05)#68 | 3.5%(+6.63)#709 |
| 69. | Eldridge | 10.1% | 4.1%(+6.04)#69 | 3.5%(+6.62)#710 |
| 70. | Los Altos Hills | 10.1% | 4.1%(+5.96)#70 | 3.5%(+6.53)#723 |
| 71. | Lexington Hills | 10.0% | 4.1%(+5.94)#71 | 3.5%(+6.52)#726 |
| 72. | San Jose | 10.0% | 4.1%(+5.87)#72 | 3.5%(+6.45)#741 |
| 73. | East Foothills | 9.9% | 4.1%(+5.78)#73 | 3.5%(+6.36)#751 |
| 74. | Pioneer | 9.8% | 4.1%(+5.68)#74 | 3.5%(+6.26)#773 |
| 75. | Highlands | 9.7% | 4.1%(+5.63)#75 | 3.5%(+6.21)#782 |
| 76. | Emeryville | 9.7% | 4.1%(+5.63)#76 | 3.5%(+6.20)#783 |
| 77. | San Carlos | 9.7% | 4.1%(+5.59)#77 | 3.5%(+6.17)#791 |
| 78. | Elfin Forest | 9.6% | 4.1%(+5.51)#78 | 3.5%(+6.09)#809 |
| 79. | Soda Bay | 9.6% | 4.1%(+5.50)#79 | 3.5%(+6.07)#813 |
| 80. | Silverado | 9.6% | 4.1%(+5.47)#80 | 3.5%(+6.05)#819 |
| 81. | Acalanes Ridge | 9.4% | 4.1%(+5.31)#81 | 3.5%(+5.89)#854 |
| 82. | Ridgecrest | 9.3% | 4.1%(+5.24)#82 | 3.5%(+5.82)#868 |
| 83. | Moss Beach | 9.3% | 4.1%(+5.22)#83 | 3.5%(+5.80)#871 |
| 84. | Redwood City | 9.2% | 4.1%(+5.10)#84 | 3.5%(+5.67)#895 |
| 85. | Cambrian Park | 9.2% | 4.1%(+5.06)#85 | 3.5%(+5.63)#906 |
| 86. | Lemoore Station | 8.9% | 4.1%(+4.79)#86 | 3.5%(+5.37)#959 |
| 87. | Folsom | 8.8% | 4.1%(+4.73)#87 | 3.5%(+5.30)#972 |
| 88. | Covelo | 8.7% | 4.1%(+4.64)#88 | 3.5%(+5.22)#994 |
| 89. | Wilton | 8.7% | 4.1%(+4.64)#89 | 3.5%(+5.22)#997 |
| 90. | Monte Sereno | 8.6% | 4.1%(+4.54)#90 | 3.5%(+5.12)#1,022 |
| 91. | Sleepy Hollow | 8.6% | 4.1%(+4.49)#91 | 3.5%(+5.07)#1,038 |
| 92. | Colma | 8.5% | 4.1%(+4.35)#92 | 3.5%(+4.93)#1,073 |
| 93. | Bell Canyon | 8.4% | 4.1%(+4.29)#93 | 3.5%(+4.87)#1,094 |
| 94. | Brisbane | 8.3% | 4.1%(+4.23)#94 | 3.5%(+4.81)#1,102 |
| 95. | Vine Hill | 8.3% | 4.1%(+4.23)#95 | 3.5%(+4.80)#1,110 |
| 96. | Millbrae | 8.2% | 4.1%(+4.13)#96 | 3.5%(+4.70)#1,137 |
| 97. | Meyers | 8.1% | 4.1%(+4.01)#97 | 3.5%(+4.59)#1,173 |
| 98. | Berkeley | 8.1% | 4.1%(+3.96)#98 | 3.5%(+4.54)#1,192 |
| 99. | Granite Hills | 8.0% | 4.1%(+3.91)#99 | 3.5%(+4.49)#1,208 |
| 100. | Rio Oso | 8.0% | 4.1%(+3.90)#100 | 3.5%(+4.48)#1,214 |
Common Questions
What are the Top 10 Cities with the Highest Percentage of Population Employed in Computer & Mathematics in California?
Top 10 Cities with the Highest Percentage of Population Employed in Computer & Mathematics in California are:
#1
50.0%
#2
38.8%
#3
33.3%
#4
31.3%
#5
30.8%
#6
28.3%
#7
27.1%
#8
27.0%
#9
25.5%
#10
24.4%
What city has the Highest Percentage of Population Employed in Computer & Mathematics in California?
California Hot Springs has the Highest Percentage of Population Employed in Computer & Mathematics in California with 50.0%.
What is the Percentage of Population Employed in Computer & Mathematics in the State of California?
Percentage of Population Employed in Computer & Mathematics in California is 4.1%.
What is the Percentage of Population Employed in Computer & Mathematics in the United States?
Percentage of Population Employed in Computer & Mathematics in the United States is 3.5%.